Seagate Firecuda 520 500GB Performance Testing
We are moving towards using larger test sizes on our benchmarks, but on several tests, we also used the smaller default test sizes. This allows us to see the difference between lighter and heavier workloads. Unfortunately, our entire backlog of SSD reviews did not include this testing methodology, so we are doing the best we can with generating comparison charts.
Blackmagic Disk Speed Test
This is a popular speed test in the video community. It shows whether a storage device is suitable for throughput required at a given video format.
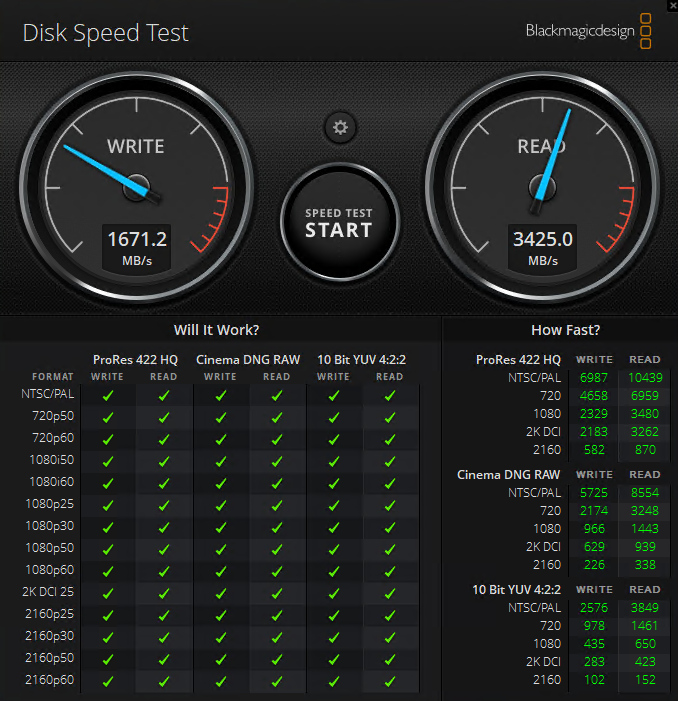
As a PCIe 4.0 NVMe SSD, the Firecuda 520 500GB has a good showing here and handles every format this benchmark can test for.
CrystalDiskMark 7.0.0 x64
CrystalDiskMark is used as a basic starting point for benchmarks as it is something commonly run by end-users as a sanity check.
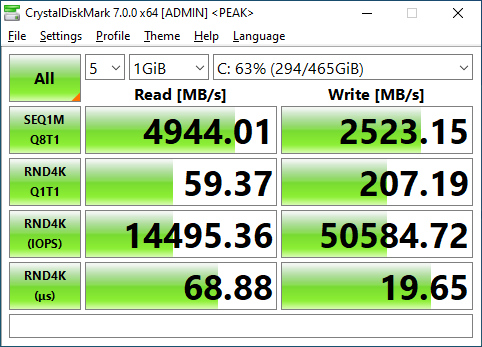
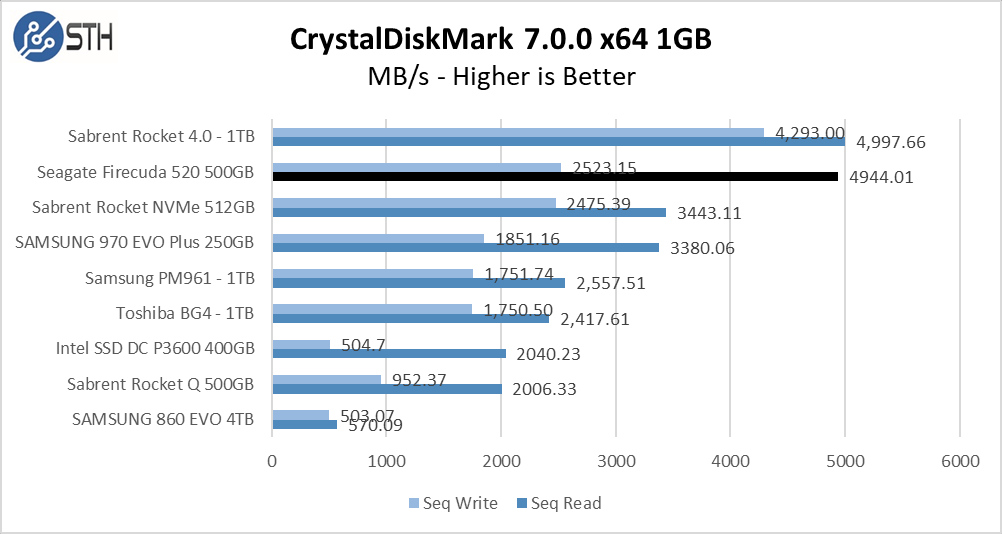
Using the 1GB test set, the Firecuda 520 500GB is achieving numbers almost exactly at the advertised 5000MB/s read and 2500MB/s write. As a result, the read speed easily beats out any PCIe 3.0 SSD. While the write speed is still very good, it is not really taking advantage of the PCIe 4.0 interface.
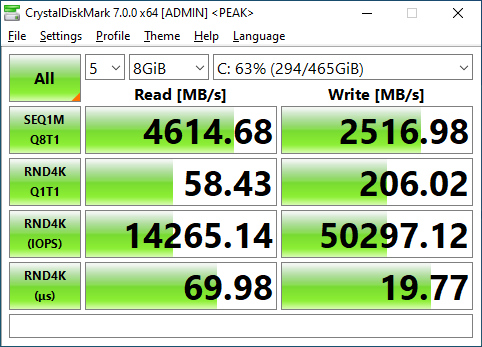
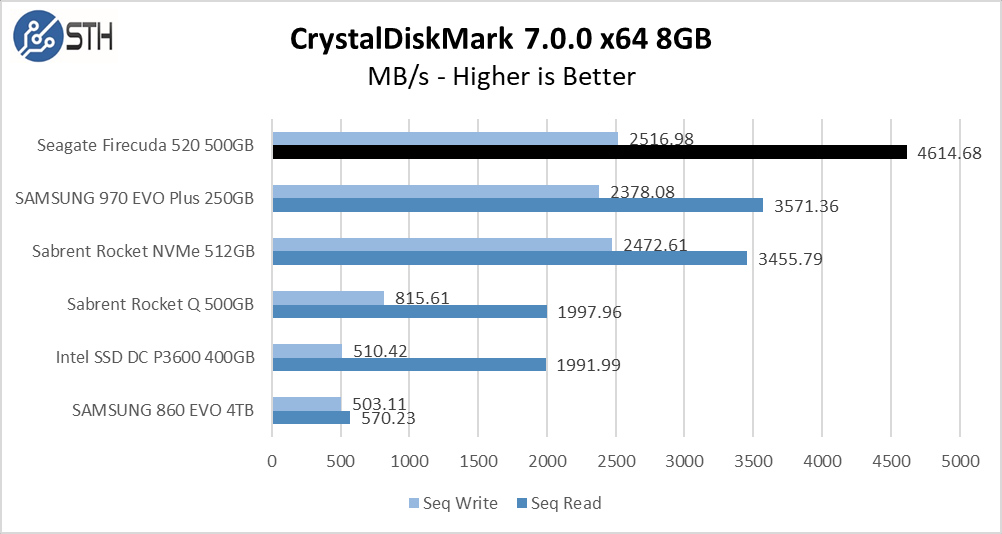
With an 8GB test set, read performance suffers a minor drop but still maintains a healthy lead over the PCIe 3.0 pack of drives. Write performance is unaffected by the larger test set, which is a good sign.
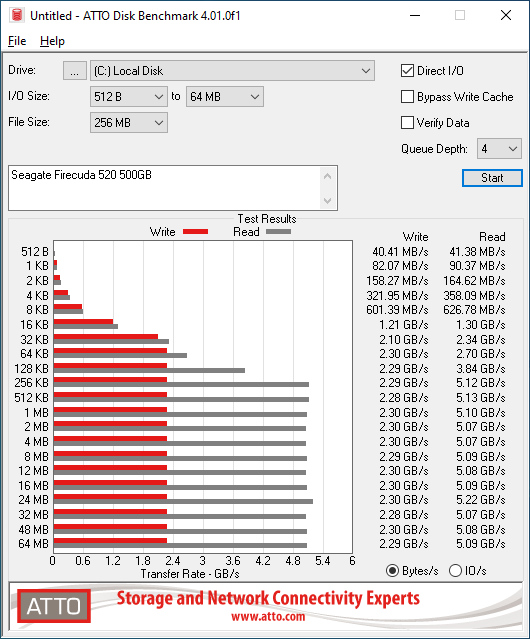
ATTO Disk Benchmark
The ATTO Disk Benchmark has been a staple of drive sequential performance testing for years. ATTO was tested at both 256MB and 8GB file sizes.
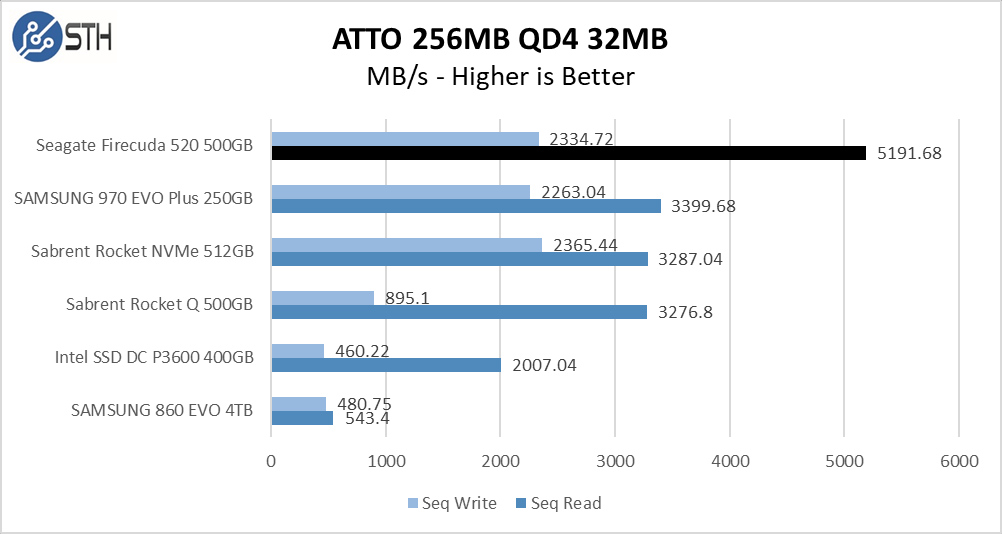
Similar to CrystalDiskMark, ATTO performance is good. Here the read performance is above the advertised 5000MB/s, while the write speeds do not quite hit their 2500MB/s mark.
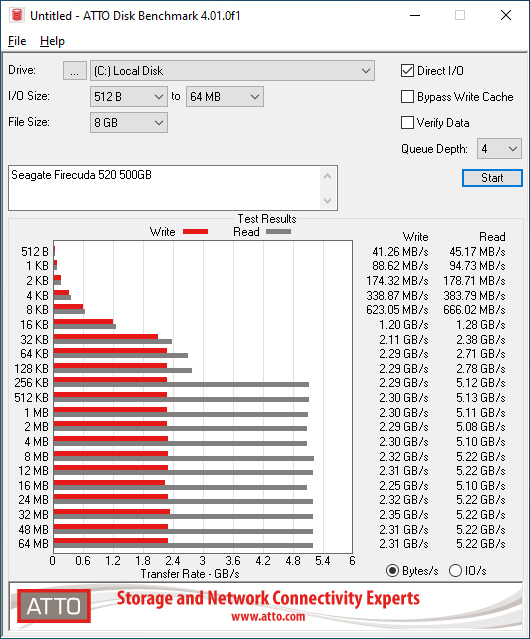
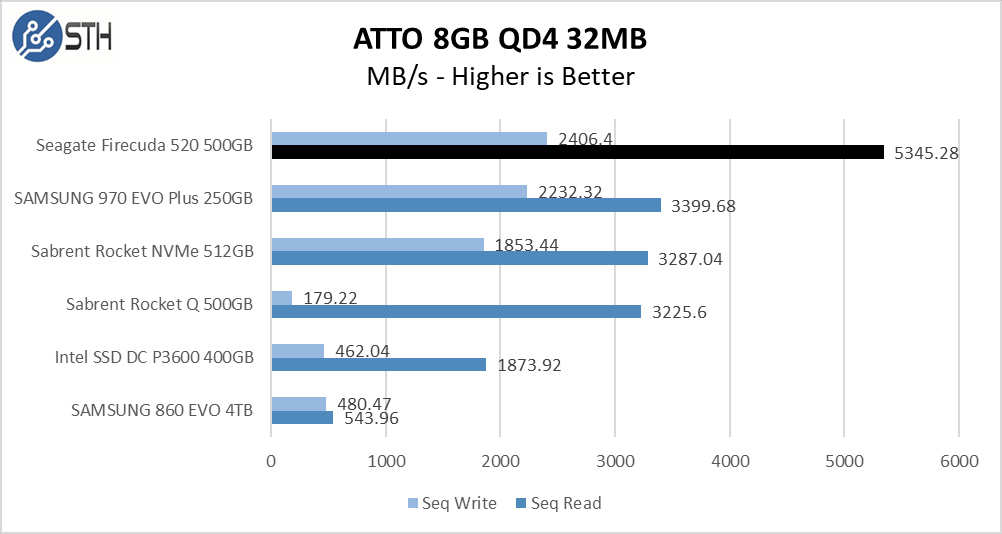
Once we moved to the 8GB file size, the Firecuda 520 500GB seemed to stretch its legs and performance improves compared to the smaller test. This extends the margin of victory over the previous generation drives.
As a quick note here, this is an area where we often see lower-end drives falter at the higher test sizes. Instead, in our ATTO testing, we see a relatively consistent performance.
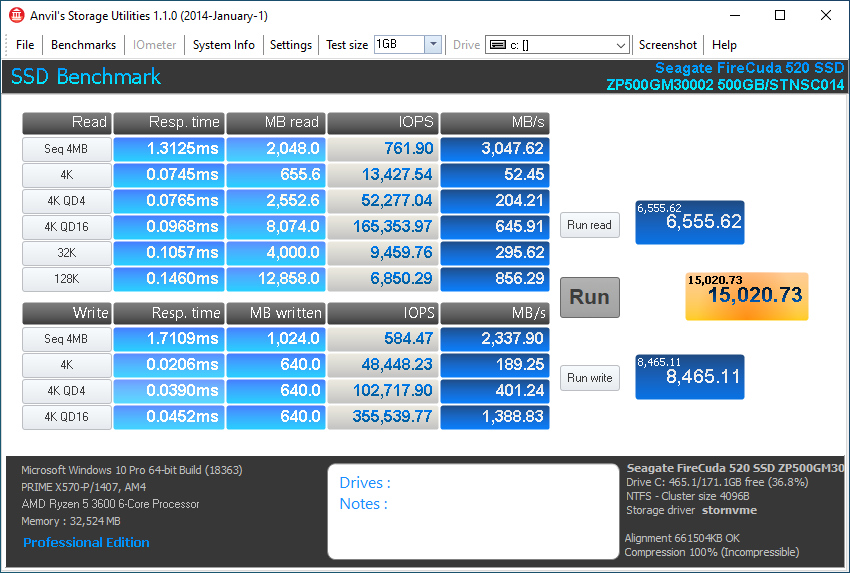
Anvil’s Storage Utilities
Anvil’s Storage Utilities is a comprehensive benchmark that gives us a very in-depth look at the performance of drives tested. This benchmark was run with both a 1GB and 8GB test size.
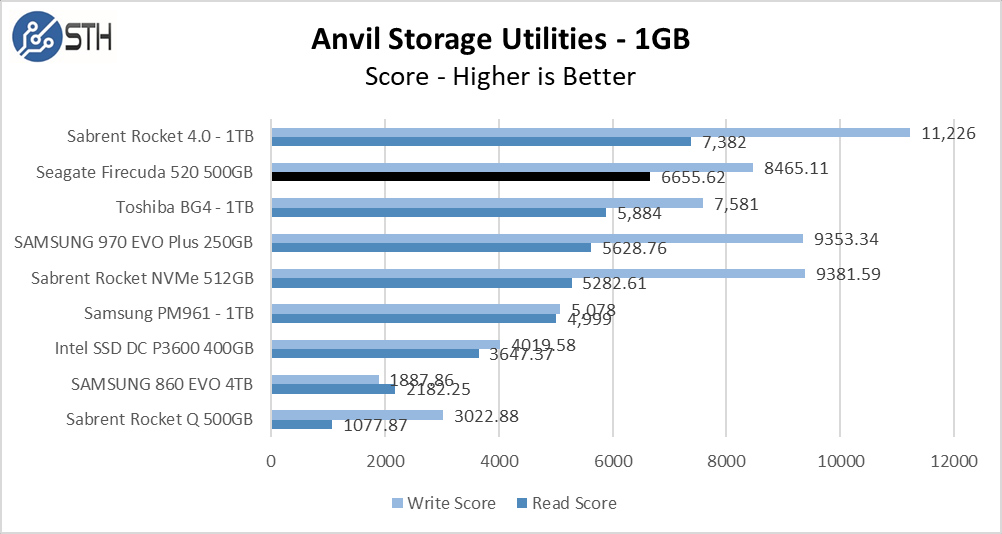
With Anvil running a 1GB test size, sequential performance still beats out any PCIe 3.0 SSD and the read numbers are very good, but the high QD write performance of the 970 EVO Plus and Rocket NVMe drives to allow them to take the write score victory over the Firecuda.

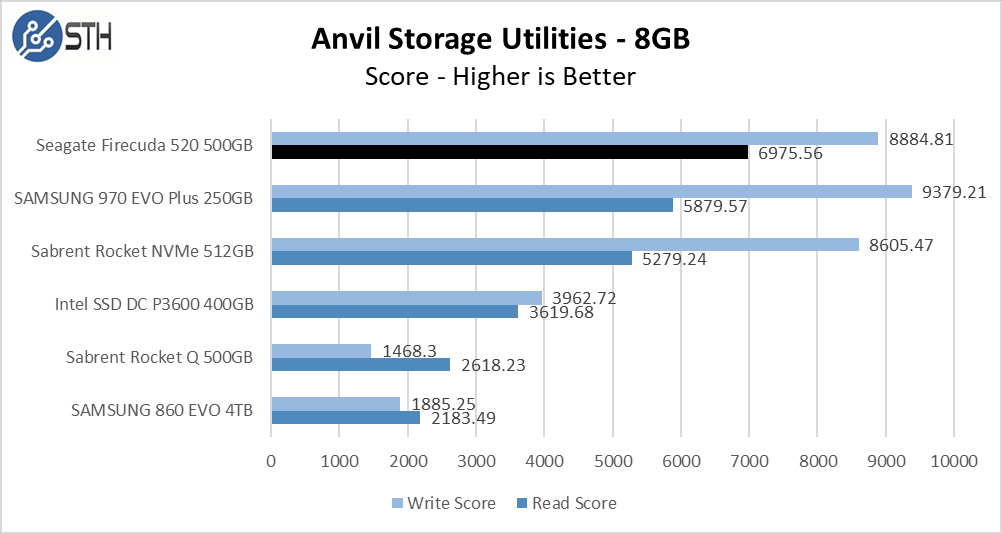
With the larger 8GB test size, the Firecuda 520 500GB comes out on top for read performance and somewhat closes the gap in write performance, now losing out to only the Samsung.
AS SSD Benchmark
AS SSD Benchmark is another good benchmark for testing SSDs. We run all three tests for our series. Like other utilities, it was run with both the default 1GB as well as a larger 10GB test set.

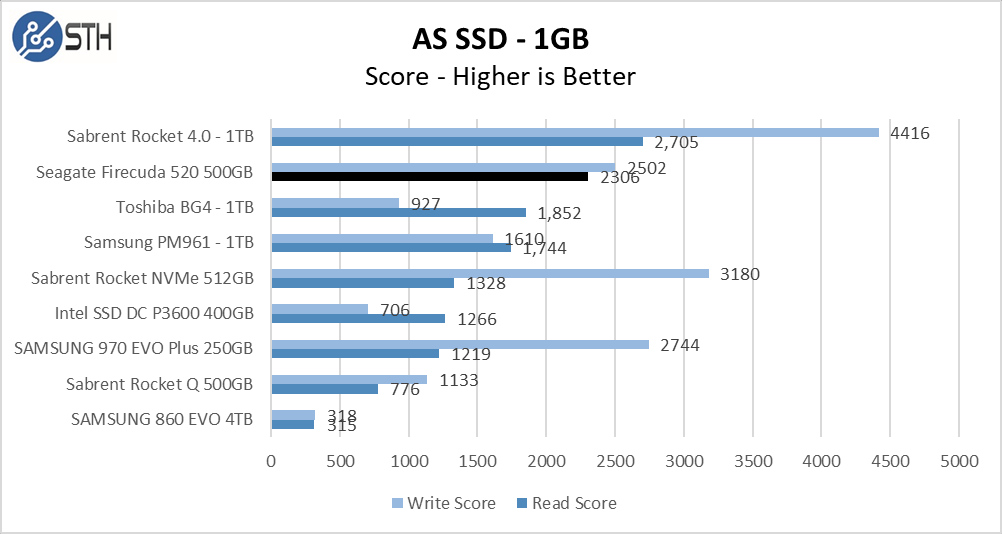
With the smaller test set, the Firecuda 520 500GB continues its trend of read performance that is a clear step above any PCIe 3.0 SSDs, while not exceeding PCIe 3.0 drives in write performance. The recently reviewed Sabrent Rocket NVMe 512GB drive manages a good margin of victory in write performance over the Seagate drive.
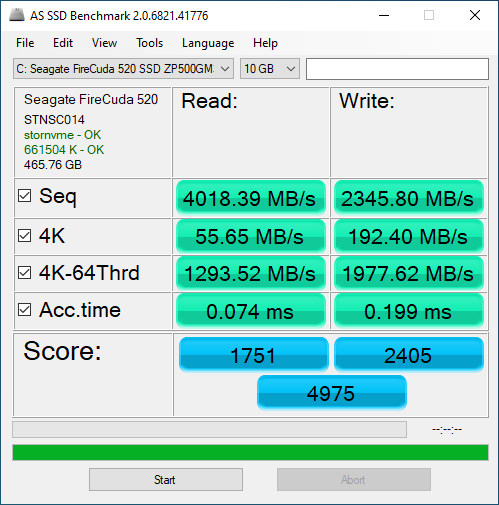
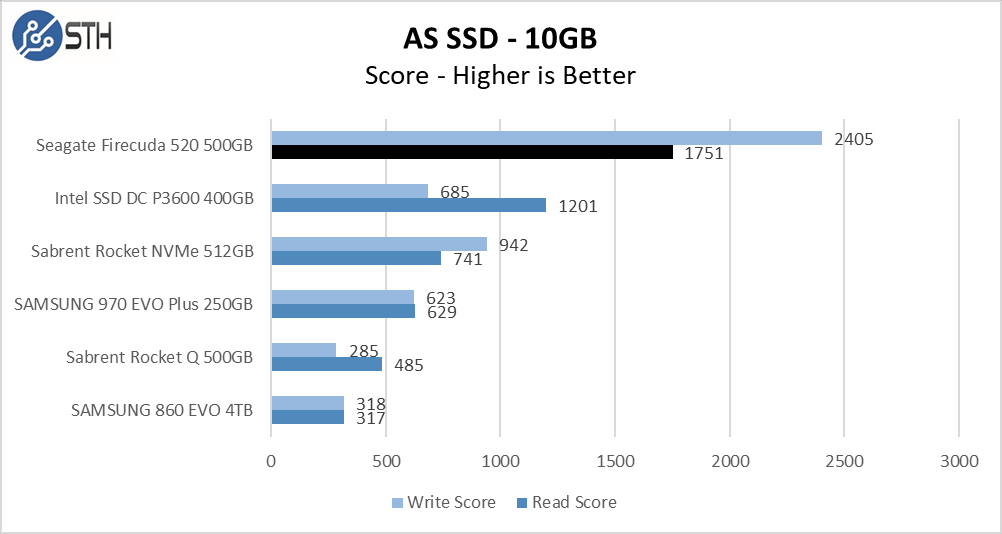
With AS SSD the larger test set has little impact on the sequential numbers, but the 4K-64Thread read results are lower by a decent margin. On the other hand, absolutely excellent write performance from the Firecuda easily puts the drive at the top of that chart.
PCMark, SPECworkstation, and our conclusion are up next.


