Samsung 9100 PRO 8TB Performance Testing
We test using both the default smaller test size and larger test sets on our benchmarks. This allows us to see the difference between lighter and heavier workloads.
CrystalDiskMark x64
CrystalDiskMark is used as a basic starting point for benchmarks as it is something commonly run by end-users as a sanity check.
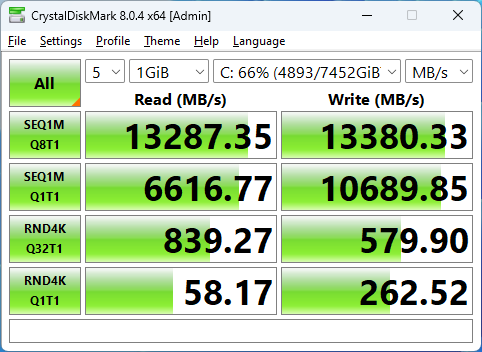
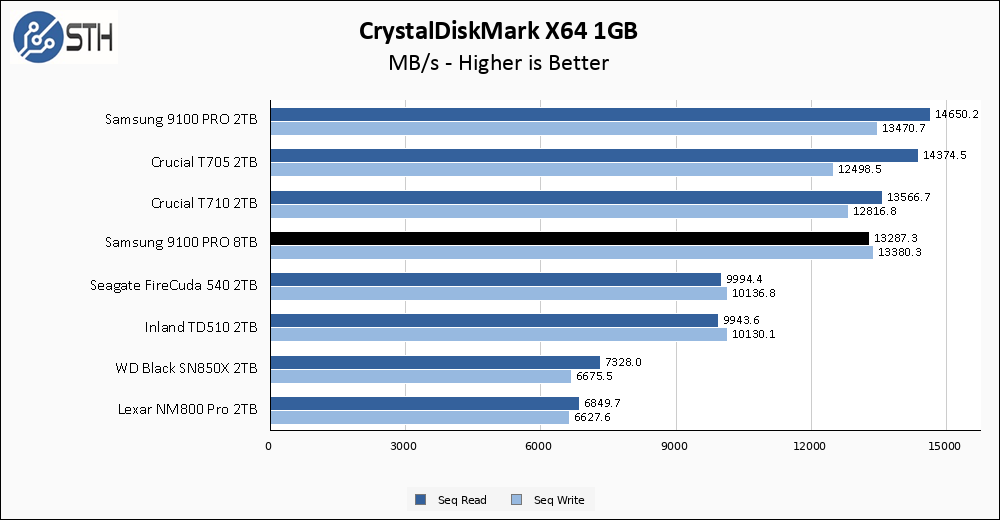
The Samsung 9100 PRO 8TB promised 14800 MB/s read and 13400 MB/s write, and it delivered the goods for write speed but missed the mark for sequential read performance. Mind you 13287 MB/s is still very fast read performance, it just is a solid 1500 MB/s out from the promised performance level. Regardless of the absolute numbers, the 8TB 9100 PRO loses out compared to its smaller 2TB brother in read performance.
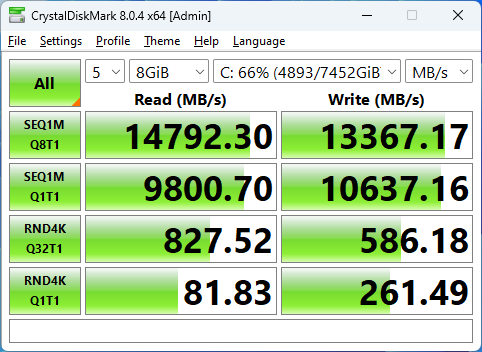
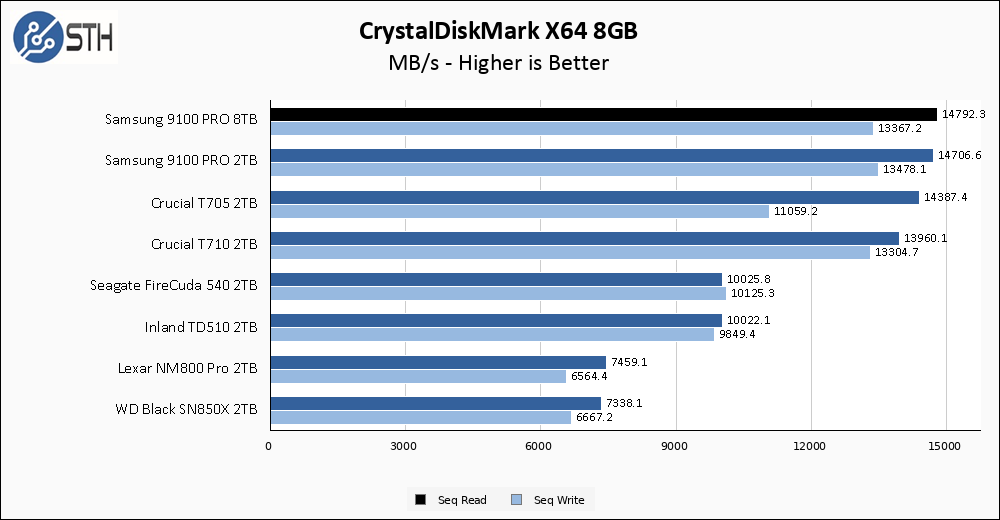
Sometimes the smaller tests can be limiting to drives in some fashion, and the larger test variants can let a drive “stretch its legs” as you might say. The larger CrystalDiskMark test on the 9100 PRO 8TB is one such example. Performance shoots to the top of the chart and the 9100 PRO 8TB delivers on its 14800 MB/s rated read performance, narrowly edging out the 2TB model. This is the performance we were promised, and I am glad to see it.
ATTO Disk Benchmark
The ATTO Disk Benchmark has been a staple of drive sequential performance testing for years. ATTO was tested at both 256MB and 8GB file sizes.
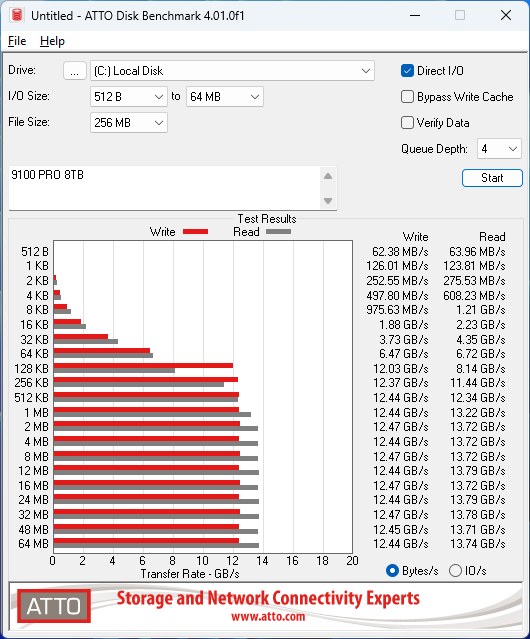
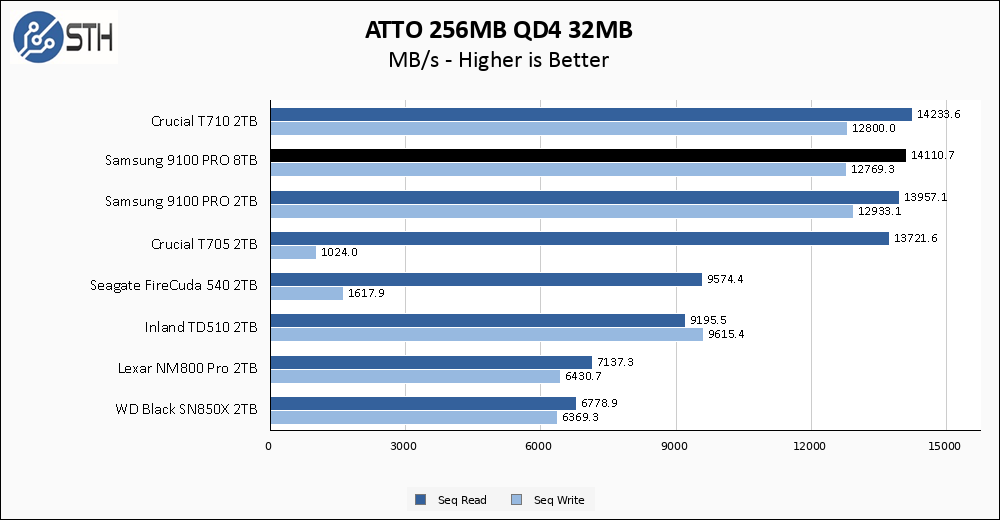
ATTO sequential results are great across the whole test. The Samsung 9100 PRO 8TB turns in results that essentially tie the 2TB model, narrowly losing on read performance but winning on writes. They are all in a dead heat with each other and the Crucial T710.

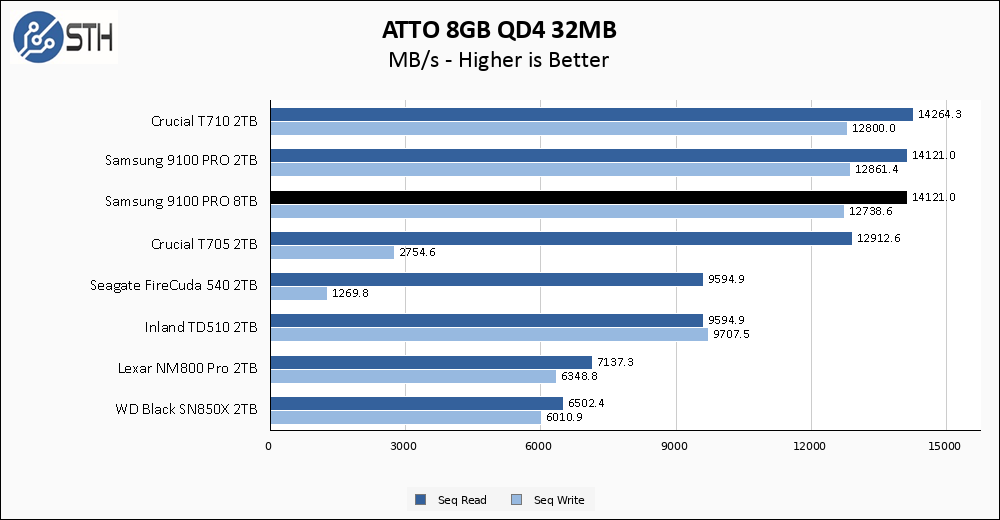
The larger ATTO test gives us another three-way tie at the top. Both 9100 PRO drives and the T710 are battling it out, with results separated by negligible amounts that can be accounted to margin of error or run-to-run variance.
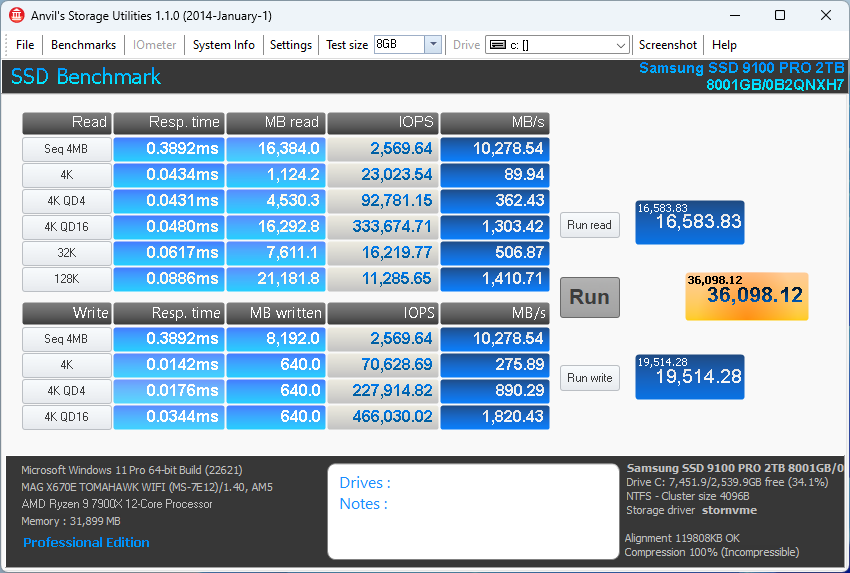
Anvil’s Storage Utilities
Anvil’s Storage Utilities is a comprehensive benchmark that gives us a very in-depth look at the performance of the drives tested. This benchmark was run with both a 1GB and 8GB test size.

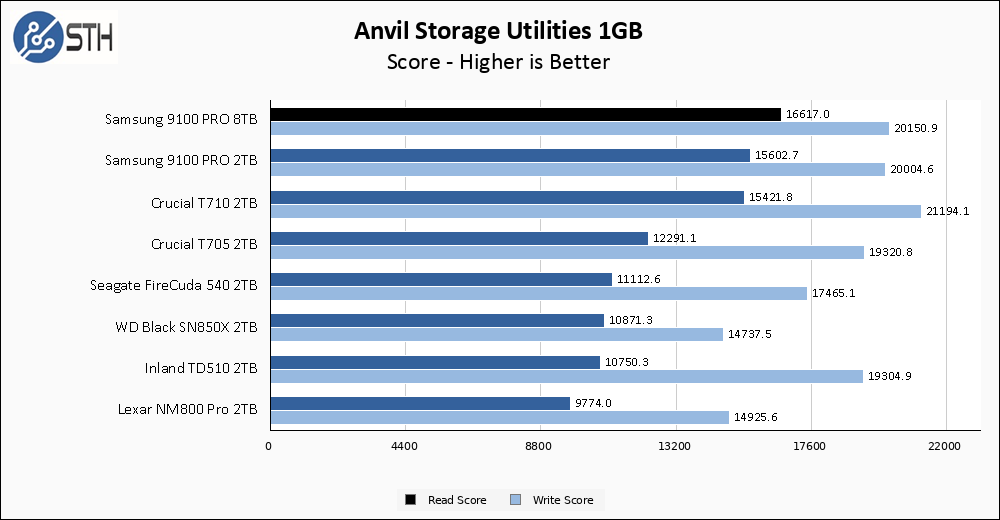
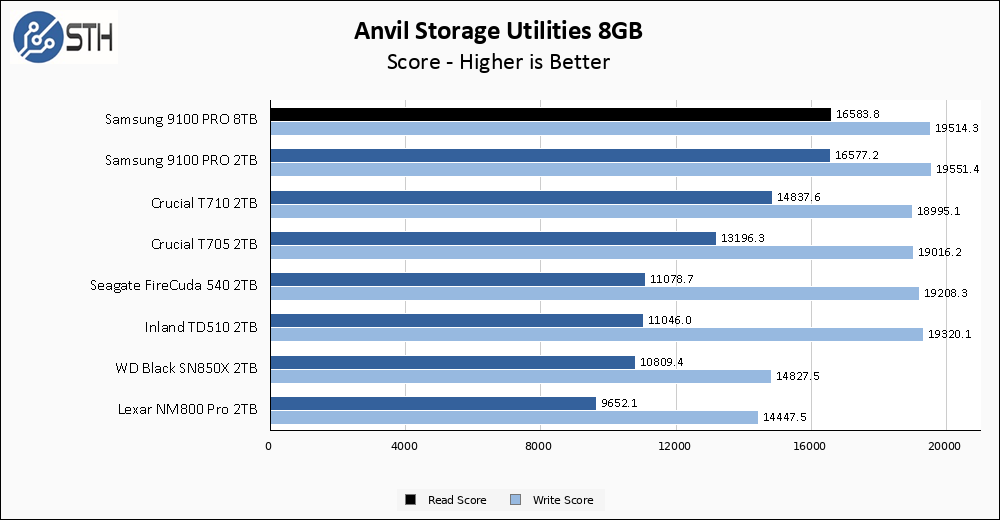
Samsung promised a tiny bump in sequential performance, and a somewhat bigger jump in random reads, on the larger 9100 PRO compared to its 2TB brother, and Anvil is the first test where that can bear fruit. The 9100 PRO takes a comfortable read performance lead over the 2TB drive, and indeed over every other drive on my dataset. Write performance is also spectacular, though the excellent T710 still holds the crown in that metric.
The larger Anvil test shows the 9100 PRO in a dead heat with the 2TB drive. Both the 9100 PRO brothers hold a modest lead over the T710, the next best competitor down the line.
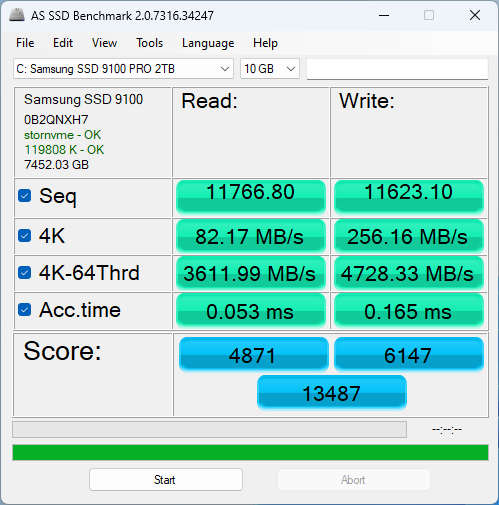
AS SSD Benchmark
AS SSD Benchmark is another good benchmark for testing SSDs. We run all three tests for our series. Like other utilities, it was run with both the default 1GB as well as a larger 10GB test set.
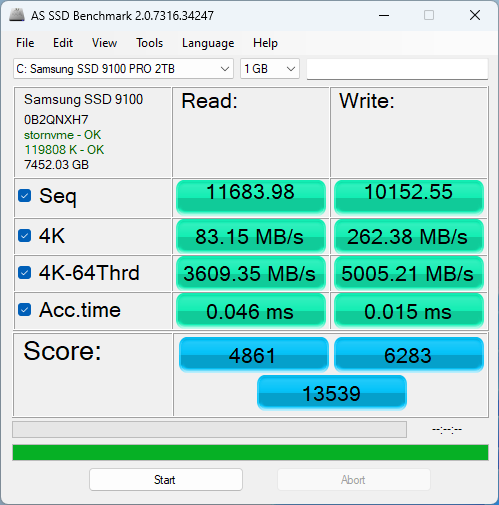
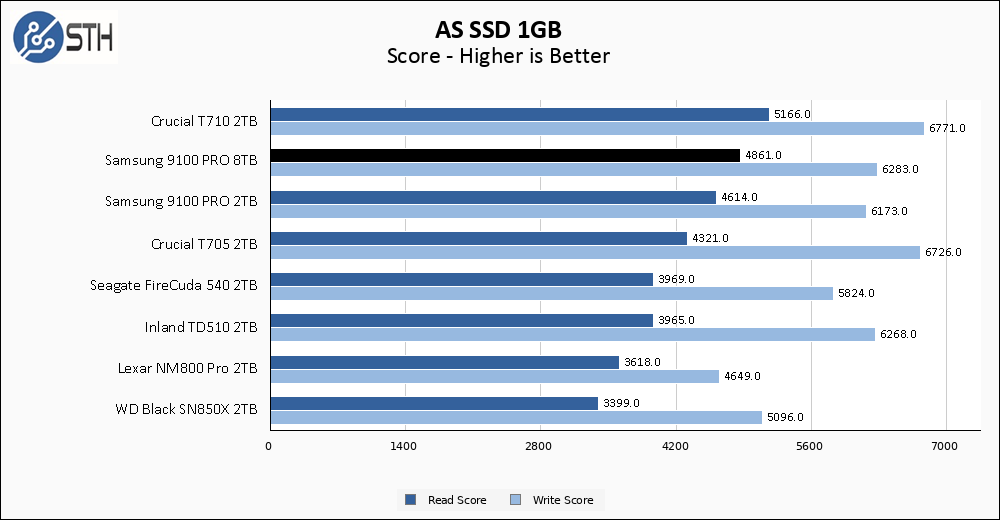
The Crucial T710 is a mighty drive, and in AS SSD it is king. Performance from the 9100 PRO 8TB is still excellent and good for a solid second place in read score. Performance is still modestly improved over the 2TB drive as well, which is good. In write score the results from the 9100 PRO are still very good, but they are not without competition. The T705 and even the older Inland T510 puts up competitive numbers here.
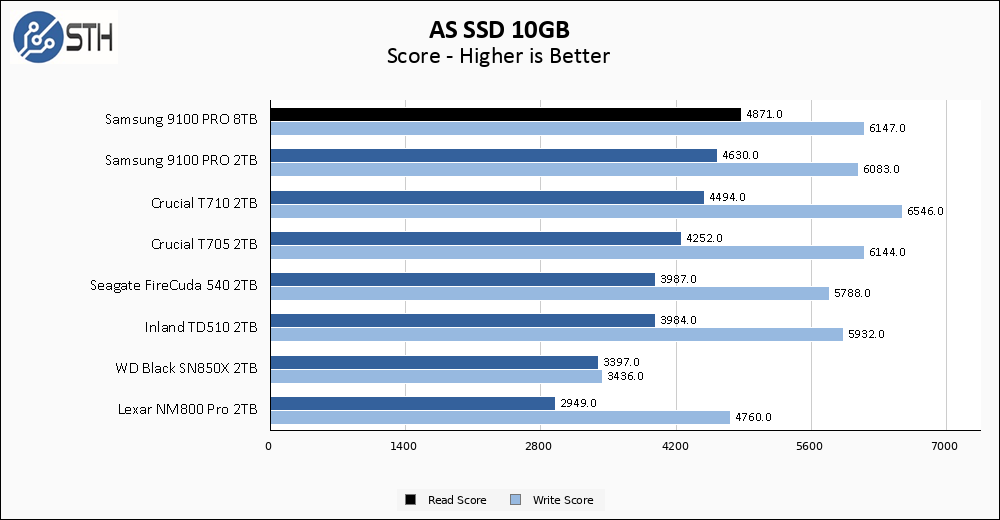
The larger AS SSD test actually shows read performance slightly improve on the 8TB 9100 PRO, which is unusual and allows this drive to snag the top performance spot. Most of the chart reshuffling is due to the T710 dipping slightly on the larger test, but Samsung deserves just as much credit for holding firm. Read score remains good, but within the orbit of other top drives.
SPECworkstation, thermals, and our conclusion are up next.


Samsung 9100 PRO 8TB SSD
Hallo please send me a quote for this samsung SSD plus an external housing please
It’s about tree fiddy.
So if I want sustained writes I should go enterprise or the T705. Good to know.
@Culbrelai
Keep in mind my screenshot was written during an operation where I take the drive from 0% to 85% full. In the case of this drive, I write nearly 7TB of data to it.
If you want sustained writes, and your definition of sustained writes is 500+ GB files written as fast as the drive can write, then the Crucial T710 or T705 are faster.
If you’re writing anything less than 500GB, the difference will be negligible. The 9100 wrote the first TB, or more, at 4+ GB/s, which is as fast as I can generate the random data I use to populate the drive.
I balked at the price until I checked nand flash spot prices (of course Samsung uses in-house nand but it’s still a way to do some napkin math). These 8tb drives are just going to be expensive until nand wafer prices come down.
Thanks for the review. Since this is a double-sided drive, I’m particularly interested in the thermal aspects. What sort of case & cooling setup did you use? Did the CPU cooler provide any direct airflow onto the SSD?
Also, do you have any idea whether the monitoring software was reporting NAND or controller temperature? I’d guess it’s the NAND temperature, since that’s the more heat-sensitive of the two (but usually also cooler).
In the future, I would appreciate seeing a dedicated thermal test, as many other sites usually do.
> So if I want sustained writes I should go enterprise or the T705.
@Culbrelai , it depends on what you’re trying to do. For something like a sustained database workload, skip right past consumer SSDs and get a server SSD for mixed or write-intensive workloads. Those are optimized to reduce tail latencies in a way that you generally don’t see among any consumer SSDs.
Another thing about consumer SSDs is that the size of the SLC buffer is proportional to the amount of free space. In the 4 GB 9100 Pro, it looks to be a quarter of the free space, which check out if you consider that it’s TLC (i.e. 3 bits per cell) and thus 4x as dense as SLC. This means you can fill an empty drive to 25% at full speed, but if you’re starting with a half-full drive, then you can only add another 1 GB (if we’re talking about the 8 GB model), before it throttles back to the steady-state write performance.
> The 9100 wrote the first TB, or more, at 4+ GB/s, which is as fast as I can generate the random data I use to populate the drive.
@Will Taillac , I highly doubt the drive does any sort of block-level de-duplication. That’s the only reason I can see why you’d need to use non-repeating random data. I’d just replay the same block of pre-generated random data. Maybe you could try doubling the size of your write buffer and adding a random offset, but I’d be shocked if it made any difference.
It’s storage, It stores data. If you’re going to review something like this at least do it properly.
“Across the 9100 PRO line all drives are equipped with a LPDDR4X DRAM cache at 1GB per 1TB of drive capacity.” should be: “Across the 9100 PRO line all drives are equipped with an LPDDR4X DRAM cache at 1GB per 1TB of drive capacity.”
@Cyclographer
In the past – think Sandforce era drives – some SSDs have used inline compression to improve performance. I’m honestly not sure if any drives out there nowadays still do that kind of thing, but I use random data just to be sure. Actually, I use 10 separate threads generating random data simultaneously, causing the data to get interwoven as it’s written.
My ability to generate data hasn’t been a huge limitation for the most part, and eventually my test bench will probably get upgraded and be able to push more data.
As for thermal testing, generally speaking drives report their controller temperatures. I do have a FLIR camera which I pull out and use to ensure the self-reported drive temperature is fairly accurate; I’ve caught drives in the past where the reported temperature was wildly different than reality. That’s never been a problem with a Samsung drive thus far, though. I let the drive get up to temperature during the initial random data drive write, operating on an open-frame test bench without a heatsink. If a drive stays cool, let’s say under 60C, then I might just leave it that way for all testing. Once a drive makes it to 70-80C though, I try to observe throttling behavior if I can just for my own knowledge, and then apply my MSI motherboard’s built-in heatsink. I also have a fan I can direct at the drive/heatsink if needed. In the 9100 PRO’s case, the drive only barely made it to 70C, so I marked the temperature and then applied my heatsink for the rest of testing. With the heatsink I don’t think I broke 50C for the rest of testing.
> As for thermal testing, generally speaking drives report their controller temperatures.
On Linux, the 990 Pro reports three temperatures: Composite and two “Sensor” temperatures (1 and 2), which appear to be the NAND and controller, respectively. It seems clear to me that the Composite temperature reflects Sensor 1, which I believe is the NAND temperature.
With NAND being far more temperature-sensitive, I would expect drives to give you the NAND temperature, if you get only one. However, I can’t argue with any results you’ve gathered by either FLIR or external temperature probe.
> I’ve caught drives in the past where the reported temperature was wildly different than reality.
So, the reported value matched neither the NAND nor the controller? Was it somewhere in between the two? Was the drive in a steady-state, at the time, to rule out the effect of any temporal smoothing?
> In the 9100 PRO’s case, the drive only barely made it to 70C
That is pretty hot, for a NAND temperature. A lot of drives will start to throttle around there. Controllers usually have a higher throttling point (my 990 Pro reports a throttling temperature of 85 C, for the controller).
Thanks for the reply!