SPECworkstation 3.0.2 Storage Benchmark
SPECworkstation benchmark is an excellent benchmark to test systems using workstation-type workloads. In this test, we only ran the Storage component, which is fifteen separate tests.
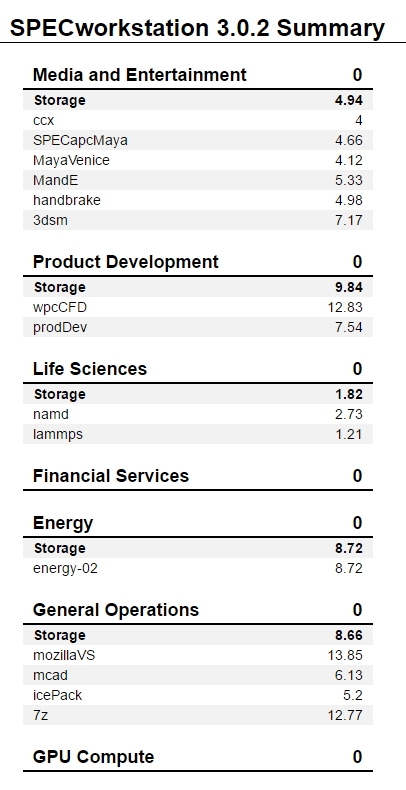
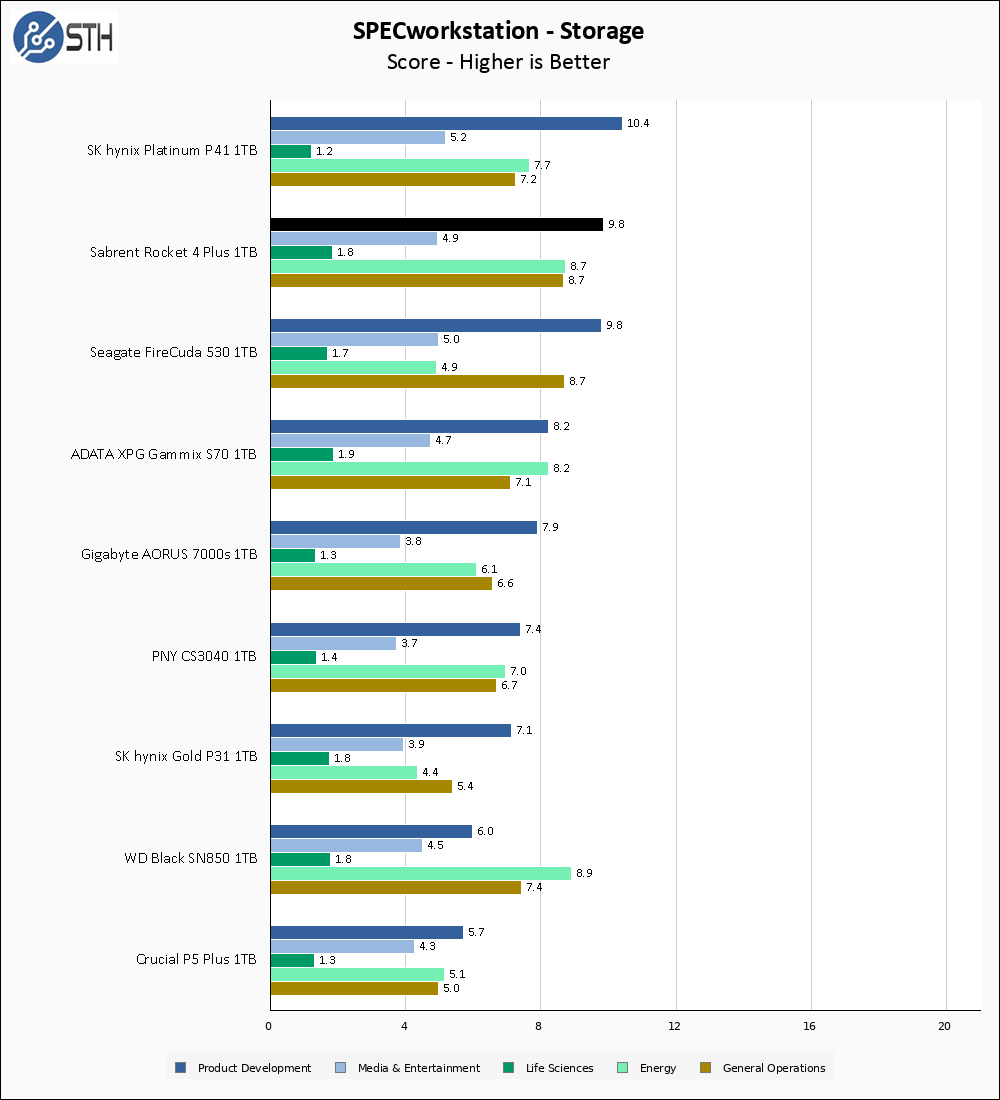
SPECworkstation is interesting in terms of the comparison to the FireCuda 530; the Sabrent Rocket 4 Plus turns in near-identical results in all the tests except Energy where the Rocket takes a commanding lead. Overall the SPECworkstation performance here is great and the Rocket 4 Plus wins more benchmarks than it loses in comparison to the SK hynix Platinum P41.
Sustained Write Performance
This is not necessarily a benchmark, so much as trying to catch the post-cache write speed of the drive. While I am filling the drive with data to the 85% mark with 10 simultaneous write threads, I monitor the drive for the write performance to dip to the lowest steady point and grab a screenshot.
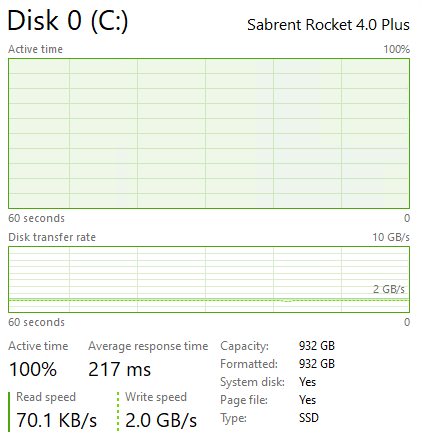
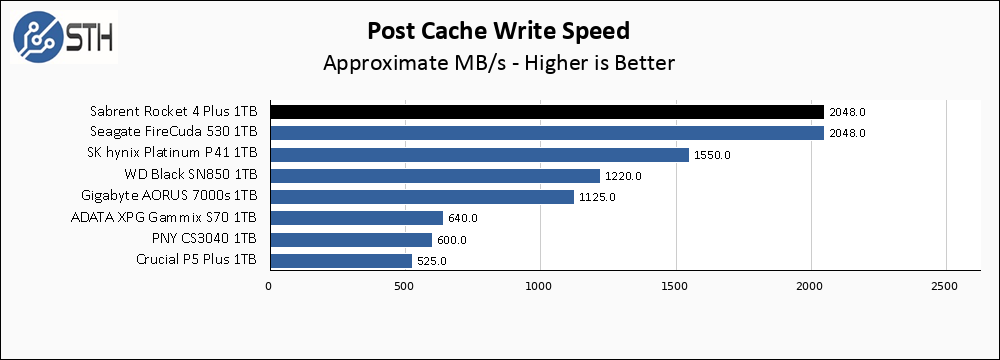
I crowned the FireCuda 530 the sustained-write king, but it looks like that throne will need to be shared. The Post-cache write speed on the Sabrent Rocket 4 Plus is amazing, and stands head and shoulders above almost everything else.
Temperatures
We monitored the idle and maximum temperature during testing with HWMonitor to get some idea of the thermal performance and requirements of the drive. Please keep in mind that our test bench is an open frame chassis in a 22C room, but with no direct airflow. As a result, this is not representative of a cramped low airflow case and is instead intended to model temperatures of a drive ‘on its own’.
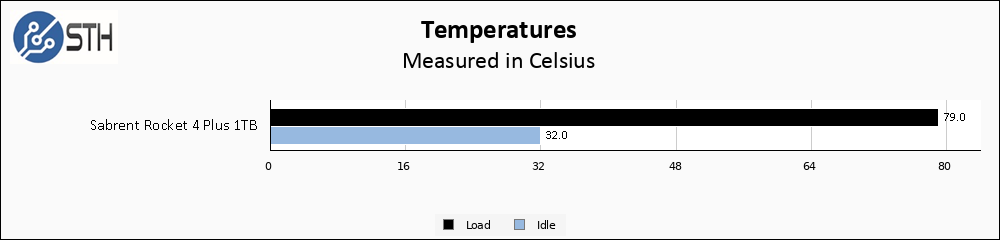
The thin heatspreader on the Sabrent drive holds the temperature to 79C, which is too warm for my liking but not quite as catastrophic as drives that make it halfway through the 80s. Just as important, I did not observe throttling. Sabrent does offer an after-market heatsink if needed, though under lighter loads the Rocket 4 Plus likely will not require additional cooling unless your case is especially warm or cramped.
Final Words
Today the Sabrent Rocket 4 Plus 1TB is $150 online. That price point is right in line with other top-end drives like the WD Black SN850, and is actually $10 less expensive than the current price for the Seagate FireCuda 530 without its heatsink. Given the performance achieved today, that pricing is perfectly in line with my expectations.
Up until now, I would have placed the FireCuda 530 as my favorite PCIe 4.0 drive, but Sabrent has decided to give Seagate some competition; the Rocket 4 Plus turns in performance that is overall slightly better than the FireCuda at a slightly lower price. Combined with the stellar sustained write performance and exemplary write endurance, the Rocket 4 Plus is a winner.


@servethehome
Your post cache write shows around 2GB/s
When Guru3D tested this same drive they get around 500 MB/s
Any comments on this large discrepancy please?
No idea how they test them Rodigas, but Will saw the same with the FireCuda and we had other folks verify at that time. This uses the same controller and ends up with virtually the same performance. I cannot comment on why other sites get different results.
Rodigas, STH definitely uses different testing methodology here than Guru3D. I use 10 separate running instances of an external utility to generate and write random data comprising 85% the capacity of the drive – so about 850GB in the case of a 1TB drive. This is done at the beginning of benchmarking when the drive is blank except for the copy of Windows and various benchmarks that are installed. I then monitor both drive temperature and write speed near the end of that process to see what it settled at. If the drive begins throttle during the test, or just starts to get uncomfortably warm, I reset the drive and perform the test again with a heatsink and airflow.
With that said, it is hard to truly understand what is happening over on Guru3D because parts of their review are self contradictory. As an example, they list the test environment and equipment as using a Ryzen 9 5950X-based platform, but their Anvil results are obviously taken with an Intel i9-12900K system. They also do not test with their drive set as the boot drive and many of their benchmarks are done with the drive essentially empty. And I have no clue when during their testing they perform this test; if they do the full-disk write at the end of their testing, they might be running into other issues if their drive has not TRIM’d. Their hardware is different, OS is different, and testing is different, so I am not surprised we are running into differences.
Nice review. Slightly surprised that the Samsung 980 Pro series isn’t on the benchmark list for gen4 drives.
Michael – That is, like this one, due to us having tested a different capacity 980 Pro. Will actually has the 1TB 980 Pro already done and that will be the next in his series likely next weekend.
Guru3d 17 or 18 pages for a m2 SSD? WTAF. That’s abusing readers
I think STH should be 2, but i get the breakdown of 3.
Not sure why we’re surprised that 3 year old technology that was top of it’s game is still top of it’s game with minor incremental improvements.
As a relatively new reader I am wondering why all the focus is on sequential read and write results? My understanding is that random read and access time is crucial to how fast a drive will perform and feel in daily use, so it would be nice to see those numbers compared in a graph. The instances where you’d be writing to the drive at 7+GBps in every day use would be small, while you will always be doing random reads and writes for booting, opening apps, saving documents, etc.
Comments are closed.