Sabrent Rocket 4 Plus 1TB Performance Testing
We test using both the default smaller test size as well as larger test sets on our benchmarks. This allows us to see the difference between lighter and heavier workloads.
CrystalDiskMark x64
CrystalDiskMark is used as a basic starting point for benchmarks as it is something commonly run by end-users as a sanity check.
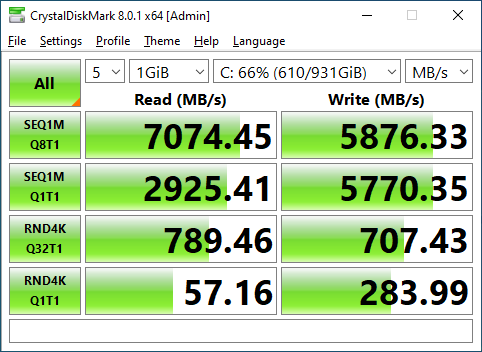
The Rocket 4 Plus didn’t quite manage to hit its rated sequential read and speeds, but it was not far off. Writes are nearly a tie with the similar FireCuda 530, with read speed trailing by just a bit.
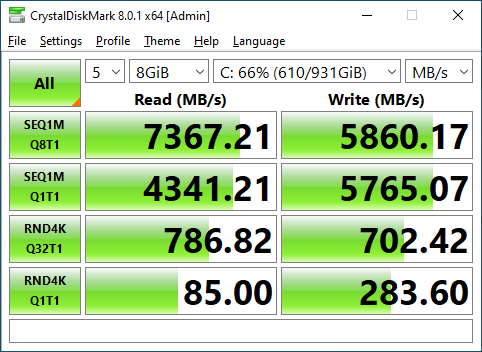
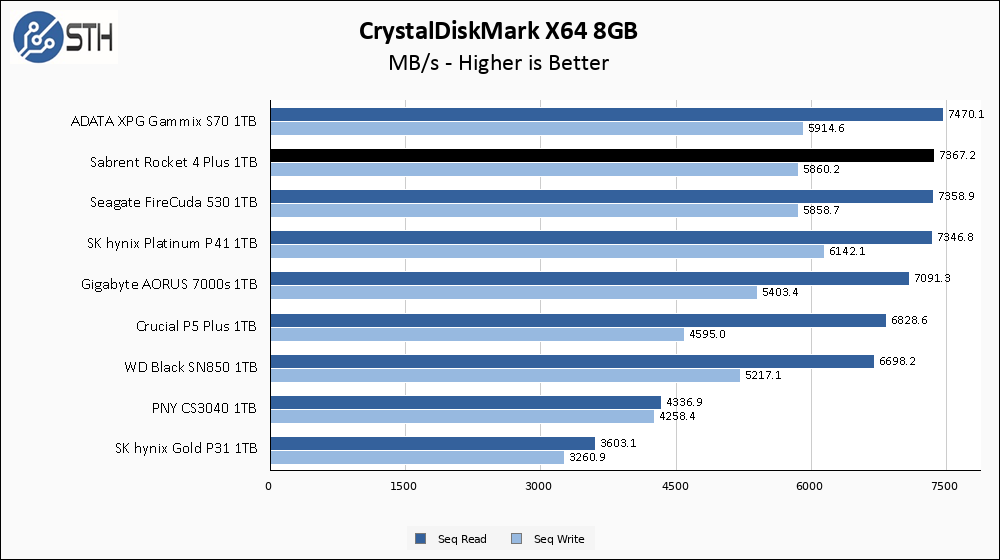
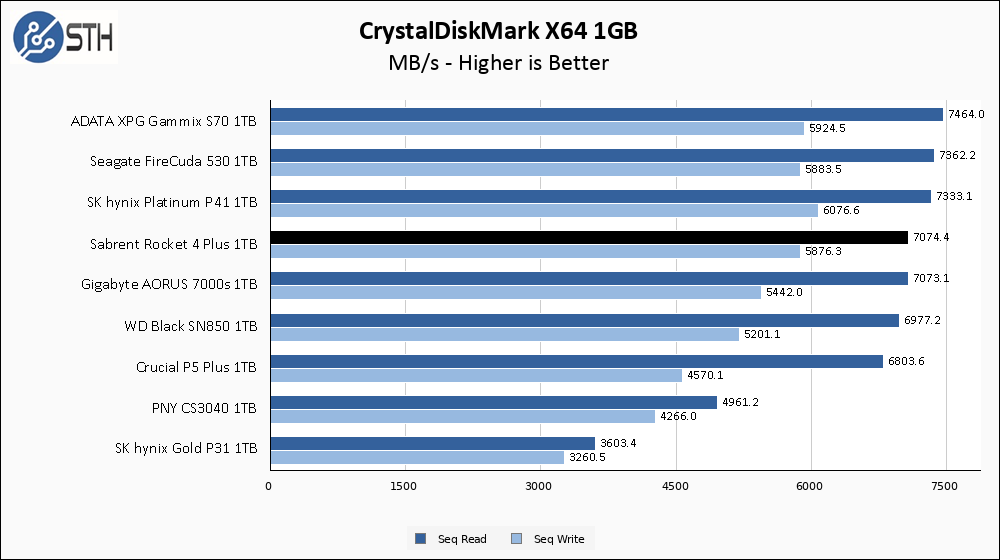
Moving to the larger CrystalDiskMark benchmark helps out a lot; the read speeds improve to the point that they essentially match the ratings. As a result, the Rocket 4 Plus is now in a functional tie with the FireCuda 530. Spoiler alert, that is not the only time that will happen in this review!
ATTO Disk Benchmark
The ATTO Disk Benchmark has been a staple of drive sequential performance testing for years. ATTO was tested at both 256MB and 8GB file sizes.

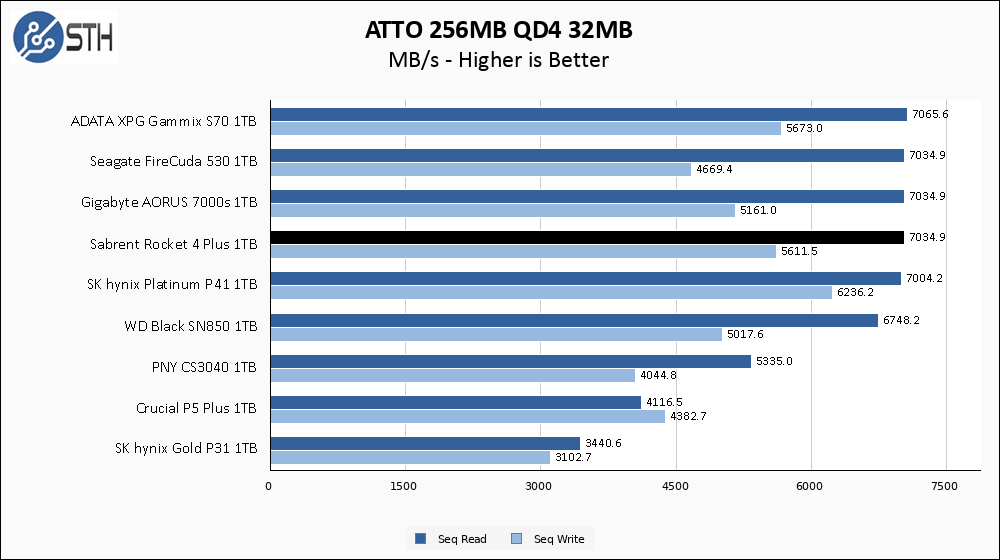
In ATTO read speed manages to match the CrystalDiskMark numbers, while write speeds take a small hit. With that said, the hit to write speed is not nearly as severe as the FireCuda, allowing the Rocket 4 Plus to beat it. Despite appearing in the 4th place slot on our chart, the Rocket 4 Plus is essentially tied for the best result on this chart.
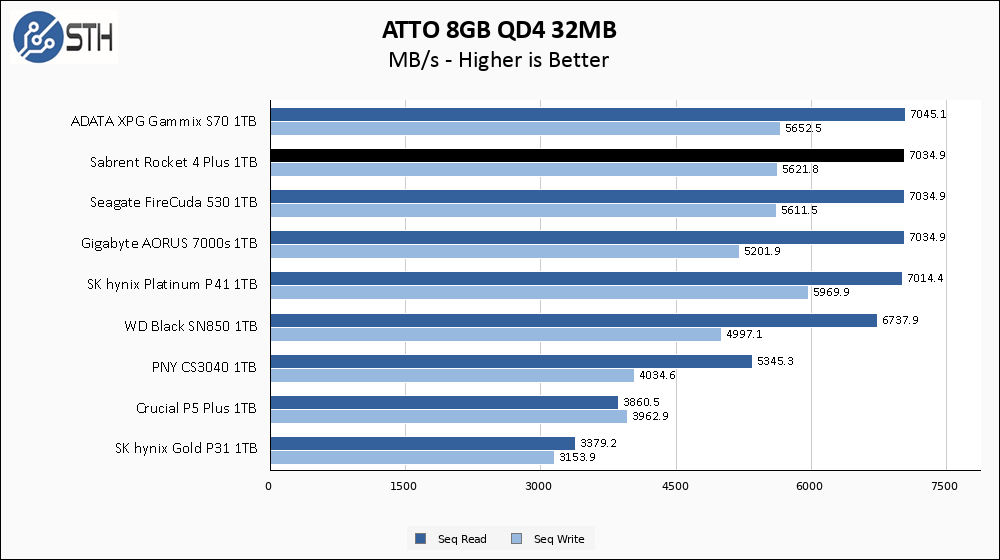
That is better; the chart placement of the Rocket 4 Plus now accurately reflects its performance. There is essentially a 3-way tie for the top spot on this chart, and the Rocket 4 Plus is among them.
Anvil’s Storage Utilities
Anvil’s Storage Utilities is a comprehensive benchmark that gives us a very in-depth look at the performance of drives tested. This benchmark was run with both a 1GB and 8GB test size.
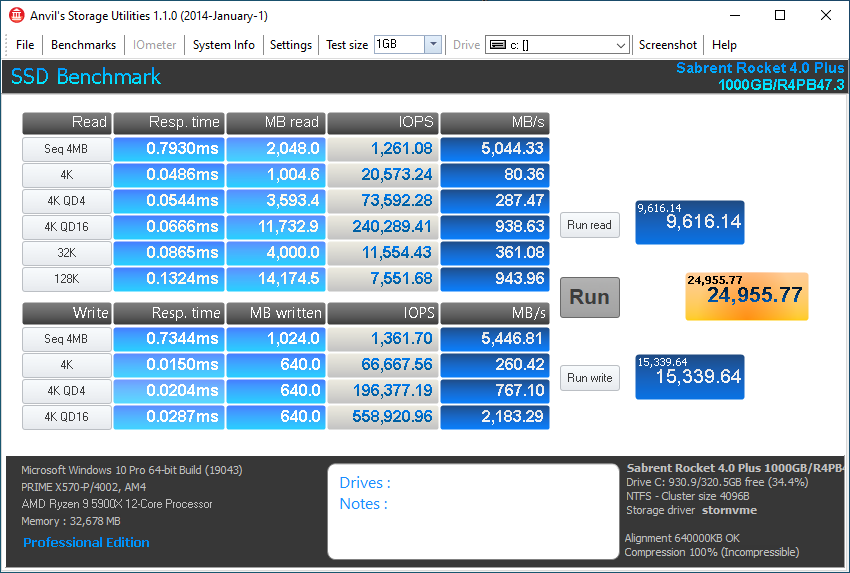
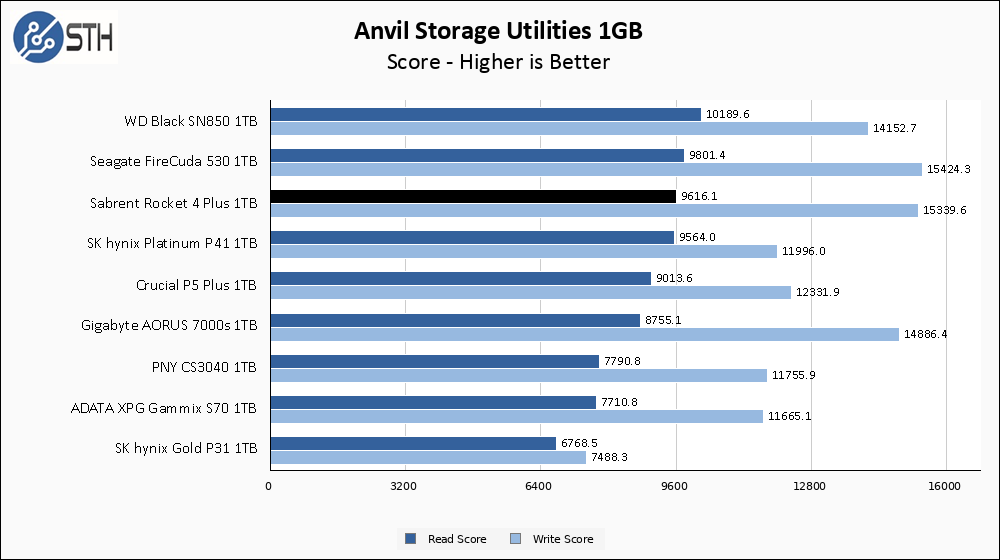
In Anvil, performance for the Sabrent Rocket 4 Plus is great and is once again a near-tie with the FireCuda 530. Both Phison-powered drives lose out to the WD SN850 very slightly in read score, but dominate the write score side.

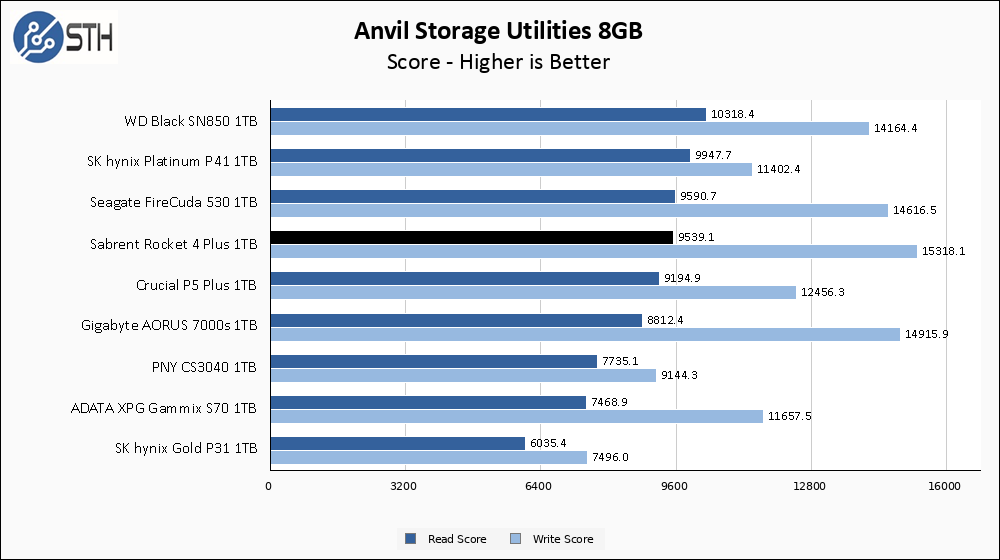
In the larger Anvil test the Rocket 4 Plus is chart-topping for write score, beating the FireCuda 530 by a moderate margin. Read score is also good, though not quite able to beat out the SN850 and P41.
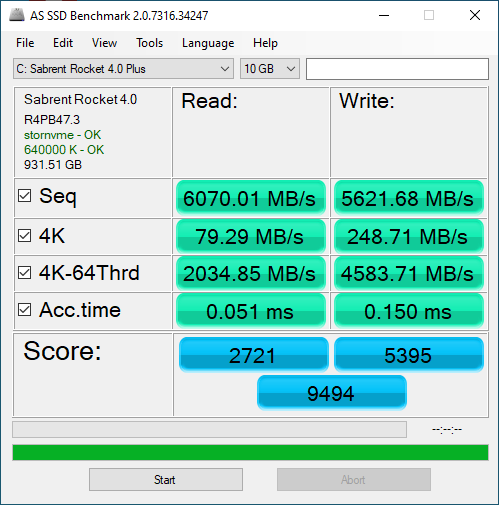
AS SSD Benchmark
AS SSD Benchmark is another good benchmark for testing SSDs. We run all three tests for our series. Like other utilities, it was run with both the default 1GB as well as a larger 10GB test set.
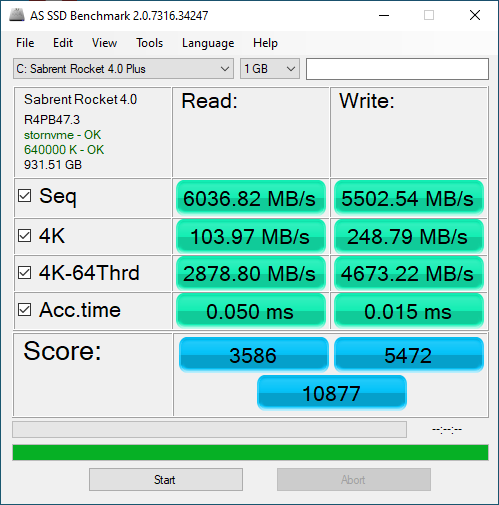
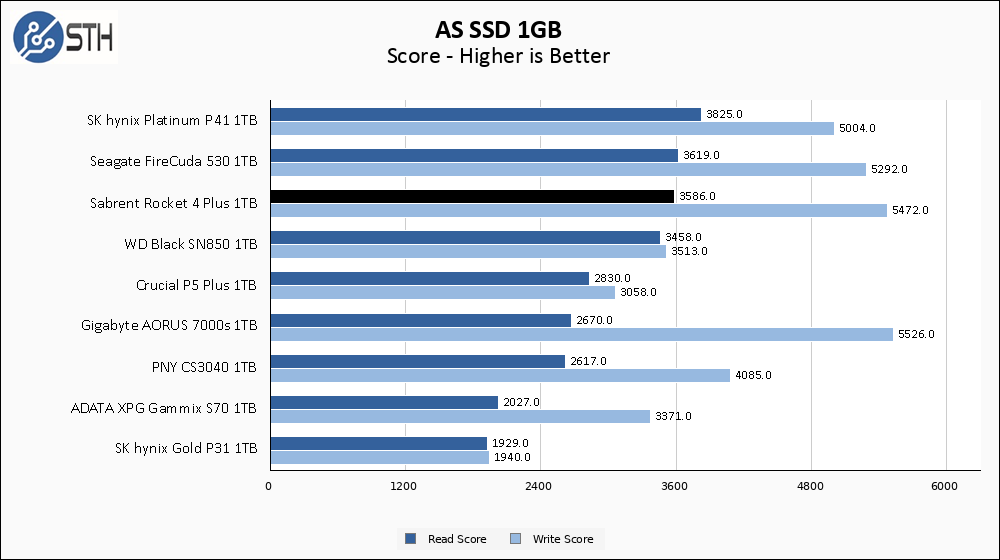
The Sabrent Rocket 4 Plus puts in another good showing in AS SSD, slightly beating out the FireCuda 530 in write score.
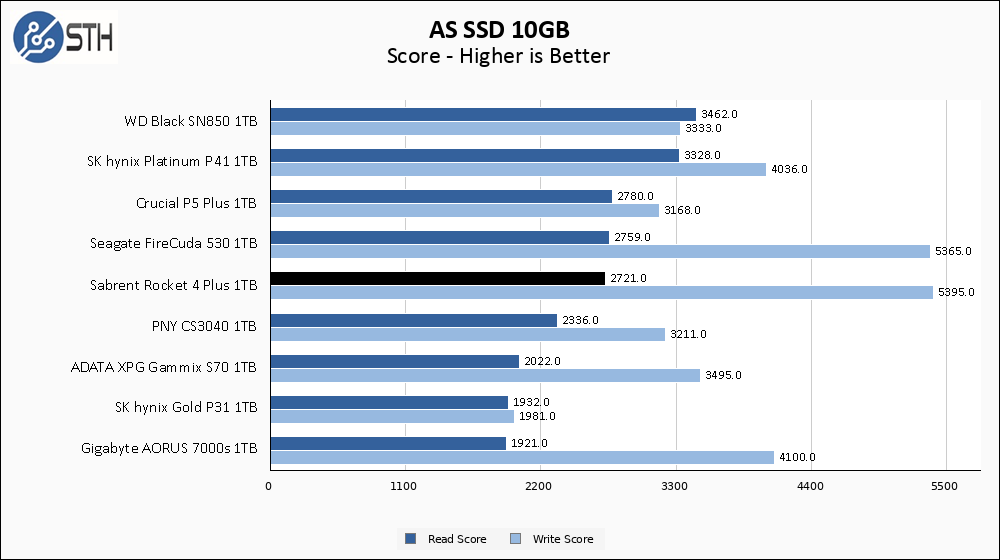
Performance in the larger AS SSD test once again mirrors the FireCuda 530, with the Rocket 4 Plus slightly behind in read score and slightly ahead in write. Write score is easily top of the chart, though read score comes in behind several other models.
SPECworkstation, thermals, and our conclusion are up next.


@servethehome
Your post cache write shows around 2GB/s
When Guru3D tested this same drive they get around 500 MB/s
Any comments on this large discrepancy please?
No idea how they test them Rodigas, but Will saw the same with the FireCuda and we had other folks verify at that time. This uses the same controller and ends up with virtually the same performance. I cannot comment on why other sites get different results.
Rodigas, STH definitely uses different testing methodology here than Guru3D. I use 10 separate running instances of an external utility to generate and write random data comprising 85% the capacity of the drive – so about 850GB in the case of a 1TB drive. This is done at the beginning of benchmarking when the drive is blank except for the copy of Windows and various benchmarks that are installed. I then monitor both drive temperature and write speed near the end of that process to see what it settled at. If the drive begins throttle during the test, or just starts to get uncomfortably warm, I reset the drive and perform the test again with a heatsink and airflow.
With that said, it is hard to truly understand what is happening over on Guru3D because parts of their review are self contradictory. As an example, they list the test environment and equipment as using a Ryzen 9 5950X-based platform, but their Anvil results are obviously taken with an Intel i9-12900K system. They also do not test with their drive set as the boot drive and many of their benchmarks are done with the drive essentially empty. And I have no clue when during their testing they perform this test; if they do the full-disk write at the end of their testing, they might be running into other issues if their drive has not TRIM’d. Their hardware is different, OS is different, and testing is different, so I am not surprised we are running into differences.
Nice review. Slightly surprised that the Samsung 980 Pro series isn’t on the benchmark list for gen4 drives.
Michael – That is, like this one, due to us having tested a different capacity 980 Pro. Will actually has the 1TB 980 Pro already done and that will be the next in his series likely next weekend.
Guru3d 17 or 18 pages for a m2 SSD? WTAF. That’s abusing readers
I think STH should be 2, but i get the breakdown of 3.
Not sure why we’re surprised that 3 year old technology that was top of it’s game is still top of it’s game with minor incremental improvements.
As a relatively new reader I am wondering why all the focus is on sequential read and write results? My understanding is that random read and access time is crucial to how fast a drive will perform and feel in daily use, so it would be nice to see those numbers compared in a graph. The instances where you’d be writing to the drive at 7+GBps in every day use would be small, while you will always be doing random reads and writes for booting, opening apps, saving documents, etc.
Comments are closed.