
We spend a lot of time, effort and money on the STH web hosting platform. Recently we saw one of the biggest performance increases ever moving to NVMe SSDs. There are a lot of benchmarks that say NVMe is fast, but we have some data on real-world impacts of NMVe storage performance using something a little different: actual site performance. This is a bit different because most WordPress performance testing utilizes a clean base install. The STH WordPress installation has over six years of content spanning many gigabytes. It has run on no less than 5 different hosting platforms, used 4 different Linux OSes, changed from Apache to Nginx, used nine different themes and etc. over its lifetime. The 6.5 year old WordPress installation and a brand new WordPress installation are two completely different test cases. Our testing today is limited to the STH WordPress instance which is going to be unique as it is probably one of the top 1% of the estimated 76 million+ WordPress sites in terms of traffic and overall size.
The Backstory
We recently moved our primary hosting for STH and the STH forums to our Fremont rack. For the past few years we have been hosting using a primary site in Las Vegas but we ended up moving to the new site and using Las Vegas as a back-up. We have used Proxmox for some time and are currently using the Debian Linux based Proxmox VE 4.0 and now 4.1. The setup has a nice Web GUI for managing KVM and LXC containers. In terms of storage Proxmox has the ability to utilize ZFS mirrored root pools (ZFS on Linux) as well as using ZFS for VM storage. We also are using Ceph in the cluster but not for hosting the primary VMs. Being slightly risk-adverse we have been using ZFS mirrors for some time.
With the new Fremont cluster we have, among other machines, three NVMe Intel 2U nodes each with dual Intel Xeon E5 V3 processors, several SAS/ SATA SSDs and four 2.5″ NVMe SSDs per machine. When we did the move, we wanted to utilize NVMe storage but were completely ready to sell the NVMe drives and ready for the next generation if there was little to no improvement. In fact, for budgeting, this is what we were planning to do. The nodes in the Fremont cluster showed us excellent performance so we ended up keeping the NVMe drives.
The Configurations
We were able to clone the instance across multiple machines, then run tests on the hardware available. We used a bit of a mix of hardware just to get an idea regarding performance across the machines we had installed. We did run these tests on some of the actual hosting machines that can be running VMs for this site on any given day but utilized our testing networks on the machines that were rotated out for these tests.
Software
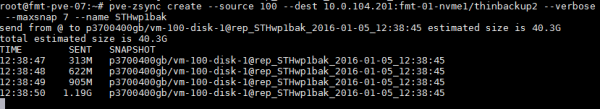
Both setups utilize Proxmox VE 4.1 which is based on Debian Jessie. For this test we have the web front end (nginx), database (MariaDB), files and Varnish all running in a KVM virtual machine using virtio network and disk. We use two dedicated SSDs for each mirrored ZFS zpool and then are using zfs snapshots to send/ receive identical volumes between sites. We recently did a quick how-to article on using pve-zsync to schedule regular checkpoints on your server which can make a similar recurring process very simple.
To run the tests (and save some headache) we modified our local hosts file to point to the server being tested remotely but this process is extremely fast and let us repeat tests quickly to ensure we were getting accurate results. We did also change or standard stack slightly in that we were using DHCP for our IP configuration just to make the testing process faster and made the VMs self-contained so they were not relying upon external file shares or database servers.
Networking
There is 1GbE networking to the firewalls both running NAT. The Las Vegas firewall has twice the number of cores and RAM and is also using <1Mbps of its 100Mbps bandwidth. Fremont uses around 8Mbps of 100Mbps consistently outside of the STH WP. The internal LAN is virtually identical and when we do throughput tests over VPN to the two sites we average a 23ms ping to Las Vegas and a 19ms ping to Fremont from the Silicon Valley US and have one additional hop to our Las Vegas colo. Realistically, the Las Vegas has more capacity and lower load, the Fremont colo has closer proximity but a higher load and less cores to run NAT.
We ran a bandwidth test using compressed packages to ensure there is not a major networking difference in terms of download speeds. We downloaded the latest WordPress 4.4 release and a collection of images from a few reviews in a 500MB tar.gz file onto all machines using wget:
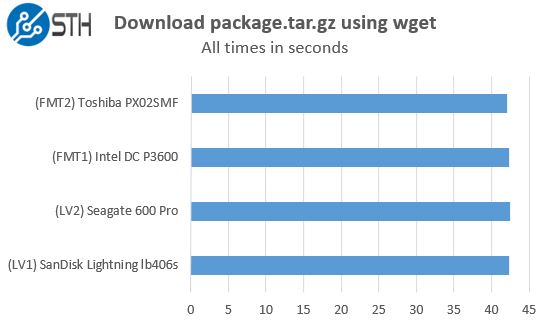
The bottom line – networking differences should not be causing the deviations we are seeing. These variations were a few tenths of a second whereas we are seeing significantly more delta with the disk configuration. We also repeated tests five times on different days and used two machines per site just to ensure we could spot WAN-related performance outliers if they occurred.
Test Machines
We did not utilize any Atom C2000, Xeon E3-1200 nor Broadwell-DE nodes we have setup for this test just to keep things simple. There are some architectural differences between each machine, but the V1 and V2 processors have higher clocks to the point we expect single-threaded performance to be higher, and certainly on a box with the same number of dedicated cores. Since these machines are all unique, here is a summary table of what we tested:
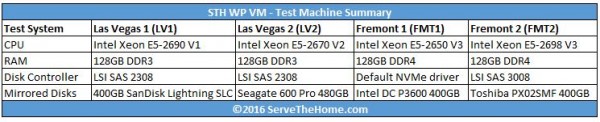
For all test data collected in this piece, these machines were not running any other applications. Each KVM VM was exactly the same, simply copied from location to location and given a different VM name so that we could track them.
The SanDisk Lightning lb406s drives we previously were using were extremely popular in storage arrays from companies like HP, Dell and NetApp to name a few. The SAS2 SLC drives had more write endurance than we would ever need and hosted the primary VM for over a year. We also had two SATA III Seagate 600 Pro drives which utilize the LAMD controller setup from an older machine. Finally in Fremont we pulled two Toshiba PX02SMF SAS3 SSDs with 10 DWPD write speed ratings just as a comparison point. Our NVMe drive was the Intel DC P3600 400GB

NVMe Accelerates Real-World WordPress Performance
What prompted this was a “whoa” moment after the first migration over to the NVMe storage. As we were writing and uploading files for the first article, we noticed a perceptible speed increase. The WordPress Admin panel is where we spend (too much) time. There are two major differences between the Admin and the Public facing side of WordPress: external dependencies and caching. While a standard WordPress Public site call may generate many external calls (e.g. Google Analytics), the Admin side is primarily driven by local domain resources. Likewise, for sites like STH, an article is published then the main updates come in the form of comments. Varnish is a very effective tool to cache relatively static WordPress sites. With the Admin panel, we are authoring content and saving it to the server and database. That is a lot more write heavy than standard WordPress Public side requests.
Upgrade WordPress
Above we showed that the latest WordPress file downloaded in about the same time (0.6s) on each server we tested. We then tried something a bit more challenging: upgrading WordPress on each instance from 4.3.1 to 4.4. This operation is very easy in WordPress so we simply clicked the button and timed until we got a confirmation.
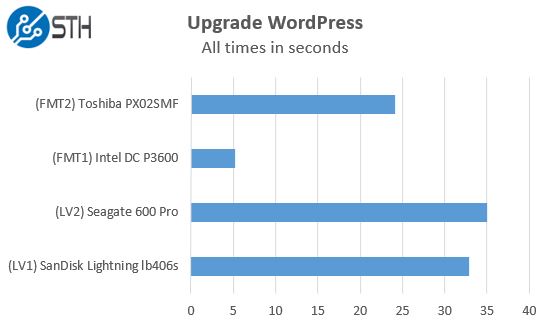
These results speak for themselves. Assuming relatively similar download speeds (as tested earlier) then the decompress and write to disk operations are much faster in the new version.
Sanity Check: Upgrade XenForo
We also have forums that use XenForo software. We upgraded to 1.5.4 and simply timed the upgrade process. This was just as a sanity check for our WordPress results and was the only time we used our XenForo instance in testing.
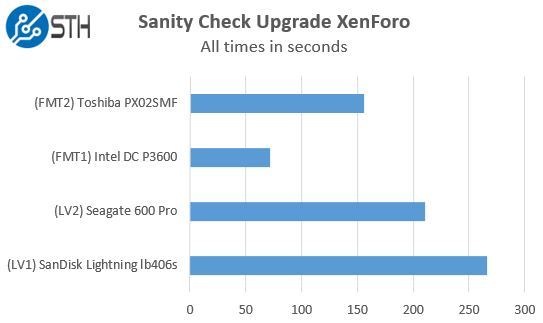
We saw a less dramatic upgrade speed, however it was certainly easy to notice. XenForo upgrades are actually a bit more disruptive to our normal traffic due to the fact the forums get shut down. Making this process faster especially on larger upgrades and highly active message boards.
Upload 100 Images to WordPress
We do a bit of server side processing for images so for this test we used Chrome and uploaded 100 larger than average images to our WordPress instance. As we showed earlier, the simple compressed file transfer speeds were very similar between servers. What happens when we upload images to the CMS and time how long until they are ready?
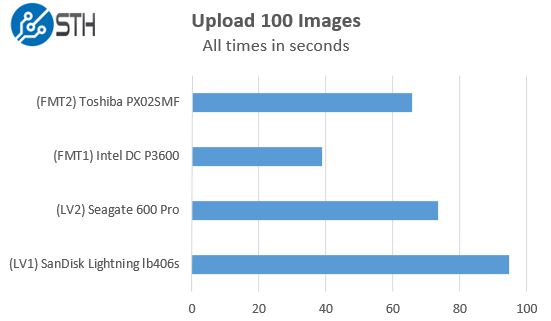
This is one of the more CPU intensive tasks since it does involve uploading and then saving multiple copies of resized images. Still, we saw clear gains that were easily perceptible in our daily authoring workflow.
Save a WordPress Article
While we were hit by the very nasty WordPress 4.3 bug that was doing 100MB MySQL queries on every page load, the time to save a WordPress article was very high. Still, if you use shared hosting and a fairly decent sized blog the WordPress back-end can be slower than you want it to be. We did a quick test of saving a larger sized WordPress article to each of the instances.

While these events happen relatively infrequently compared to page views, saving a few seconds is certainly noticeable and appreciated.
Requests while ZFS send tasks are running on the underlying disks
ZFS send is awesome. It allows us to replicate volumes across hosts easily. It also allows for incremental snapshot data to be sent lowering transfers. For this test we took a dated snapshot and copied it to our four test servers using separate 10GbE local networks. We removed external dependencies like Google Analytics, Adsense and etc to improve consistency and focus on each configuration’s performance not external services. We re-started the VMs so each booted off of the same volume and had the same cache state (since none were publicly facing.) We then generated traffic on each site (10,000 concurrent users) as we initiated the snapshot send to RAM disks so that we could ensure saturated network links and therefore consistency there. Our daily snapshots of the STH WP and forums are generally only on the order of a few hundred megabytes in size. Transferring a few GB over the network does take a few seconds and what happens to performance during these times is often overlooked. We recently published a piece about how we saw significant gains using Hyper-V replication over Mellanox 40GbE. This is looking at the disk side of the equation because networking is 10 Gigabit on both storage back-ends.
As we can see, in terms of total number of requests per second, each solution looks the same. The STH main site does generate over 100 requests (STH and External) so even looking at 99th percentile is not good enough. We need to look at a much more granular level of data and so we picked the 99.9th percentile response times.
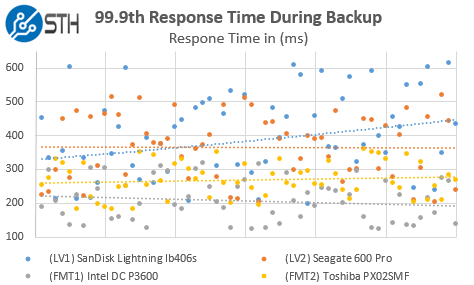
This is a fairly busy scatter graph. We did add linear average lines just to give one a general sense of performance. Here we can see that the NVMe drives actually lower some of our 99.9th percentile response times dramatically. A good rule of thumb here is that NVMe cut these response times by about half over our older SLC SAS drives.
Conclusion
For most WordPress websites, a huge portion of the workload is simply reading relatively static data that can be cached in-memory, but there are still some areas where disk write throughput and latency can help. We took a look at some specific write-intensive use cases using WordPress and found real-world differences between SAS/ SATA storage and NVMe storage. Is this enough to have you go spend $2000 on new NVMe drives? Probably not. Is there likely some software tuning that can accomplish the same thing? Highly likely. On the other hand, with the price of the Intel 750 SSDs running well below $1/GB, getting this type of performance on read intensive applications like WordPress is going to become the expectation as we move later into 2016. It also means that getting “SSD” backed storage can have extremely varied performance as we saw the SAS2 SLC drive, the SATA MLC drive, SAS3 MLC and NVMe eMLC drives all have noticeably different performance profiles.


I posted this in the forums but this is the best NMVe performance showcase I have seen so far. WordPress in a VM with a MySQL database has to be one of the most popular web applications out there. I showed my boss this today and he thought the same.
Do more of this kind of testing please!!!!
Another NVMe case on ZFS is to use it for dedicated ZIL device (few GB) and L2ARC (all left space), so you get the cache benefit on reads and writes, while maintaining second tier of storage on cheaper media. The write latency of NVMe is in the region of some 20 microseconds, which when used as ZIL is really nice.
You are totally right. Using NVMe as the base mirrored pool just makes things a bit easier since we have the capacity for it.
Comments are closed.