
In the STH / DemoEval lab we are still primarily using QSFP+, SFP+ and 10Gbase-T as our primary networking interfaces. While 25/ 50/ 100GBE are on the near horizon for us, we wanted to take a quick look at the differences in terms of power consumption between the three different Ethernet interface standards for 40Gbe and 10GbE. If you are not accustomed to the three networking standards, you may be shocked by the results. At STH we are advocating using at minimum 10GbE in 2017 on all servers as prices come down and the utility of higher-speed networking continues to increase.
Test Setup
To test the different interfaces we used three different switches and a total of twelve NICs. We wanted to come up with three figures: absolute power per NIC and power per 1Gbps. Our test system was an ASUS 2U RS520 system that provides very consistent power consumption (155w) due to how the midplane fans are controlled. This allowed us to have a consistent baseline for all of the NICs. It took a bit of work to get to this point we also had to run the system with a single PSU to keep power readings constant. For our testing we are utilizing Intel network cards. Here are the cards we utilized for our tests:
- Intel XL710-QDA2 (dual QSFP+ 40GbE)
- Intel X550-T2 (dual 10Gbase-T)
- Intel X520-DA2 (dual SFP+ 10GbE)
- Intel X710-DA2 (dual SFP+ 10GbE)
- Intel X710-DA4 (quad SFP+ 10GbE)
Casual observers may notice that we do not have the X540 cards in the list. The reason for this is that they have been largely supplanted in recent machines by the Intel X550 series NICs.
We wanted to utilize Mellanox and Chelsio adapters but Mellanox did not have a 10Gbase-T card and we did not have T5 generation 10Gbase-T and SFP+ cards. A few years ago we posted a picture of Fortville cards versus Mellanox ConenctX-3 and X520 cards just to show the generational differences.
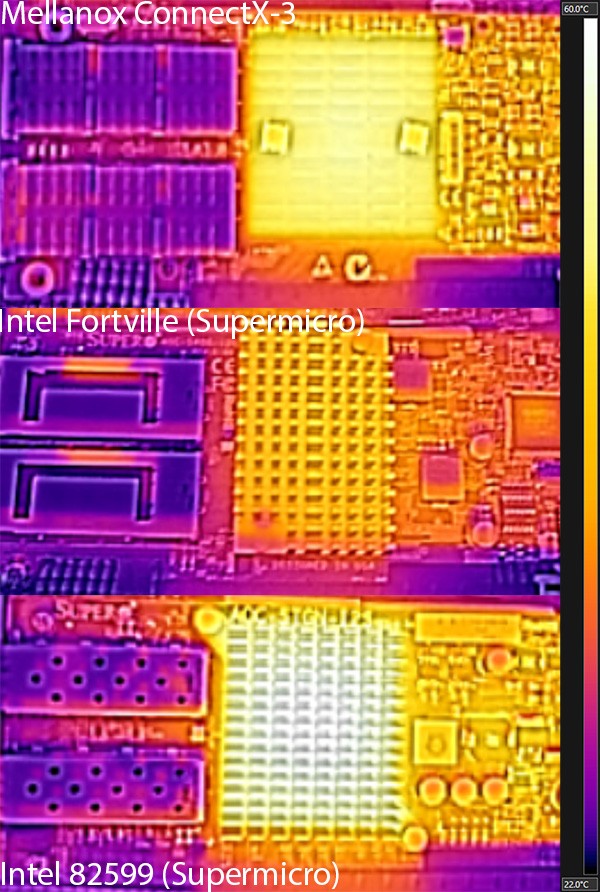
As you can see, newer silicon does help thermals and power consumption. We are using 3M DACs and 3M Cat 6A network patch cables for our tests. Overall, we have done everything we could to ensure that the power consumption was going to be constant between the platforms.
The Test: QSFP+ v. SFP+ v. 10Gbase-T
We took the cards and ran iperf3 to put them under load for three hours before taking measurements. We also were able to monitor power for consistent loads and ensure there was no fluctuation. Finally, to ensure we had consistent results we monitor the data center and all tests were done at 19.4C and 53% relative humidity. Given how low the power consumption was for several of the NICs, we needed to keep the environment constant and monitor midplane fans so that we did not see external factors impact our results.
Our first test is a simple test to show the relative performance of each network card in terms of aggregate network throughput and power consumption above our 155w static load.
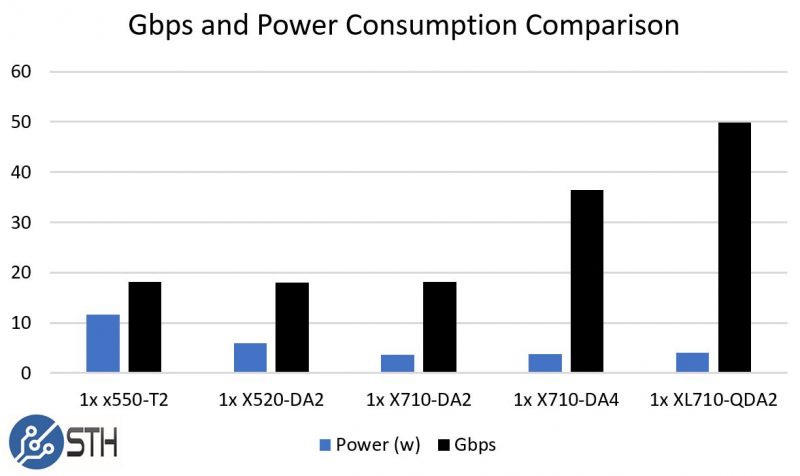
One may notice that the XL710-QDA2 is not reaching anywhere near 80Gbps. Our card is a PCIe 3.0 x8 card which is not capable of supporting dual 40GbE links at full speed. Commonly these dual ported cards are used to provide redundancy rather than maximum throughput.
Our second chart shows the resulting efficiency of each network interface card.
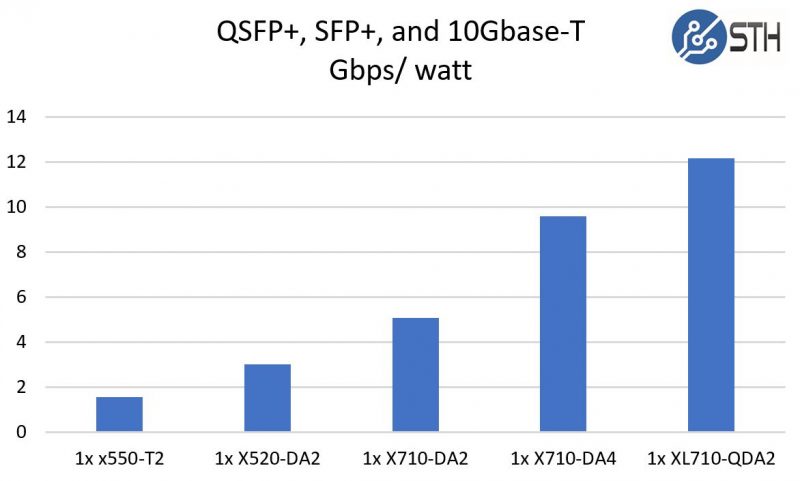
Here you can see the 40GbE Intel XL710-QDA2 perform significantly better than other options and several multiples better than 10Gbase-T NICs. Although the absolute differences were small, the generational change to the Fortville based 10GbE / 40GbE generation is immediately noticeable.
Final Words
RJ-45 jacks adorn walls and CAT 5e wiring has been strung throughout buildings for over a decade. While standard cabling is looking backward at NBASET to provide lower speed (than 10GbE) connectivity, new SFP28 and QSFP28 standards are pushing us to 25/ 50/ 100GbE speeds. Still, there are many 10GbE and 40GbE ports available and cabling costs are very reasonable. If you are deciding between SFP+ or 10Gbase-T for a new rack, we suggest SFP+ is the better option.
This test shows the server-side implications of having different network interfaces. It does not show the total impact. One example of this is that by moving to 40GbE network storage can be significantly faster and more usable allowing better storage consolidation and utilization. Furthermore, 10Gbase-T switches use more power than their 10Gb SFP+ and 40Gb QSFP+ counterparts. We saw this with the QCT Quantamesh T3048-LY8 and T3048-LY9 switches that were similar except for their 10Gb interface. The impact of an entire rack of these systems can easily total 300-500w per rack which can mean another machine or monthly savings of $100-300/ month.
Overall, this test does show why we have been moving to 40GbE in our racks and away from interfaces like 10Gbase-T. 10Gbase-T will continue to be important in branch offices and with some dedicated hosting providers where there is a high ratio of 1GbE and Nbase-T infrastructure to integrate with. We hope this is a useful reference in your discussions on the different interface types and their power consumption.


 to see the differences in absolute power consumption and power consumption per Gbps)