
We started Project Kenko 01 to sacrifice two modern consumer SSDs to explore the endurance of newer devices. In this update, the drives have reached “1” on SMART Attribute 177 “Wear Leveling Count” and exhibited some unexpected behavior. We wanted to share our last interim update until the drives finally failed. This update is going to cover what happened as the drives approached 8TB written or just under one-quarter of their expected write endurance.
Background on Project Kenko 01
If you are not caught up here are our first three posts on Project Kenko 01:
- Samsung 750 EVOs Ready for Sacrifice: A modern SSD endurance experiment
- Project Kenko 01 Update: Samsung 750 EVOs pass 2TB written
- Project Kenko 01 Update: Samsung 750 EVOs pass 4TB written patterns emerge
Today we are reporting in validating some of the predictions we made in the first two updates. The published write endurance spec on these drives is 35TBW which is relatively low compared to SSDs of years past. We are using two primary test cases with these drives: one drive was filled to have 90GB of the 120GB (or 111.2TB formatted) capacity filled to simulate a relatively static OS, program, and file set typical for many desktop users. The other drive we are testing across the entire span of the drive. With unimaginative naming the former we call “90GB Pre-Fill” while we call the latter “0GB Pre-Fill”.
SMART Attribute 177 Wear Leveling Count on Samsung SSDs
Samsung provides a nifty PDF with their SMART attributes and their meanings. SMART Attribute 177 is “Wear Leveling Count” and Hard Disk Sentinel Pro correctly reports this.
This attribute represents the number of media program and erase operations (the number of times a block has been erased). This value is directly related to the lifetime of the SSD. The raw value of this attribute shows the total count of P/E Cycles.
By way of recap, here were the Wear Leveling Count indicators at 2.09TBW on both drives.
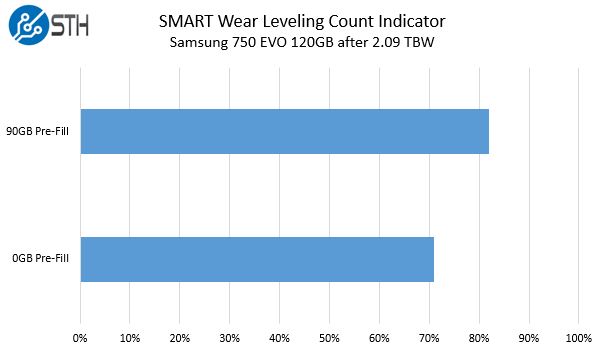
You can see that the 0GB Pre-Fill drive was starting to show higher wear leveling count indicators than the 90GB Pre-Fill drive.
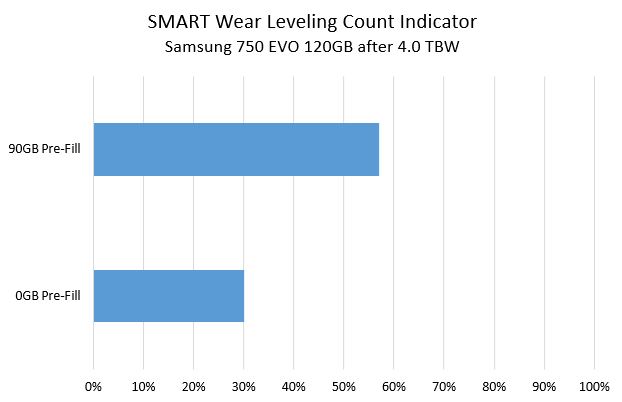
Moving onto the same snapshot at 4TBW we see that pattern amplified.
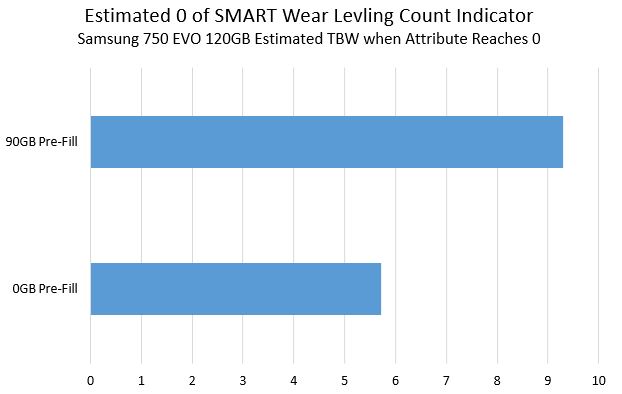
That was a completely unexpected result as of our last update at 4TB, here is where we thought we were heading in terms of a zero point for the wear level indicator:
Despite the trajectory each drive was on, the 0GB Pre-Fill drive hung around in the low single digits for some time then hit a paltry “1” value in the Wear Leveling Count attribute. Even getting to 10TB did not flip this 1 to a 0. Unlike what we saw from 0-4TBW, the drives were much closer together regarding final TBW when the indicator hit 1.
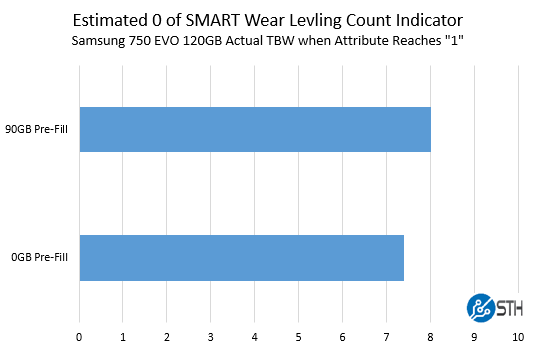
This result did align with what we had been seeing at the 4TB and 8TB checkpoints. Looking at the raw data which “shows the total count of P/E Cycles.” One on the indicator is about 500 P/E cycles on the NAND. The 90GB Pre-Fill hit 1 for this figure at 495 on the raw value.
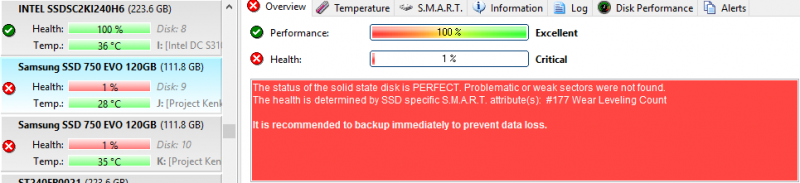
Here is the interesting part, as we pushed the drives past 500 on the P/E cycle indicators over 600, or 20% further than when we hit 1%, and the indicator was still at 1% on both drives. The 1% did not flip even at 10 TBW.
Final Words for this Update
Our next installment will feature when the drives failed, and how we saw them fail. It was extremely slow going as write speeds dipped to sub 14MB/s. Our big takeaway from this is that with either case, either using a drive with no data or using a drive with 90GB of static data, the wear level indicator hits 1% well before 35TBW on the drives. Since neither drive showed reallocated sectors even at 9TBW (a bit of foreshadowing here), it is hard to recommend using SMART monitoring tools and the SMART attribute for Wear Leveling Count on the Samsung 750 EVO SSDs. On the other hand, if you were an unscrupulous SMB or home IT person looking to replace desktop SSDs at a faster rate than they would need to be replaced, the Samsung 750 EVO’s Wear Leveling Count is an excellent attribute to point to show there is a “problem.”
More to come. In the meantime, we are not recommending Samsung SSD 750 EVO 120TB drives as even read caching drives. For basic desktop OS use they are fine. There is a trend toward using consumer drives as storage caching devices (e.g. L2ARC with ZFS) that do not need to feature write power loss protection. We are not recommending you try this with the Samsung 750 EVO.


How about doing the same tests with 4 in RAID-0?
/s/ Paul
Isn’t it a bit disingenuous to sell a drive as SATA compatible when it doesn’t come with “power loss protection”?
Most consumer drive don’t provide the same level of power loss protection. Consumer drives rely on the file system more to provide journaling so if there is power loss, the filesystem can work its way back and repair the data. In tiered storage systems you don’t have this luxury because there is no “sync” between the SSD and the hard disk so it is a chance that the hard disk can get ahead or vice versa in terms of who is more up to date. Power Loss Protection assures that in the case of power loss, the SSD will never drop data because it has a capacitor to flush its DRAM out into the Flash memory.
In other words this is pretty common and why enterprise drives are a lot more.
SSD has a decent paper on this.
http://www.slideshare.net/SamsungBusinessUSA/power-loss-protection-how-ssds-are-protecting-data-integrity
Are you sure you haven’t confused how much data you have written? You’ve been writing to these SSDs for 3 months and only managed 9TB. That makes no sense, it works out to 1MB/sec. These drives could write 9TB less than 2 days.
The only way the math works out is with random 4kb writes, to maximize write amplification.
Dan – there is a (long) lag between how long it takes to generate the data and when we are able to publish results.
These drives did write at maximum 11MB/s after 2-3 hours of writes.
11 MB / sec would be about 2750 random 4k writes per second. Makes sense.
I bet your 80% full drive lasted longer because the random writes were distributed over a smaller portion of the drive, which allowed more writes to be aggregated, and reduced write amplification.
Did this project ever come to a conclusion? I’ve been running 2 750 evos a 120gb os and a 500gb game drive for a little over a year. The S.M.A.R.T. stats are not looking good on the os drive (something like 60% drive health) along with a SanDisk 120 and a 2tb HDD. All other drives are holding up well with lots of data written. Just wondering if I should be planning to replace it pretty soon. I’ve been running the Samsung magician software the whole time with over provisioning and their speed boost caching thing also. What was the total written to the drives when they died?
Also asking if there was ever a conclusion to this study?
Also asking if there was ever a final article, or funeral?
Comments are closed.