NVIDIA Quadro RTX 6000 Compute Related Benchmarks
We are going to compare the Quadro RTX 6000 to our growing data set.
Geekbench 4
Geekbench 4 measures the compute performance of your GPU using image processing to computer vision to number crunching.
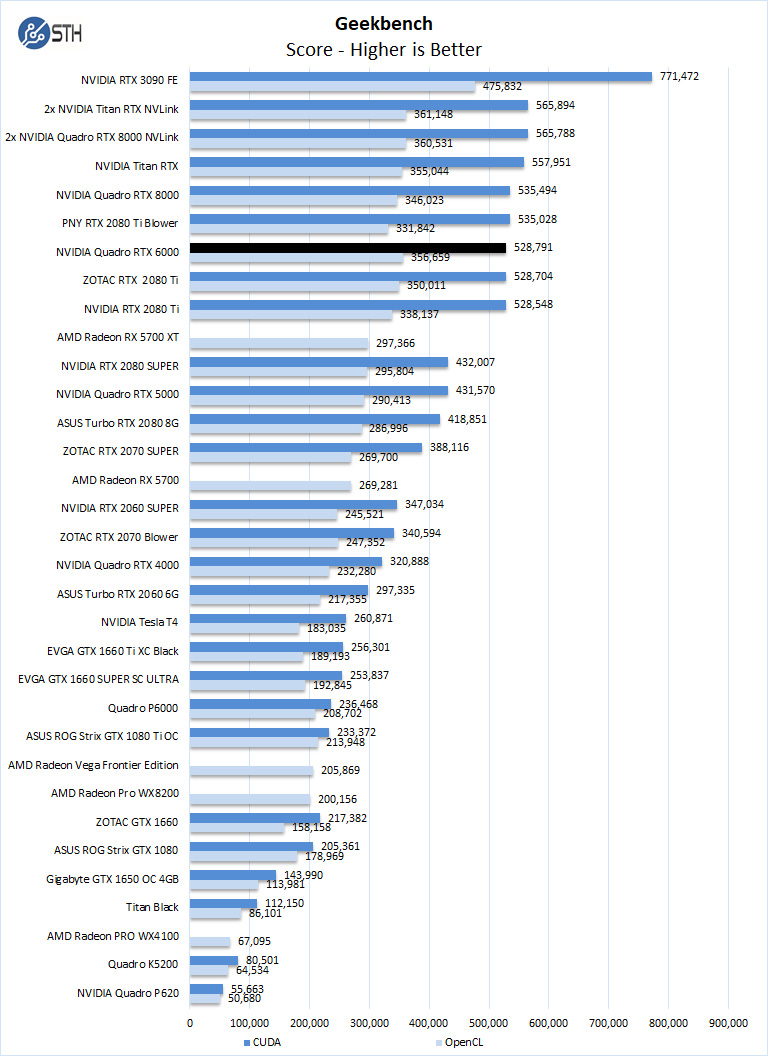
Our first compute benchmark, and we see the NVIDIA Quadro RTX 6000, we can see the raw OpenCL and CUDA horsepower in action. The Quadro RTX 6000 runs close to the Quadro RTX 8000, with the main difference between the two, is the amount of memory installed with 48GB on the Quadro RTX 8000. We will also notice the TITAN RTX will have an edge on the Quadro RTX 6000 with its more advanced dual-fan cooling solution.
LuxMark
LuxMark is an OpenCL benchmark tool based on LuxRender.
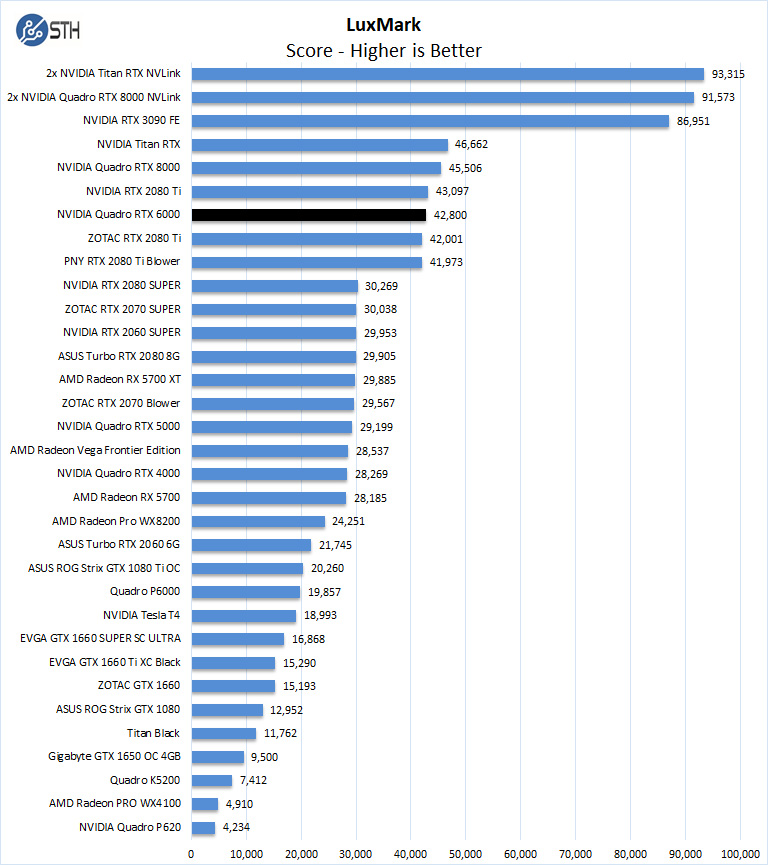
In LuxMark, a single Quadro RTX 6000 can reach near Titan RTX and Quadro RTX 8000. In LuxMark, a single RTX 2080 Ti just edges out the Quadro RTX 6000.
AIDA64 GPGPU
These benchmarks are designed to measure GPGPU computing performance via different OpenCL workloads.
- Single-Precision FLOPS: Measures the classic MAD (Multiply-Addition) performance of the GPU, otherwise known as FLOPS (Floating-Point Operations Per Second), with single-precision (32-bit, “float”) floating-point data.
- Double-Precision FLOPS: Measures the classic MAD (Multiply-Addition) performance of the GPU, otherwise known as FLOPS (Floating-Point Operations Per Second), with double-precision (64-bit, “double”) floating-point data.
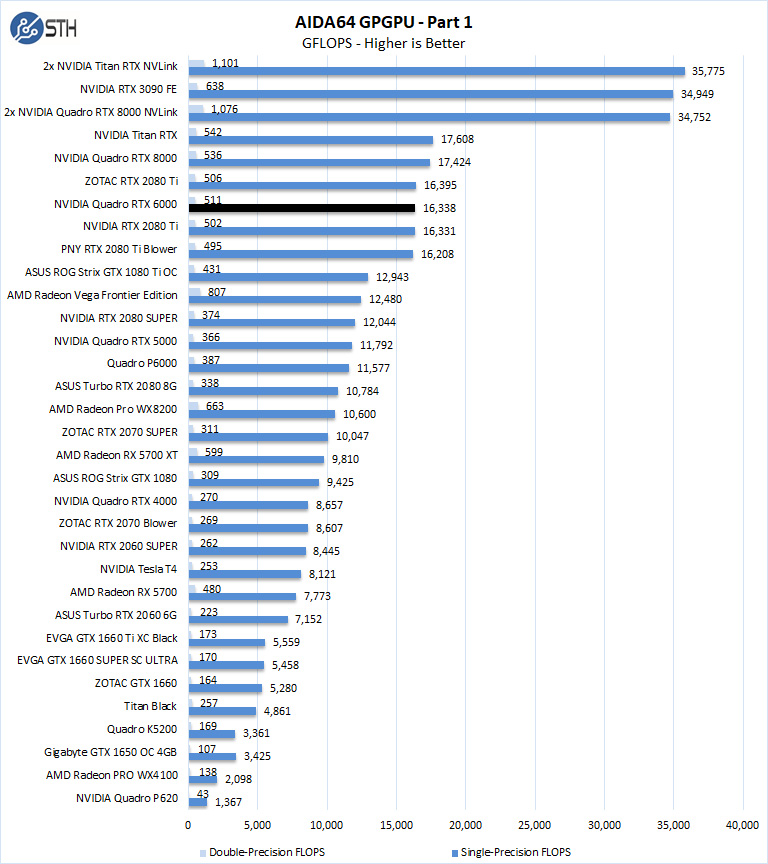
The next set of benchmarks from AIDA64 are:
- 24-bit Integer IOPS: Measures the classic MAD (Multiply-Addition) performance of the GPU, otherwise known as IOPS (Integer Operations Per Second), with 24-bit integer (“int24”) data. This particular data type defined in OpenCL on the basis that many GPUs are capable of executing int24 operations via their floating-point units.
- 32-bit Integer IOPS: Measures the classic MAD (Multiply-Addition) performance of the GPU, otherwise known as IOPS (Integer Operations Per Second), with 32-bit integer (“int”) data.
- 64-bit Integer IOPS: Measures the classic MAD (Multiply-Addition) performance of the GPU, otherwise known as IOPS (Integer Operations Per Second), with 64-bit integer (“long”) data. Most GPUs do not have dedicated execution resources for 64-bit integer operations, so instead, they emulate the 64-bit integer operations via existing 32-bit integer execution units.
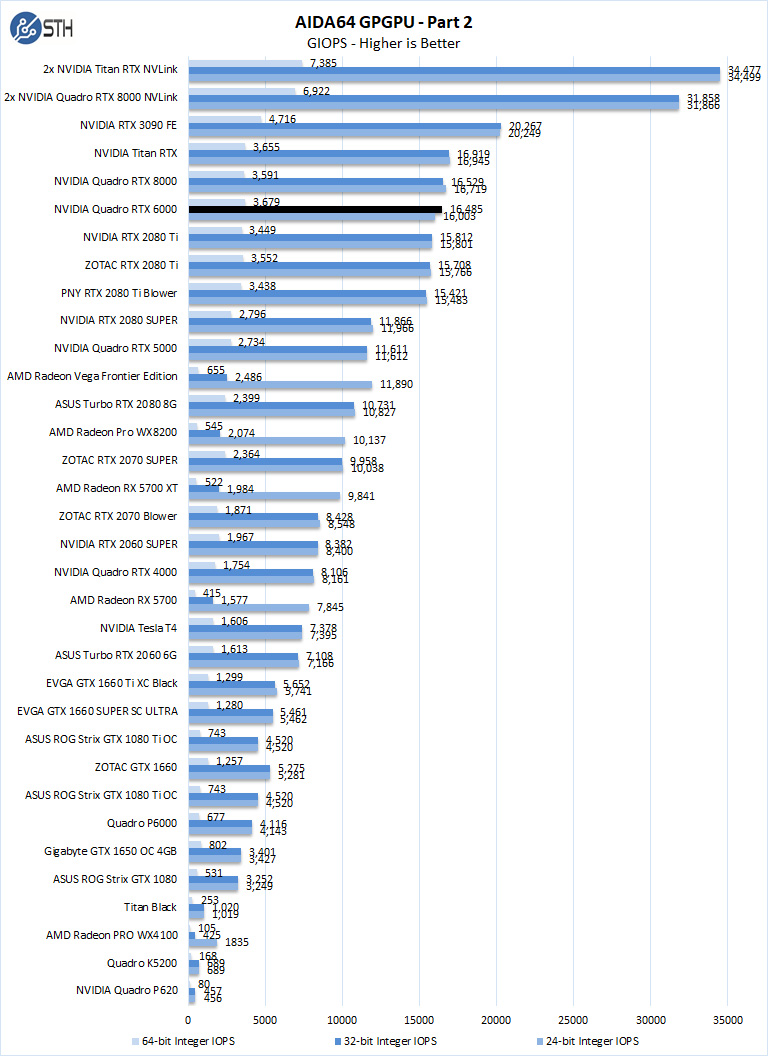
The take away here is the Quadro RTX 6000 falls into the cluster of RTX 2080 Ti scores and very close to the Quadro RTX 8000.
hashcat64
hashcat64 is a password cracking benchmarks that can run an impressive number of different algorithms. We used the windows version and a simple command of hashcat64 -b. Out of these results, we used five results in the graph. Users who are interested in hashcat can find the download here.
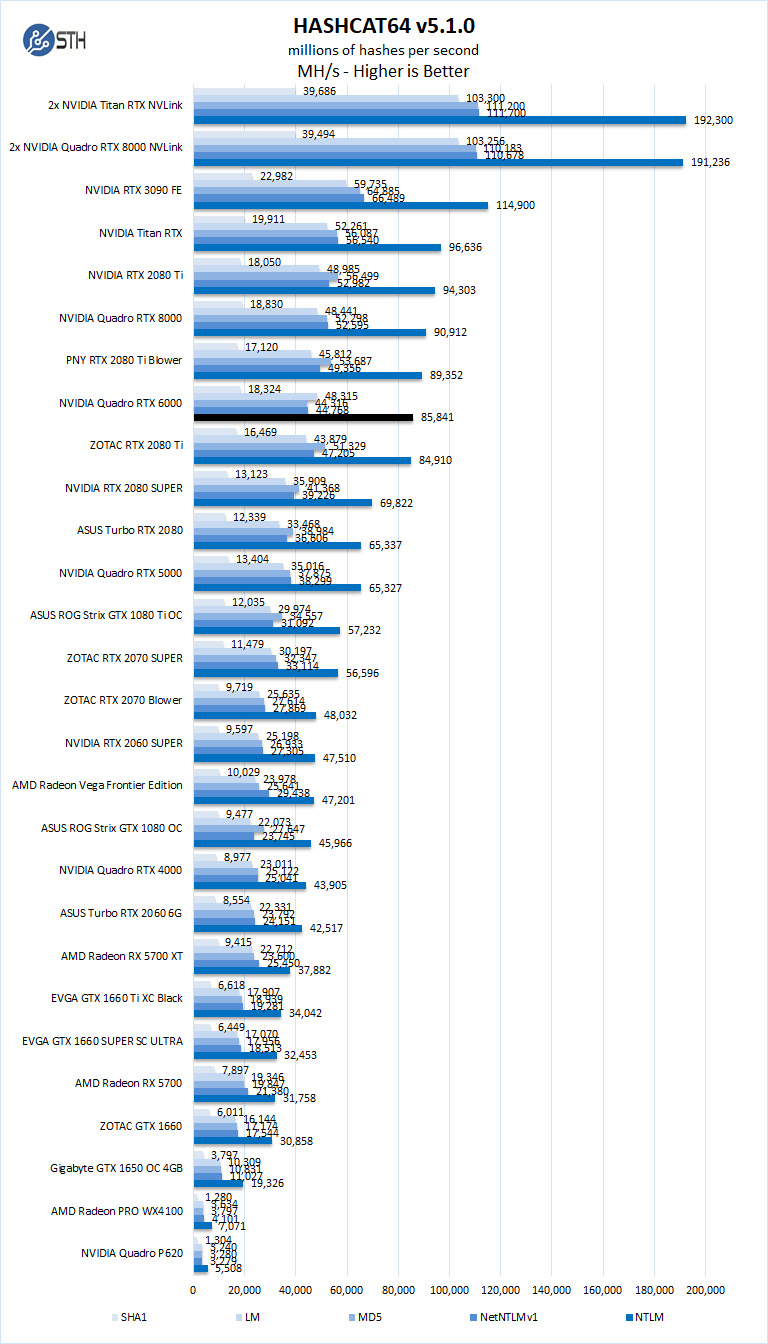
Hashcat can put a heavy load on GPU’s, and here we see the dual-fan graphics cards have the edge in our results. However, with the cooling system used on the Quadro RTX 6000, Hashcat heat loads are easily handled.
SPECviewperf 13
SPECviewperf 13 measures the 3D graphics performance of systems running under the OpenGL and DirectX application programming interfaces.
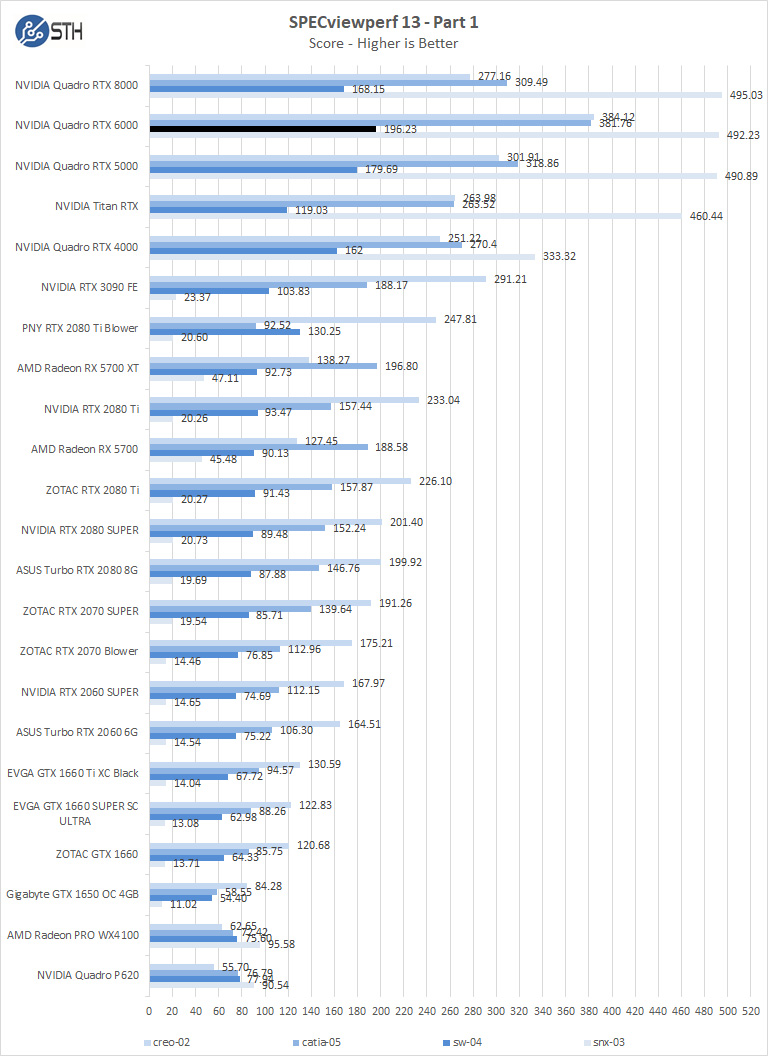
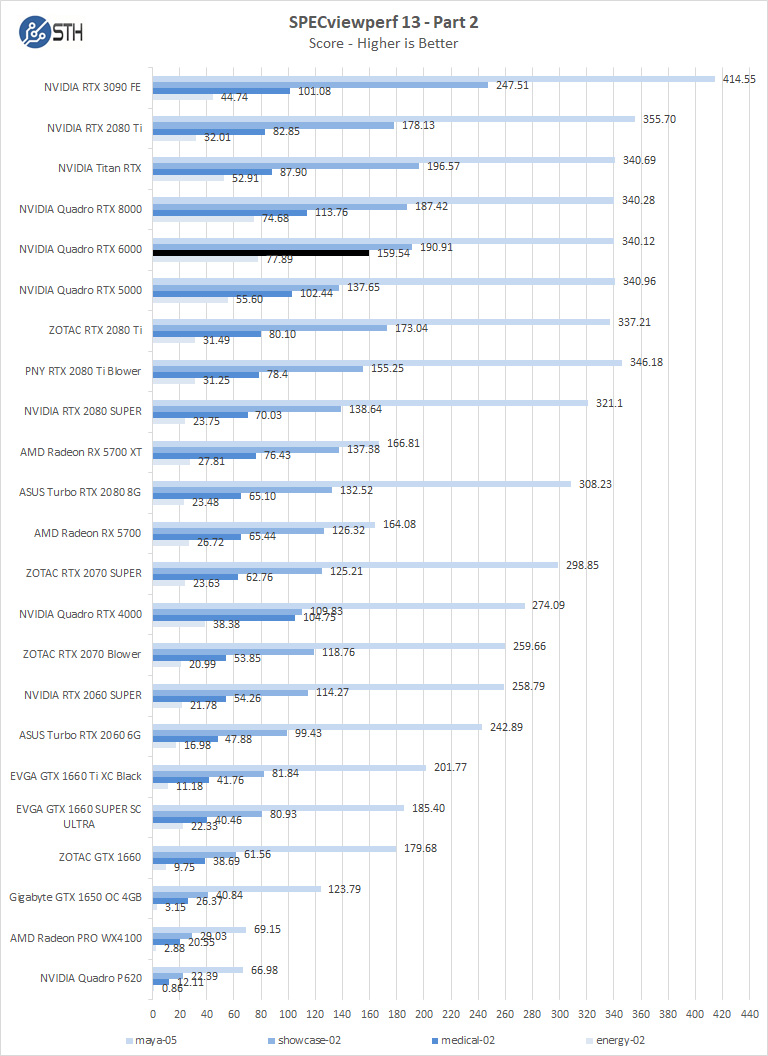
As drivers improve, we should see continued performance increases in this benchmark. In the first chart for SPECviewperf, we find the Quadro RTX 6000 compares nicely to the Quadro RTX 8000 but does have a slight edge in some aspects. Overall, these are close.
Let us move on and start our new tests with rendering-related benchmarks.

One of the big differences between the RTX Titan and the RTX 6000 is the ability to RDMA, aka, GPU-Direct DMA between machines.
I’d love to see that tested using Mellanox RDMA ConnextX 5 or higher cards on a 25, 40 or 100gb VPI or ethernet connection.
@Larry Barras
I’ve a dual 2080ti machine in a network that runs gig-E and QDR Infiniband. I have to explicitly tell NCCL to not look on the IB network for peers. So, I think you may be able to do RDMA with the gamer cards too.
No, none of the “consumer” range cards can do GPU-direct DMA, not even the Titan RTX. I’ve tried directly in the API and no dice, period. The RTX2080ti definitely will not, the API always returns an error code of “no permission/feature unsupported”.
@Larry
Ah, OK then. Good to know.
Hey guys!
Not sure what is up with that Octane benchmark guys but I think you should recheck the data you’ve gathered so far.
Given all the other reviewers and the official benchmark results page on Otoy’s page an RTX 2080ti performs about the same as the Titan RTX. The 3090 is typically about 2x as fast as the 2080ti in that benchmark – not quite the difference you’ve benchmarked.
Seems like something is super off there as the benchmark isn’t VRAM limited and so even a 2080 should be positioned a lot differently.
Are you sure you are running the latest benchmark? I can’t seem to reproduce these results on my end at al..