Kioxia CD8P-R 30.72TB Basic Performance
For this, we are going to run through a number of workloads just to see how the drive performs. We would also like to provide some easy screenshots of the desktop tool so you can see the results quickly and easily compared to other drives you may have.
CrystalDiskMark 8.0.4 x64
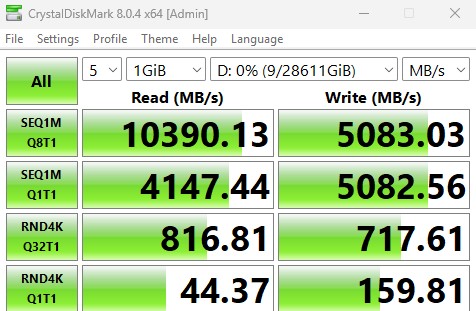
CrystalDiskMark is used as a basic starting point for benchmarks as it is something commonly run by end-users as a sanity check. Here is the smaller 1GB test size:
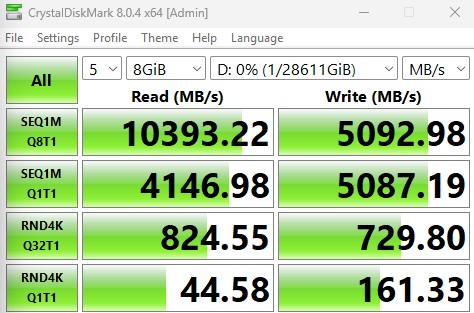
Here is the larger 8GB test size:
In the event you want to see a side-by-side, here they are:
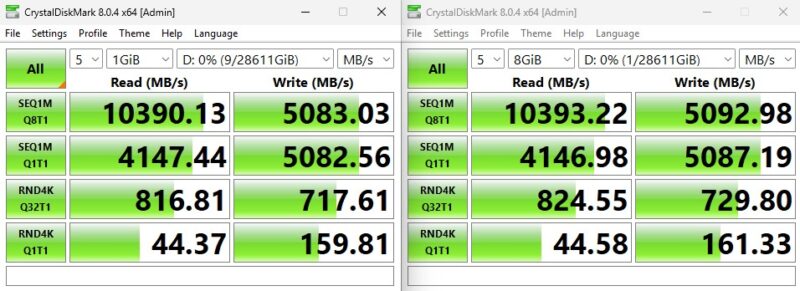
Two items to note here. Kioxia is above its spec sheet rated specs. It is also very close on is small test size to large test size delta. Many large capacity drives have a large delta between the large and small test sizes, but that is not happening here.
ATTO Disk Benchmark
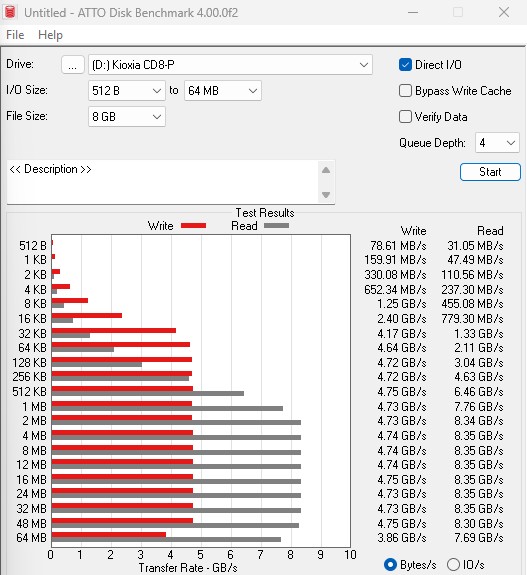
The ATTO Disk Benchmark has been a staple of drive sequential performance testing for years. ATTO was tested at both 256MB and 8GB file sizes.

Here is the 8GB result:
For those who want to see the results compared side-by-side:

Again, ATTO results have tended to be lower on many of the PCIe Gen5 data center SSDs.
AS SSD Benchmark
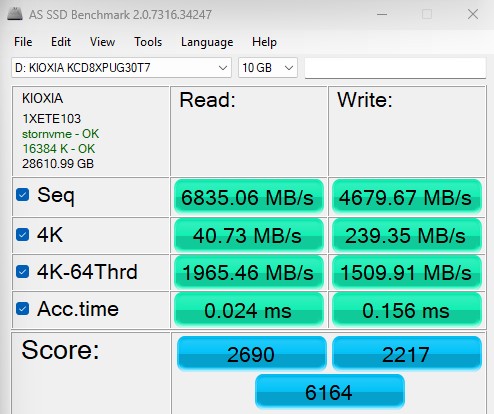
AS SSD Benchmark is another good benchmark for testing SSDs. We run all three tests for our series. Like other utilities, it was run with both the default 1GB as well as a larger 10GB test set.
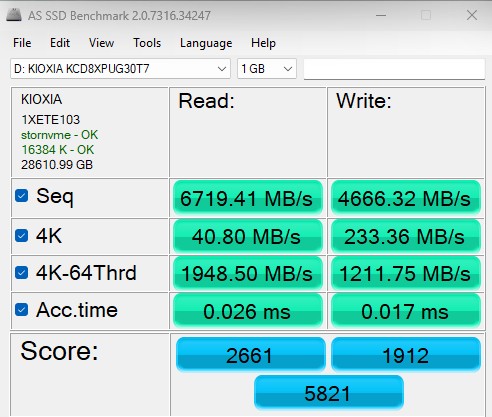
Here is the 10GB test size:
Again, here is the side-by-side.
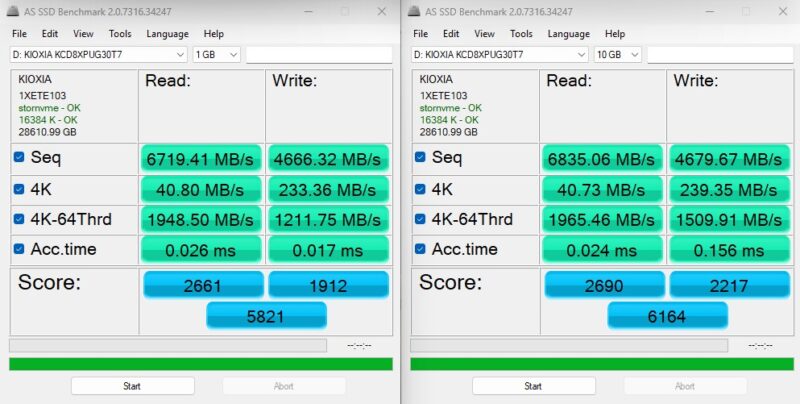
AS SSD is notably lower on the read side compared to the other benchmarks.
Next, let us get into some of our Linux-based benchmarking.
Kioxia CD8P-R 30.72TB Four Corners Performance
Our first test was to see sequential transfer rates and 4K random IOPS performance for the Kioxia. Please excuse the smaller-than-normal comparison set. In the next section, you will see why we have a reduced set. The main reason is that we swapped to a multi-architectural test lab. We test these in more than 20 different processor architectures spanning PCIe Gen4 and Gen5. Still, we wanted to take a look at the performance of the drives.
Here is the 4K random read-and-write performance:
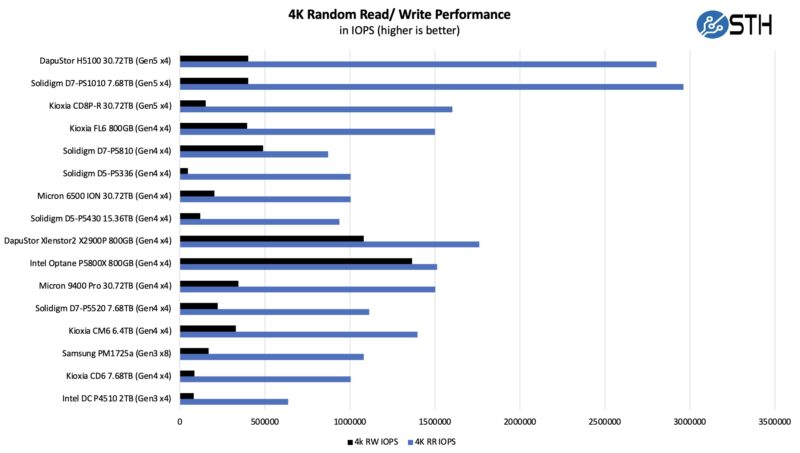
Overall, these are decent results but there is a gap between high-end PCIe Gen5 NVMe SSDs and the capacity focused CD8P-R.
Kioxia CD8P-R 30.72TB Application Performance Comparison
For our application testing performance, we are still using AMD EPYC.
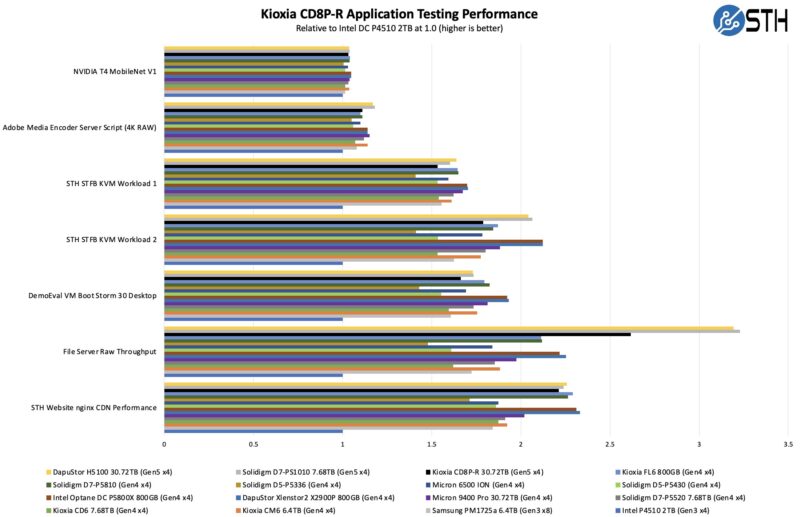
As you can see, there are a lot of variabilities here in terms of how much impact the SSD has on application performance. Let us go through and discuss the performance drivers.
On the NVIDIA T4 MobileNet V1 script, we see very little performance impact on the AI workload, but we see some. The key here is that the performance of the NVIDIA T4 mostly limits us, and storage is not the bottleneck. We have a NVIDIA L4 that we are going to use with an updated model in the future. Here we can see a benefit to the newer drives in terms of performance, but it is not huge. That is part of the overall story. Most reviews of storage products are focused mostly on lines, and it may be exciting to see sequential throughput double in PCIe Gen3 to PCIe Gen4, and double again from Gen4 to Gen5, but in many real workloads, the stress of a system is not solely in the storage.
Likewise, our Adobe Media Encoder script is timing copy to the drive, then the transcoding of the video file, followed by the transfer off of the drive. Here, we have a bigger impact because we have some larger sequential reads/ writes involved, the primary performance driver is the encoding speed. The key takeaway from these tests is that if you are mostly compute-limited but still need to go to storage for some parts of a workflow, the SSD can make a difference in the end-to-end workflow.
On the KVM virtualization testing, we see heavier reliance upon storage. The first KVM virtualization, Workload 1, is more CPU-limited than Workload 2 or the VM Boot Storm workload, so we see strong performance, albeit not as much as the other two. These are KVM virtualization-based workloads where our client is testing how many VMs it can have online at a given time while completing work under the target SLA. Each VM is a self-contained worker. Here, the random write performance causes a bit lower of a result than we might see otherwise, but the sequential figures are good and the random read is decent so overall the drive ends up performing fairly well here.
Moving to the file server and nginx CDN, we see much solid QoS and throughput from the Kioxia SSD. The drive pulls ahead on the file server due to its faster sequential speeds. On the nginx CDN test, we are using an old snapshot and access patterns from the STH website, with caching disabled, to show what the performance looks like in that case. Here is a quick look at the distribution:
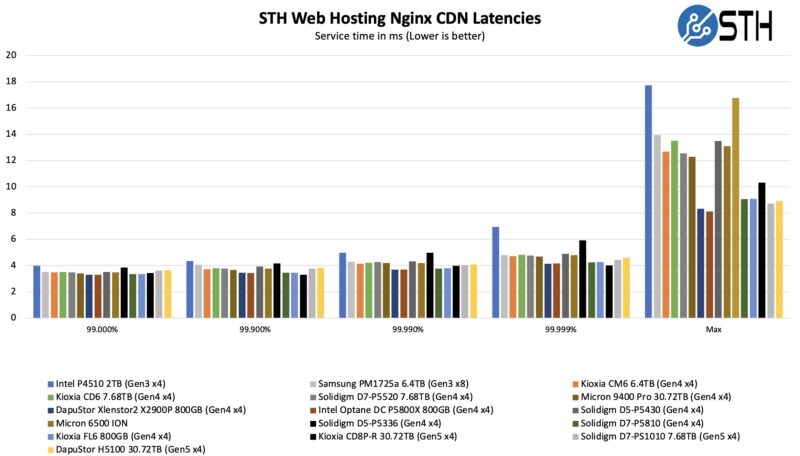
We get some benefit from the PCIe Gen5, but this is one where the storage class memory drives can pull ahead.
Now, for the big project: we tested these drives using every PCIe Gen5 architecture we could find, and not just x86.


I did not see the $/TB cost nor an estimate on expected power-off data retention.
In addition to @Eric’s comment I’d like to see latency (with charts like StorageReview does).
If all the info could be presented in a chart like @Patrick’s excellent CPU comparison charts (such as the style of “AMD EPYC 9004 Genoa SKU List And Value Analysis Comparison To Milan And Rome By Core Count”), but for SSDs instead of CPUs that would be a valuable addition.
> The Kioxia CD8P-R is not designed to be the highest capacity drive, but instead as a balance point between cost, capacity, and price.
I saw neither cost nor price, so the last sentence does not make sense.
For those asking about the cost per TB, data retention lifetime and latency, here is what I could find from a very quick search:
Unit price: $4,799.00 at Newegg.com for model number KCD8XPUG30T7 (This will likely be the same or close to the same for other vendors.)
$/TB: $156.22
Latency and data retention are not given. This would be a datasheet item and this isn’t given in any of Kioxia’s documentation. Kind of a fail on their part.
What i know, Data-Retention is always the same. No real details, only JEDEC standards: 3 months at 40°C in power-off state by assuming that the SSD reaches the maximum rated endurance.
Never saw something different. probably this is a point, why the pro/consumer SSD’s have less endurance. They have to retain the data much longer. I am not even sure if there is a real binning of NAND dies for enterprise SSD’s.
Comments are closed.