
Today we wanted to share a few initial results on our Intel Optane testing. We were able to test a small (175GB) PCIe AIC drive. What is more, unlike some of the other benchmarks you may have seen of the P4800X, we were able to test the machines using our full infrastructure. This is the same infrastructure we have available to those using our DemoEval service.
Test Configuration
We are using a standard server with the Intel Optane drive.
- CPU: Dual Intel Xeon E5-2650 V4
- System: Supermicro “Ultra” Series 2U Server
- SAS Controller: LSI SAS3108 with boot drive (Intel DC S3610 480GB)
- Optane SSD: 175GB PCIe AIC
- NVMe SSD: 400GB Intel DC P3700 U.2 2.5″
- SATA SSD: 400GB Intel DC S3710 2.5″ (on PCH)
- Network: 4x 10GbE (Intel), 40GbE (Chelsio T580)
This configuration is similar to what we would expect many of the early servers to have. With Optane AIC form factors being prevalent at launch, we are going to see a lot of storage server applications and using these cards as accelerators rather than a primary storage or memory extension role.
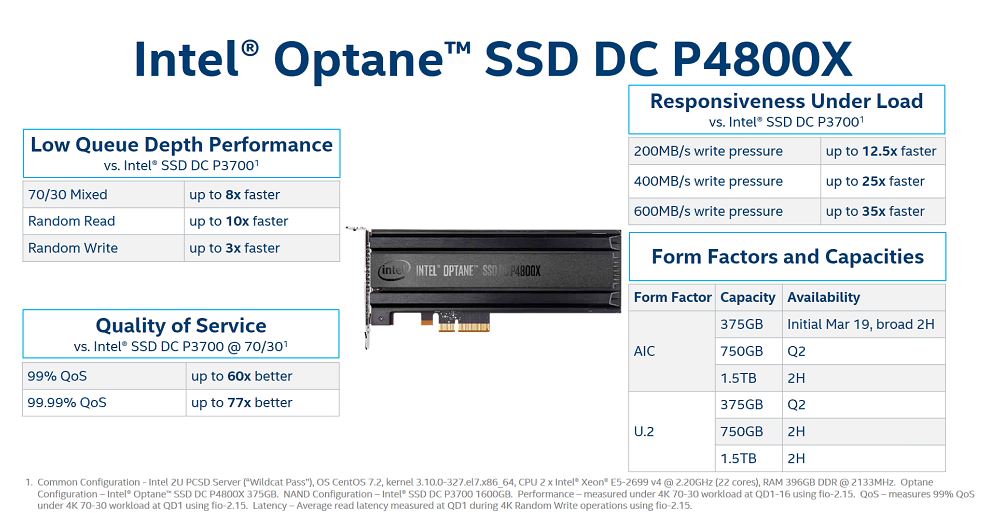
The Optane SSD we tested is a smaller capacity version of the Intel DC P4800X and is not a shipping capacity. Performance is likely different from the retail unit, but the numbers speak for themselves, Optane is fast.
We are evaluating interest in setting up a longer term Intel P4800X 375GB based Optane server in our DemoEval platform for remote testing.
Synthetic Workloads
We wanted to run a few of our synthetic workloads on the Optane drive to see how it compares to its competition. We had both the Intel DC P3700 400GB drive to represent the Intel NVMe line and the Intel DC S3710 to represent the SATA line.
Database
We are using the standard Iometer Database profile and running tests over a four hour period at QD 4-128.
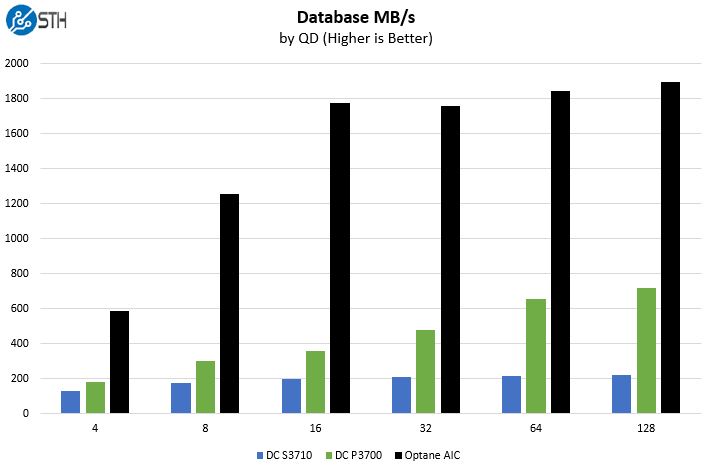
Here we can see some mega trends. First, the Intel Optane drive is dominant.
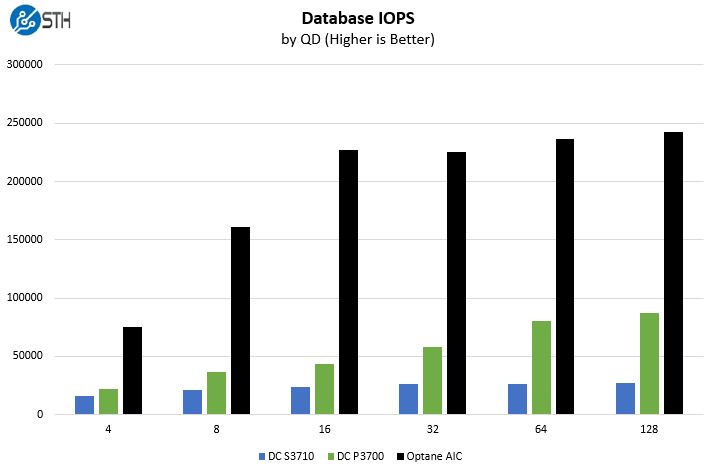
Second, we are seeing about 2.5x the performance from Intel Optane over higher-end NVMe SSDs.
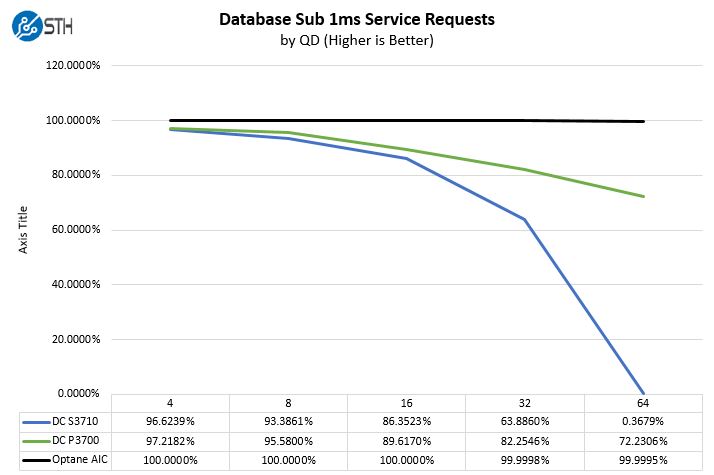
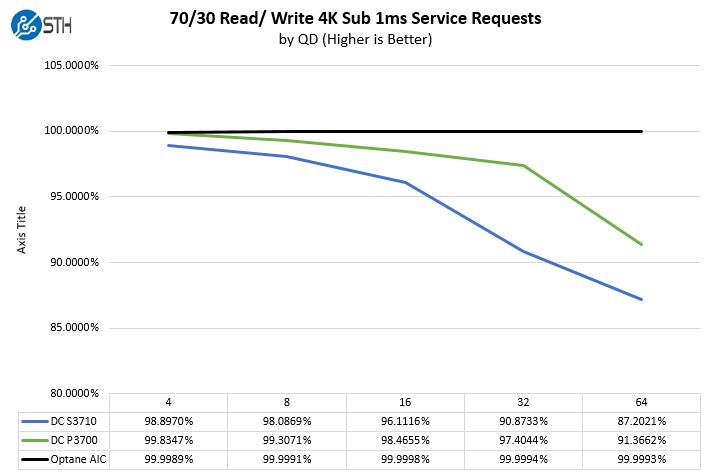
This is perhaps the most interesting. We put a line at 1ms latency and looked at how the different drives performed. You can see the Intel DC S3710 is somewhat competitive at lower QD, but the Intel Optane is awesome. At higher QD, the SATA drive chokes. We are omitting the QD128 results to make charts readable.
Mixed Read/ Write
There are very few workloads that are write-heavy. These are applications such as log drives and write cache drives. Even for those drives, a 100% write workload is unrealistic.
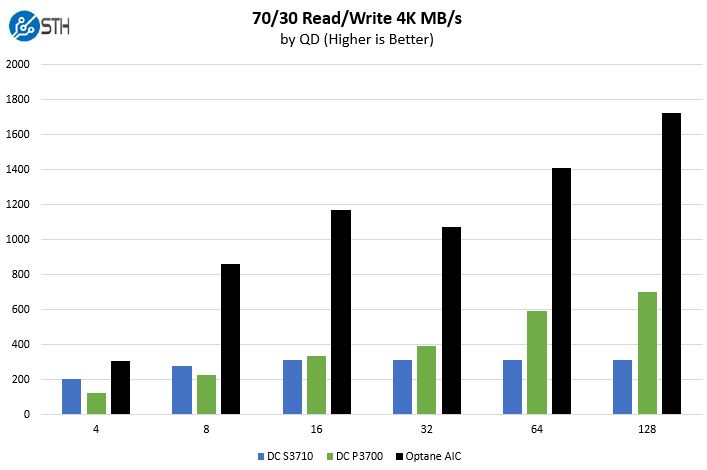
In the mixed workload, we see about 2-3x the performance from the Optane drive.
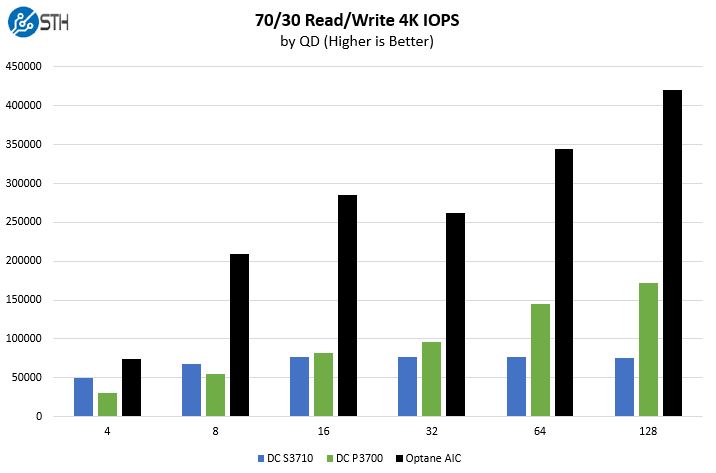
We did want to note here that if one decides to use larger sequential file transfers, the IOPS that the Intel DC P3700 puts out has no issue with saturating the PCIe bus.
Again, we see some excellent results for the Intel Optane drive. We could take the inverse of these numbers and make the chart relative which would make the Intel Optane numbers look amazing.
Web Server
From SSD vendors we have spoken to, heavy read workloads are still the predominant workloads for SSDs.
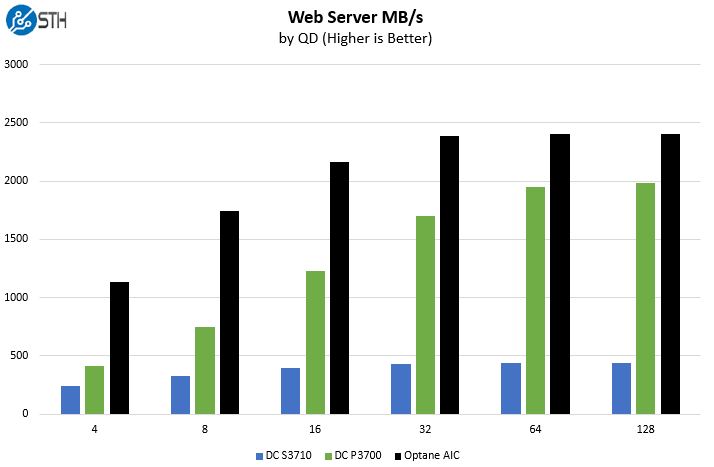
Here the Intel DC P3700 performs much better compared to the Optane drive, and at a lower price.
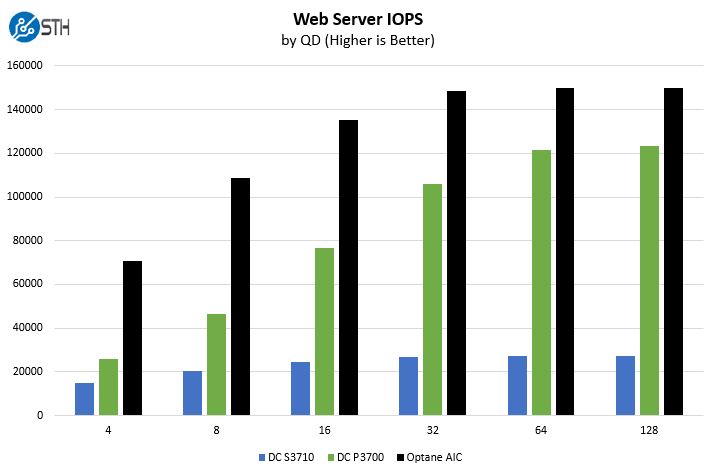
We do want to point out that if you are doing web hosting using a DC P3700 you are doing something wrong. The Intel DC P3600 series is a significantly better fit as is the DC P3520 series. For this use case, get more capacity.
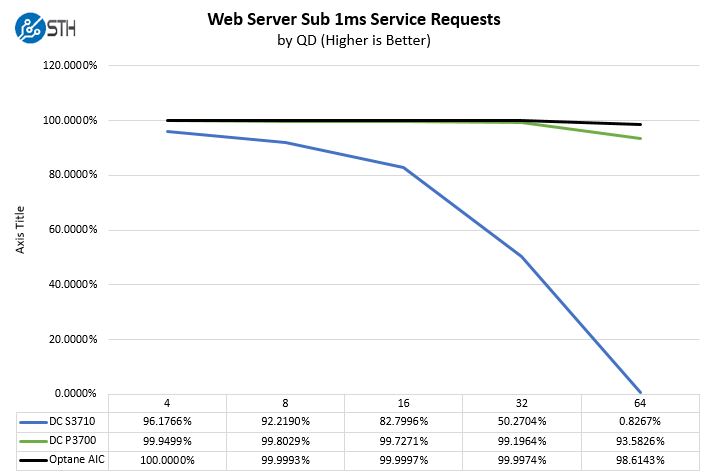
If you are reading larger files, NAND-based NVMe drives perform extremely well at higher capacities and lower costs. Also, much of web serving is based on RAM cache so if you are read heavy, or have larger transfer size reads, get larger NAND NVMe drives (P3600/ P3520 series) or more RAM. Skip Optane in that use case.
Real-World Web Server: STH WordPress NGINX CDN Benchmark
We first introduced this test with some of our QuickAssist benchmarking last year. The basic premise is this, we have an “aged” real-world WordPress application, the STH main site development snapshot we took last year. For those wondering, this is actually a development branch we had been using to test the STH main site re-design that went live recently.
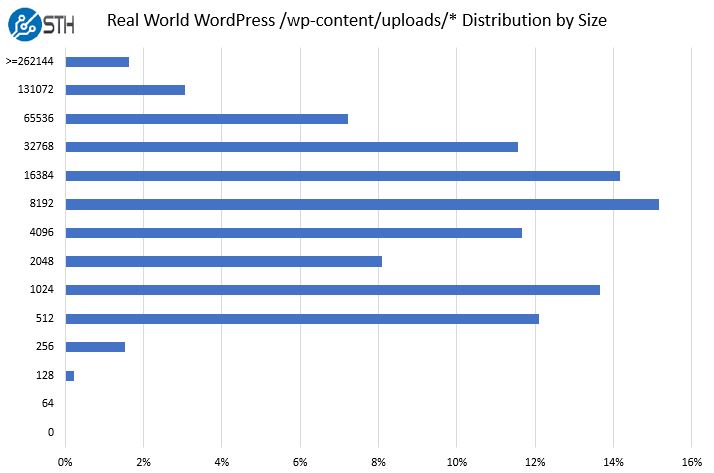
There is still a bit to work on but it does give us the opportunity to get some real-world testing impact. We took the ~120,000 files in /wp-content/uploads/ of the 2016 era snapshot and built a server image to serve these files as if it were a CDN server for the site. If you were wondering why there are so many image files, each image uploaded for reviews has different sizes stored for thumbnails, larger images and etc. By storing resized files, they can be served as static content when a web request is made which is much more efficient.
After over 7 years, this accumulates to become a large number of static files. We took a quarter’s worth of access logs and use them to weight how often we want to access each file. Essentially, this is a CDN based on STH’s Q3 image serving. Here is what a size distribution looks like in that directory:
To get enough load, we do need to utilize one of our 40GbE lab networks. That has a few implications. First, we are not testing raw disk performance with this. Instead, we have file systems (ext4 in this case), and the network stack also in the middle.
Here is what the basic test setup looks like:
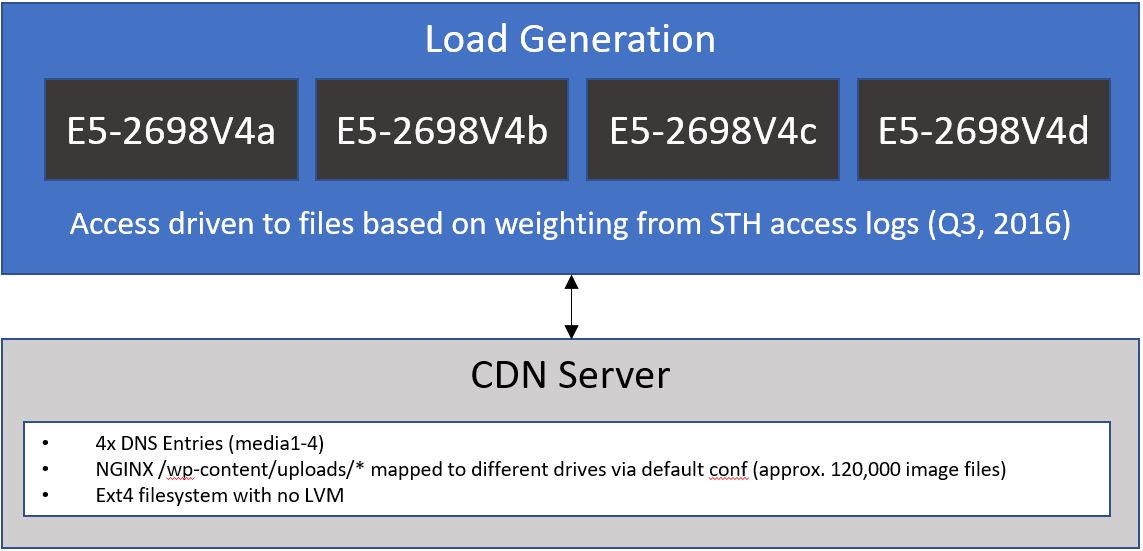
The reason we are using so many load generation nodes is that we wanted to ensure that the CPUs and NICs were all running a lower load. This is not an easy test to get running since it requires a lot of hardware. Luckily, we had a few days where it was possible to get machines free. We also needed to ensure we were hitting the drive as cache not caching in RAM.
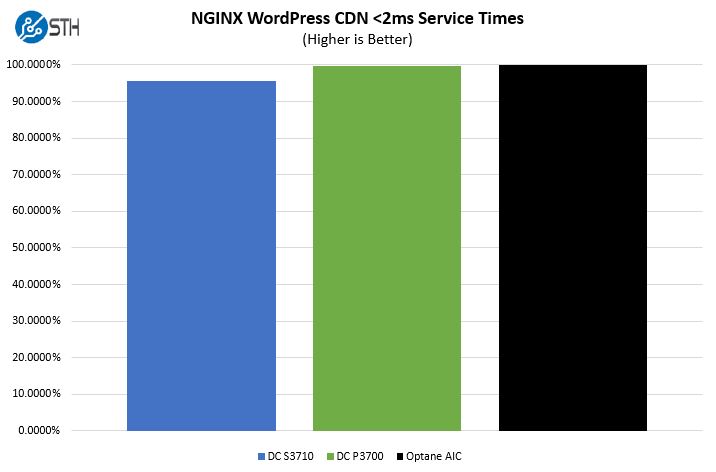
Here is what we saw in terms of a latency distribution using 2,000 requests per second for four hours, using sub-2ms as our standard.
We are going to change the X-Axis scale just to highlight some differences here:
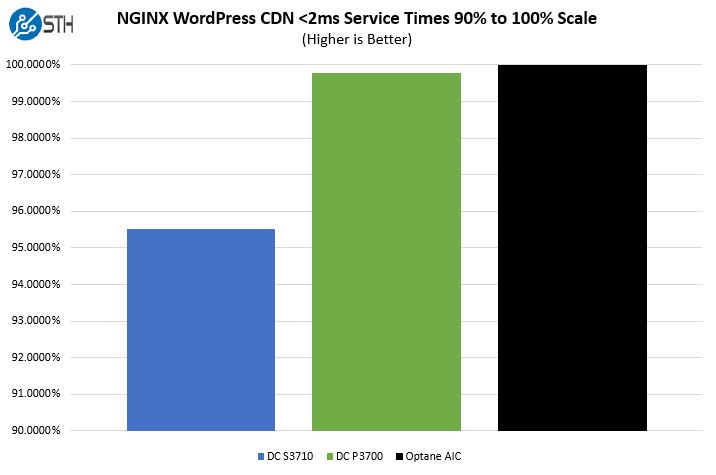
As you can see, the Optane drive did very well on this test. There are frankly additional optimizations we could have made, but this is an example where we ran the exact same workload with the only difference being the working directory being on NAND v. Optane.
We also will note that while the differences may be small, the Intel Optane drive is delivering three nines at <2ms. While that may not seem enormous, if a page is loading 20-30 images per visitor, the chance of any single visitor seeing a blip is higher.
Stay tuned as the next-generation Linux-Bench will have some of these features incorporated (although obviously without the STH copy.) This is too complex so we are going to simplify it for a future version.
Real-World Intel Optane in ZFS ZIL/ SLOG and L2ARC Scenarios
Our ZFS testing with Optane was cut too short to publish figures we can stand behind for our community. We did have the chance to start testing but we found that some of the tests we were running (e.g. database VMs) on the various zpools needed additional tuning because we were leaving performance on the table with Optane. Frankly, we did not have time before others got on the system.
What we can say is this, Optane (Intel DC P4800X) is now the technology to get for a SLOG/ ZIL device if you just want maximum performance outside of something exotic (e.g. NVDIMMS.) The Intel DC P3700 is still great in this role, and is relatively inexpensive, even when overprovisioned for logging device duties but we were getting incrementally faster results with the Optane drive. Since the leading practice is to mirror ZIL / SLOG devices there is a major cost factor in getting two AIC form factor Intel DC P4800X Optane drives and the P3700 is significantly less expensive.
On the L2ARC, the question will quickly become whether it is better to get more cache/ or start a dedicated SSD pool rather than go smaller, higher performance, Optane.
When looking at the client Intel Optane drives (the 16GB and 32GB drives) we suggest other options. The sequential write speeds are too low for 10GbE sync writes as a ZIL/ SLOG device and the capacity is too low for us to recommend as an L2ARC device. Instead, just get more RAM or a bigger/ better NVMe SSD.
Final Words
If prices and capacities were equal, you would get the Optane drive over NAND any day of the week. Until that day, we still think that the Optane drive is a tremendous value in terms of caching if you need consistent performance. If you have a heavy write workload, this is the drive to get. On the other hand, if you have short bursts of writes, the Intel DC P3700 still works very well at a lower cost.


Any word yet on the U.2 models?