Intel Core i9-10980XE Linux Benchmarks
For this exercise, we are using our legacy Linux-Bench scripts which help us see cross-platform “least common denominator” results we have been using for years as well as several results from our updated Linux-Bench2 scripts. At this point, our benchmarking sessions take days to run and we are generating well over a thousand data points. We are also running workloads for software companies that want to see how their software works on the latest hardware. As a result, this is a small sample of the data we are collecting and can share publicly. Our position is always that we are happy to provide some free data but we also have services to let companies run their own workloads in our lab, such as with our DemoEval service. What we do provide is an extremely controlled environment where we know every step is exactly the same and each run is done in a real-world data center, not a test bench.
We are going to show off a few results, and highlight a number of interesting data points in this article.
Python Linux 4.4.2 Kernel Compile Benchmark
This is one of the most requested benchmarks for STH over the past few years. The task was simple, we have a standard configuration file, the Linux 4.4.2 kernel from kernel.org, and make the standard auto-generated configuration utilizing every thread in the system. We are expressing results in terms of compiles per hour to make the results easier to read:
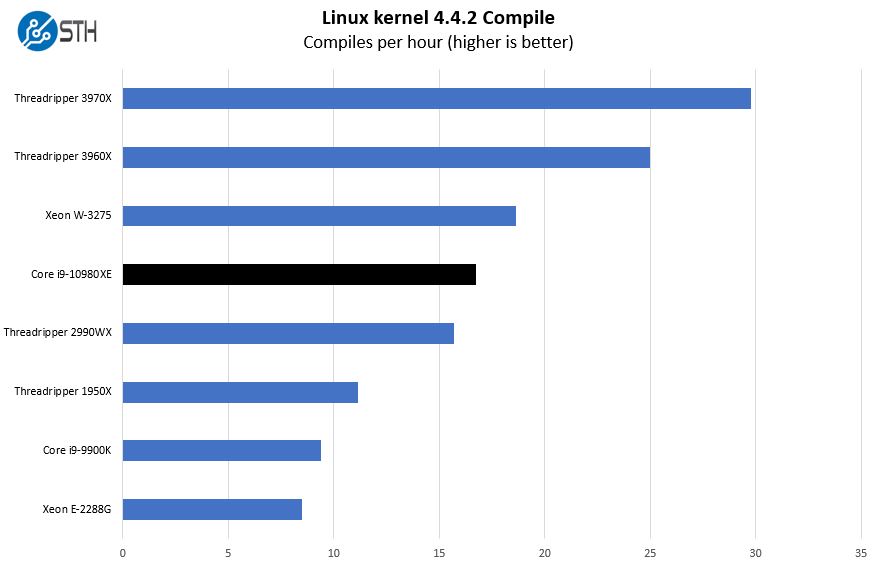
Software developers run compile jobs like these quite often making this a “classic” test. Here, the Core i9-10980XE performs well, even beating out the older generation 32-core Threadripper 2990WX.
c-ray 1.1 Performance
We have been using c-ray for our performance testing for years now. It is a ray tracing benchmark that is extremely popular to show differences in processors under multi-threaded workloads. We are going to use our 8K results which work well at this end of the performance spectrum.
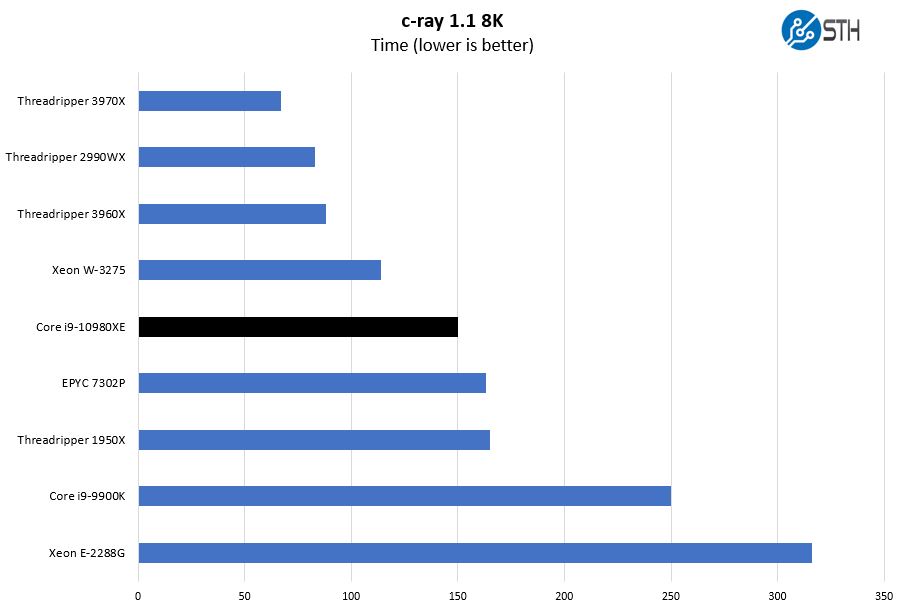
In many ways, this is a similar benchmark to Cinebench on the Windows side. We can see a fairly typical AMD performance profile here. We also added the AMD EPYC 7302P benchmarks in this chart to give a bit more context. It is perhaps interesting that the 3rd gen 16-core server part is pacing the Threadripper 1950X which was a high-end workstation part of just two generations ago.
7-zip Compression Performance
7-zip is a widely used compression/ decompression program that works cross-platform. We started using the program during our early days with Windows testing. It is now part of Linux-Bench.
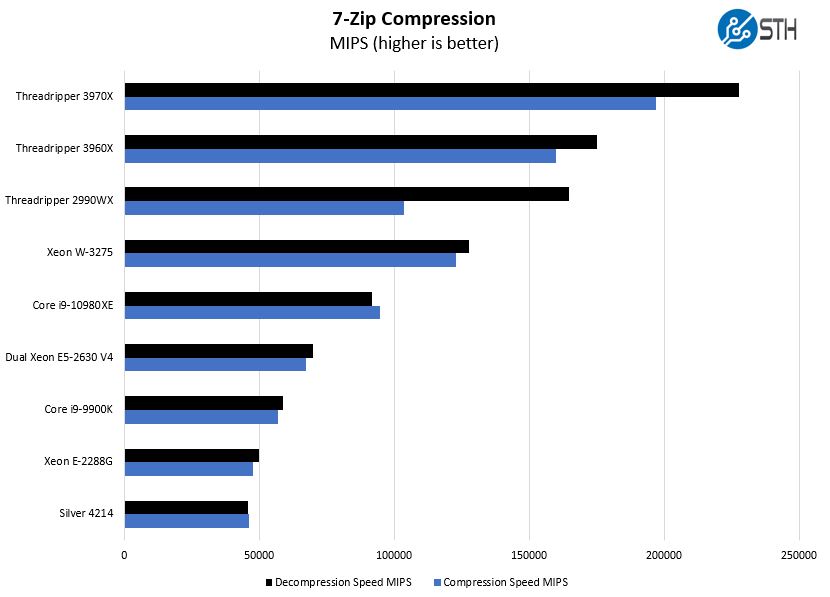
We added the dual Intel Xeon E5-2630 V4 results here because it is important for context. The “high-end desktop” or “HEDT” market was previously a dual Intel Xeon market. Intel and AMD now have parts based on server chips with reduced features and pricing that are designed to take market share from dual Xeon systems in some cases. Compared to a dual Xeon E5 V4 system, still the newest from just three years ago, we now get significantly more performance in a lower-cost desktop platform. For many users, this will be an upgrade path instead of going to dual Xeon Scalable.
NAMD Performance
NAMD is a molecular modeling benchmark developed by the Theoretical and Computational Biophysics Group in the Beckman Institute for Advanced Science and Technology at the University of Illinois at Urbana-Champaign. More information on the benchmark can be found here. We are going to augment this with GROMACS in the next-generation Linux-Bench in the near future. With GROMACS we have been working hard to support Intel’s Skylake AVX-512 and AVX2 supporting AMD Zen architecture. Here are the comparison results for the legacy data set:
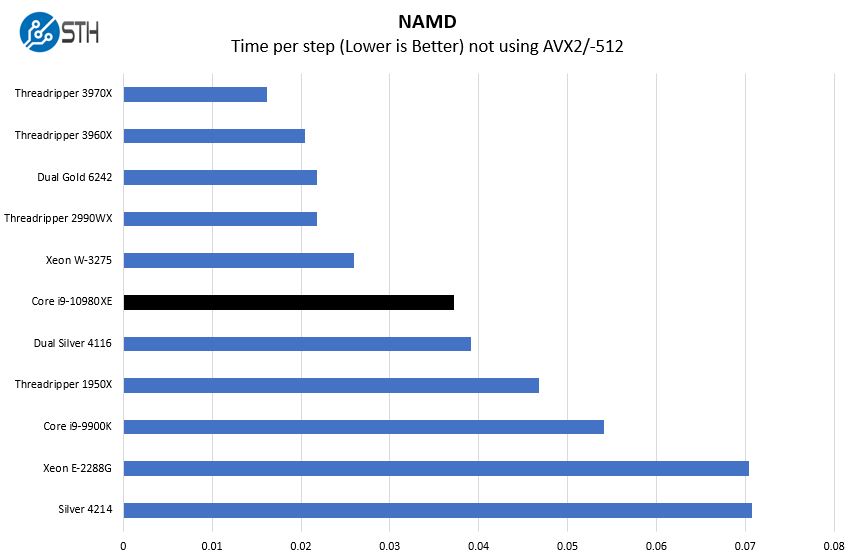
This is a clear picture of why cores matter. The Intel Core i9-10980XE does a great job staying in turbo frequencies, but it also is still working with “only” 18 cores. There are now much higher core count products out there. We also wanted to show dual Intel Xeon Gold 6242 results to show that moving to dual Xeon CPUs for workstations can still offer enormous gains.
Sysbench CPU test
Sysbench is another one of those widely used Linux benchmarks. We specifically are using the CPU test, not the OLTP test that we use for some storage testing.
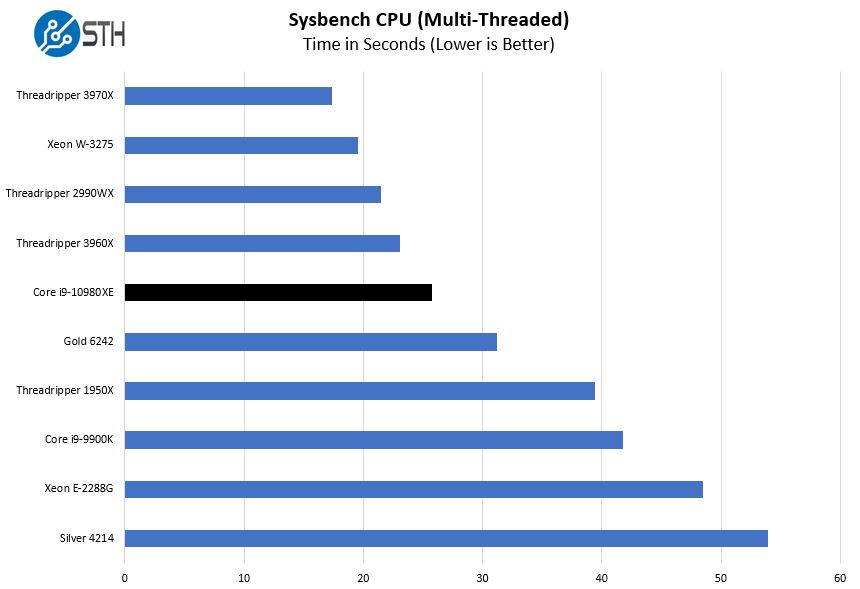
If you were considering a Xeon Silver workstation instead of the Core i9-10980XE, we are going to suggest that the Core i9 is a better workstation performance. One cannot get dual-socket scaling nor high RDIMM capacities with the current Core i9. Still, for raw CPU performance, the Core i9-10980XE is better.
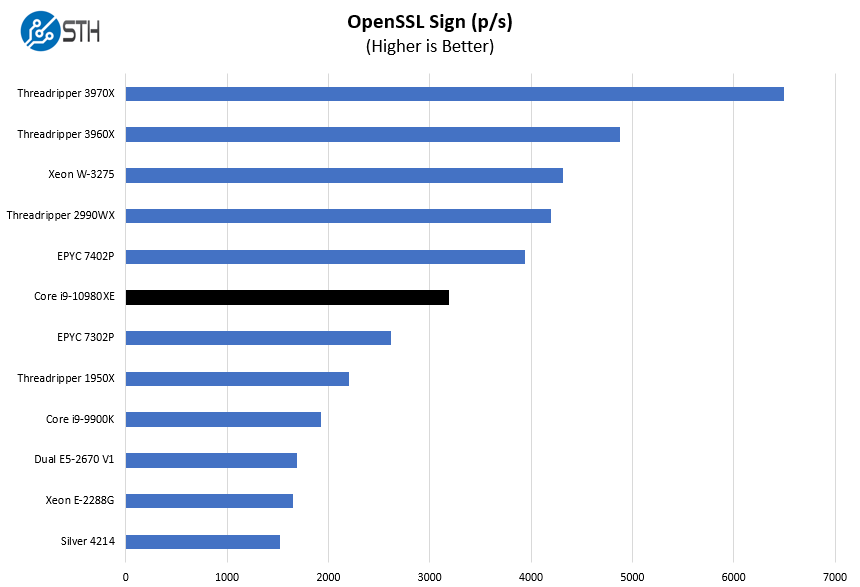
OpenSSL Performance
OpenSSL is widely used to secure communications between servers. This is an important protocol in many server stacks. We first look at our sign tests:
Here are the verify results:
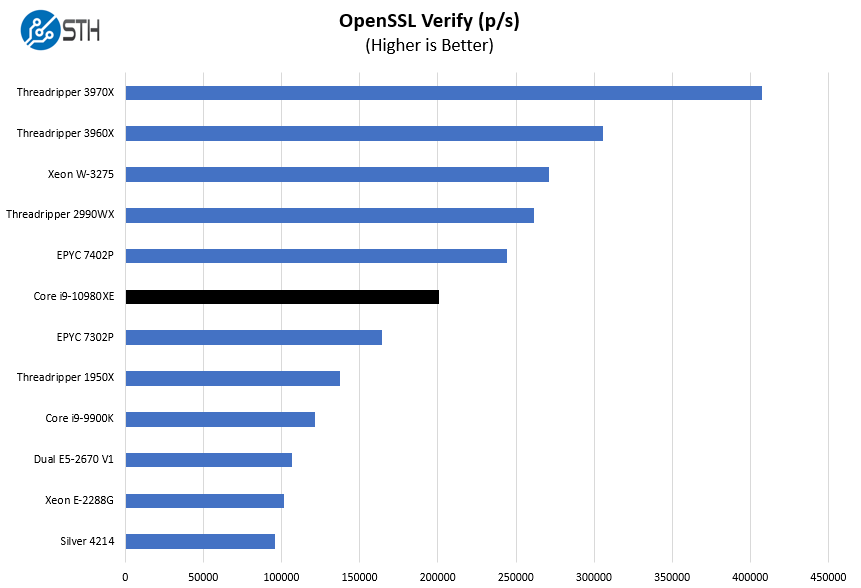
If you are still clinging to a dual Intel Xeon E5-2670 V1 (16 cores total) workstation, there are a lot of cases like this where the single 18-core Core i9-10980XE is around twice as fast. Years ago, the dual Intel Xeon E5-2670 V1 was a great value, but with this aggressive price trend, it would be hard for us to suggest buying a second-hand dual Xeon E5 V1 system today as a workstation.
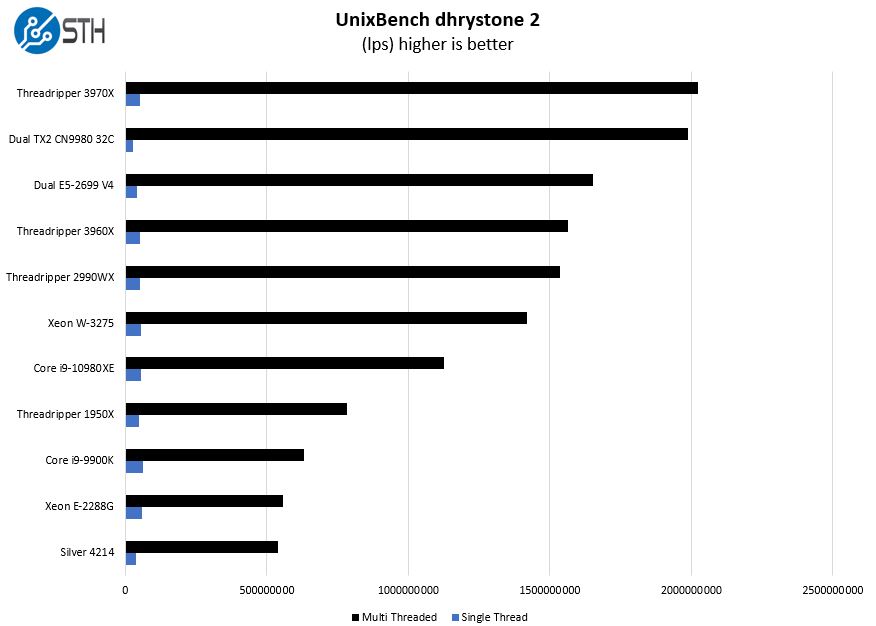
UnixBench Dhrystone 2 and Whetstone Benchmarks
Some of the longest-running tests at STH are the venerable UnixBench 5.1.3 Dhrystone 2 and Whetstone results. They are certainly aging, however, we constantly get requests for them, and many angry notes when we leave them out. UnixBench is widely used so we are including it in this data set. Here are the Dhrystone 2 results:
Here are the whetstone results:
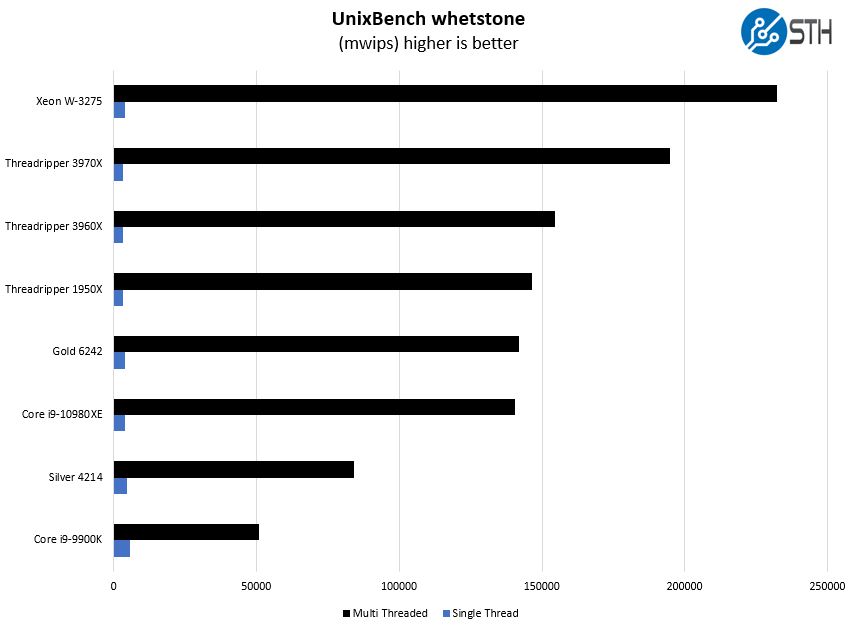
The performance here is good and basically in-line with what we would expect at this point. We tried adding a few interesting comparisons to get more data points in the mix.
Chess Benchmarking
Chess is an interesting use case since it has almost unlimited complexity. Over the years, we have received a number of requests to bring back chess benchmarking. We have been profiling systems and are ready to start sharing results:
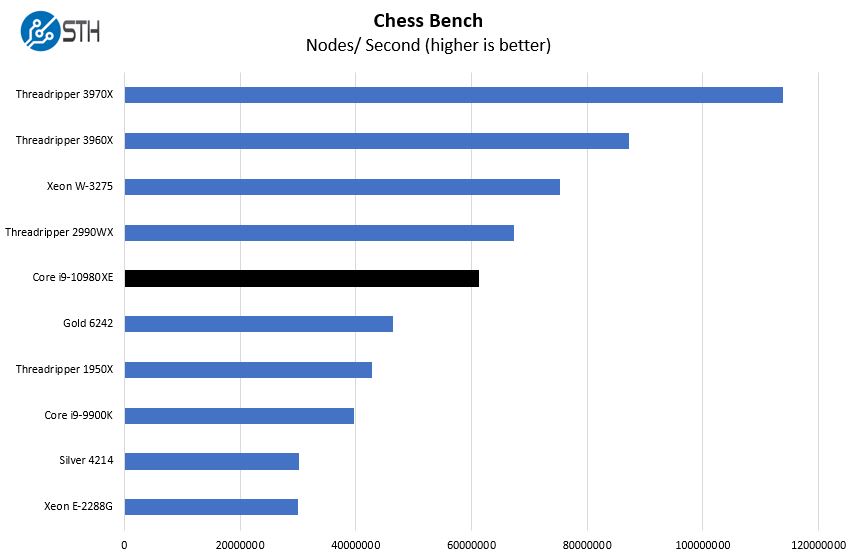
The $1000 CPU performing better than the Intel Xeon Gold 6242 here shows how much more price/ performance Intel is doing on the desktop market versus the server market at this point.
Next, we are going to look at the power consumption before getting to our final thoughts.


