Inland Professional 1TB Performance Testing
We test using both the default smaller test size as well as larger test sets on our benchmarks. This allows us to see the difference between lighter and heavier workloads.
CrystalDiskMark x64
CrystalDiskMark is used as a basic starting point for benchmarks as it is something commonly run by end-users as a sanity check.
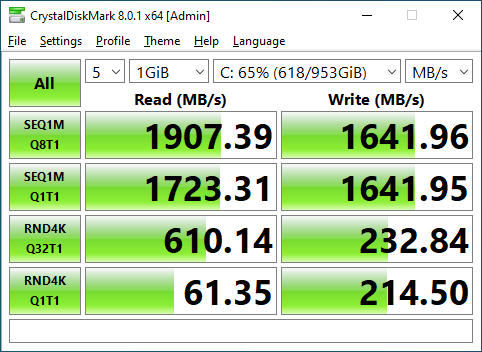
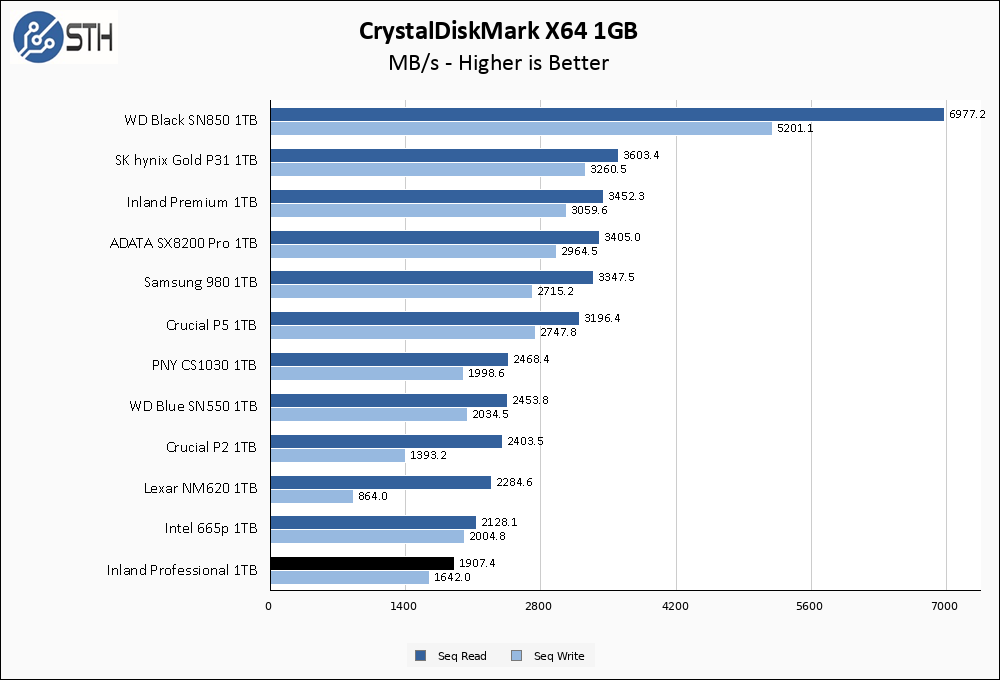
The Inland Professional promised modest sequential performance of 2000 MB/s read and 1600 MB/s write, and it got pretty close to that in our first CrystalDiskMark test. This puts the Inland drive near the bottom of our chart, but as a lower-end drive it was never intended to be a top-end drive to begin with.
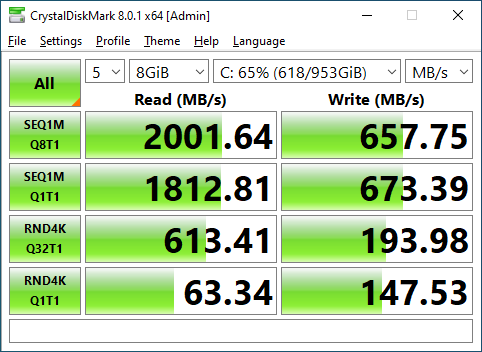
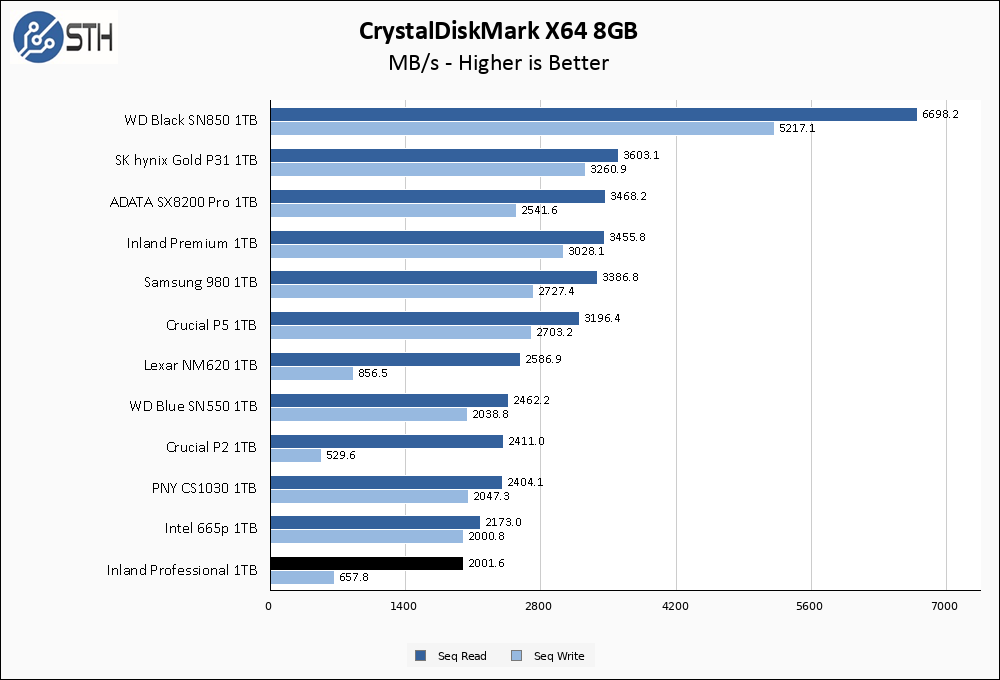
On the larger CrystalDiskMark test, read performance improves to exactly the rated 2000 MB/s number, but write performance sinks precipitously to around 650 MB/s. The DRAM-less nature of this drive is likely the culprit here.
ATTO Disk Benchmark
The ATTO Disk Benchmark has been a staple of drive sequential performance testing for years. ATTO was tested at both 256MB and 8GB file sizes.
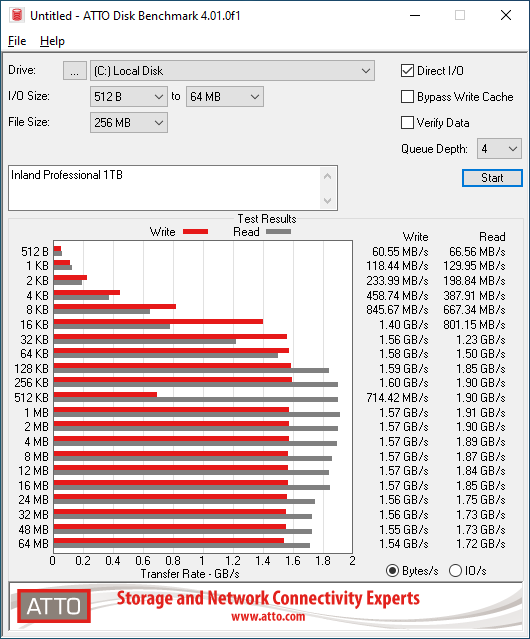
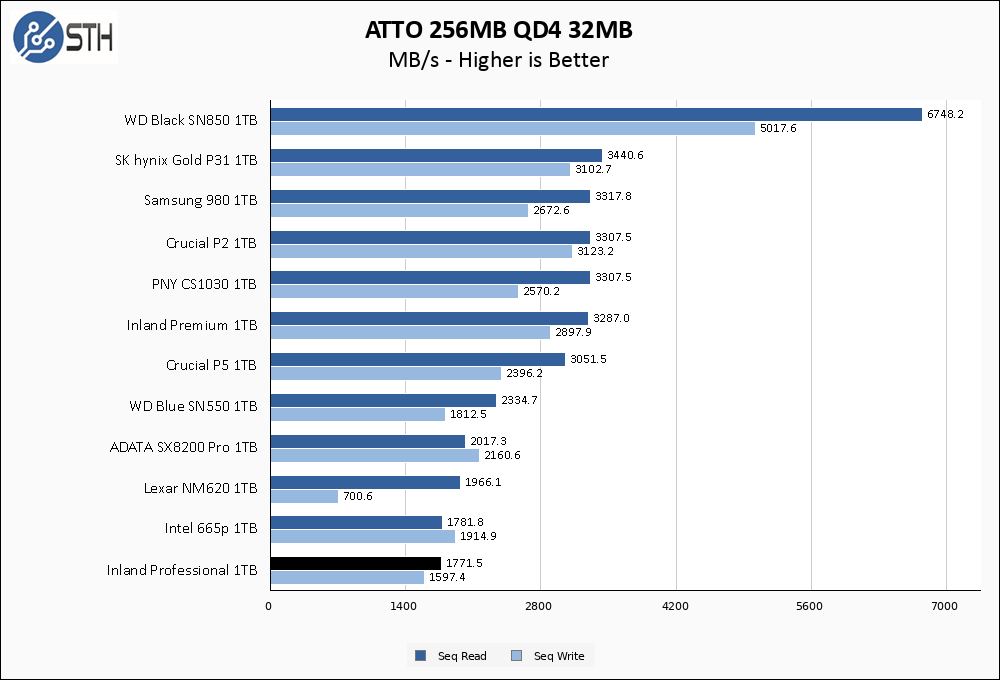
Read performance in ATTO loses a step compared to in CrystalDiskMark, though in fairness the same thing happens to most of its competitors on the chart. Write performance again lands squarely on the rated 1600 MB/s.
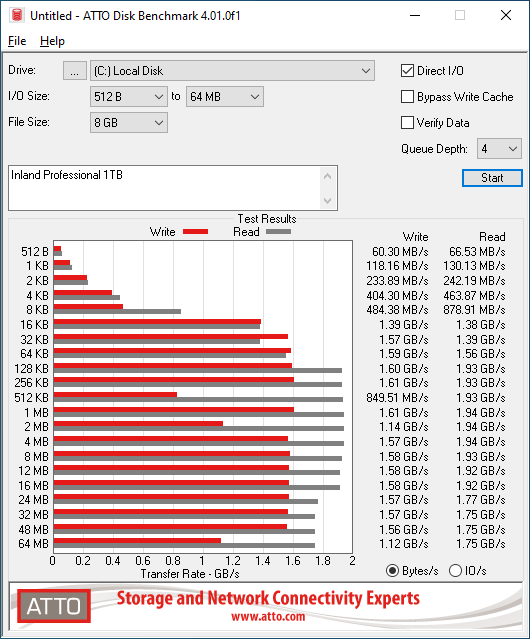
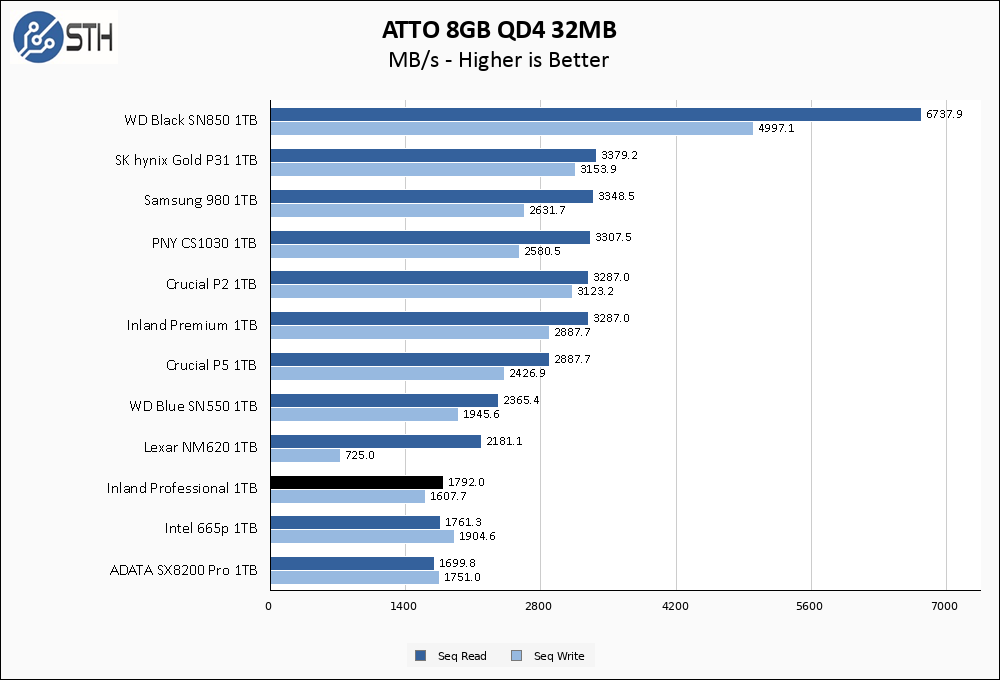
The Inland Professional 1TB fares much better in the larger ATTO test than it did in CrystalDiskMark’s larger test. Hardly any variance between the two test sizes is noted, which is a good thing! As a result, the Inland Professional 1TB manages to avoid the bottom of our chart for the first time.
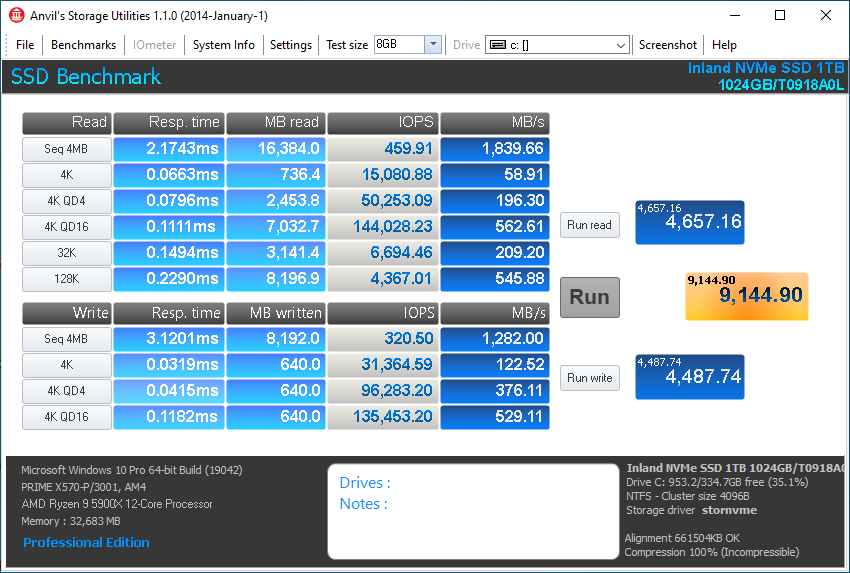
Anvil’s Storage Utilities
Anvil’s Storage Utilities is a comprehensive benchmark that gives us a very in-depth look at the performance of drives tested. This benchmark was run with both a 1GB and 8GB test size.

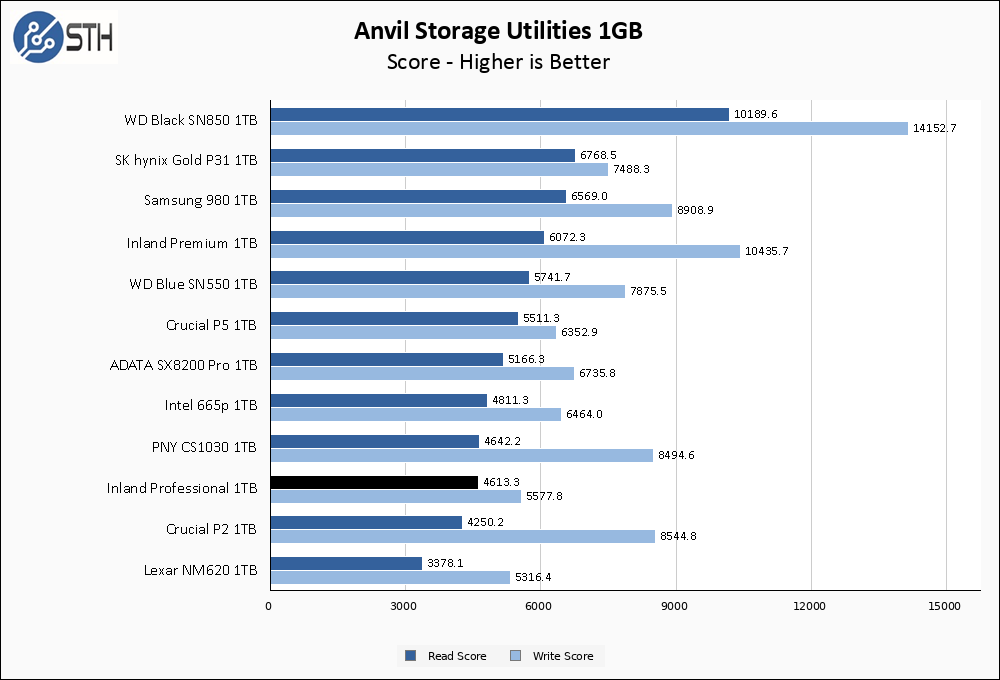
Anvil scores take into account more than just the sequential performance of a drive, and while the Inland Professional 1TB does not exactly excel in Anvil it holds up better than some of its competitors in terms of read performance. Write performance, on the other hand, is trending very close to the bottom of our chart.
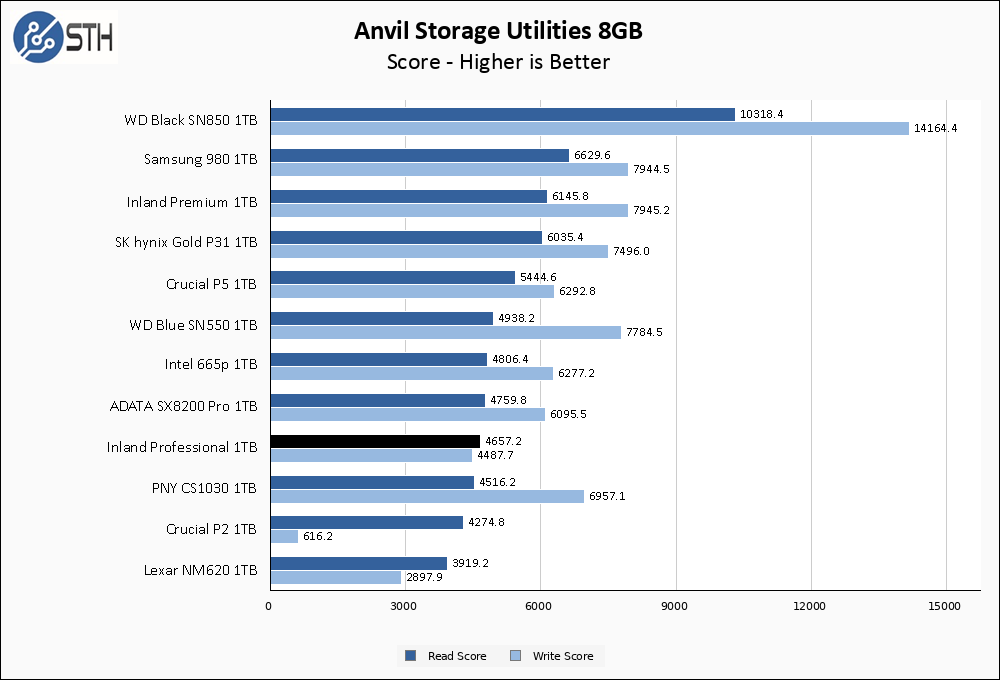
A bit of good news comes in the form of the larger Anvil test, where the Inland Professional 1TB holds its ground better than a few other drives, shrinking both the read and write performance gaps with some of the better performing drives on the chart.
AS SSD Benchmark
AS SSD Benchmark is another good benchmark for testing SSDs. We run all three tests for our series. Like other utilities, it was run with both the default 1GB as well as a larger 10GB test set.
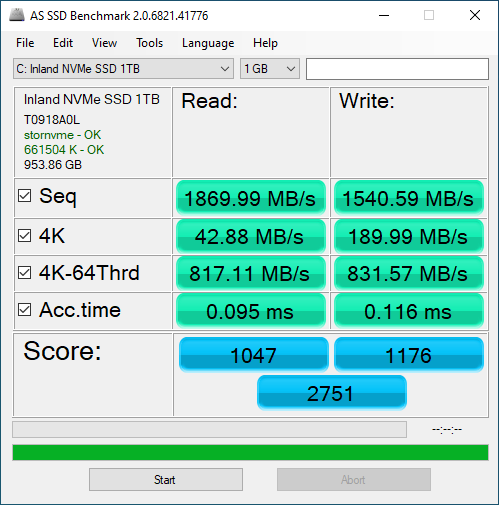
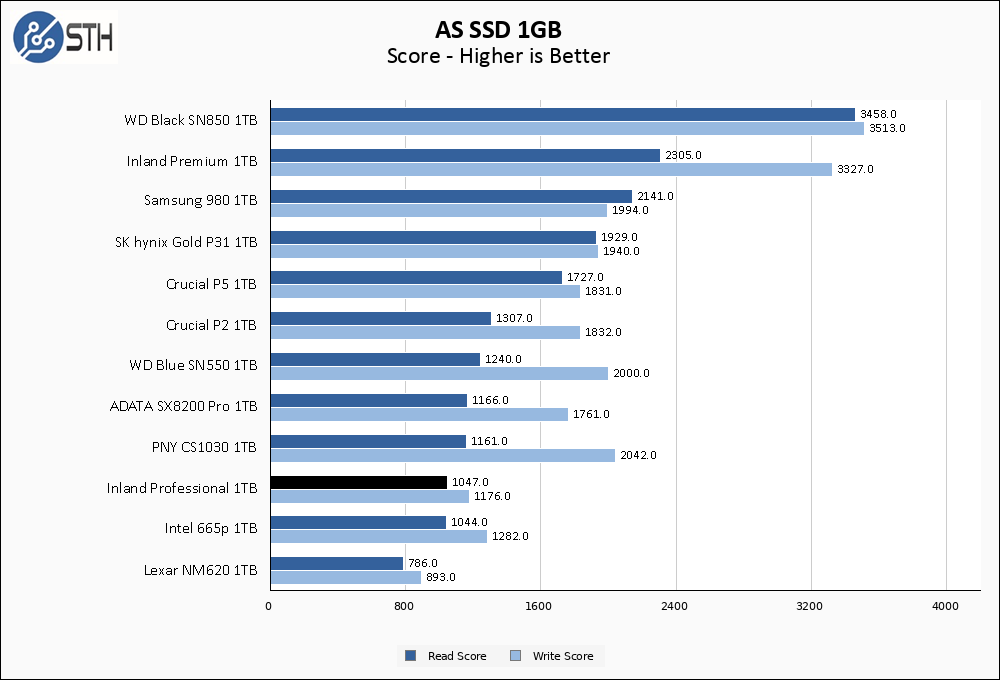
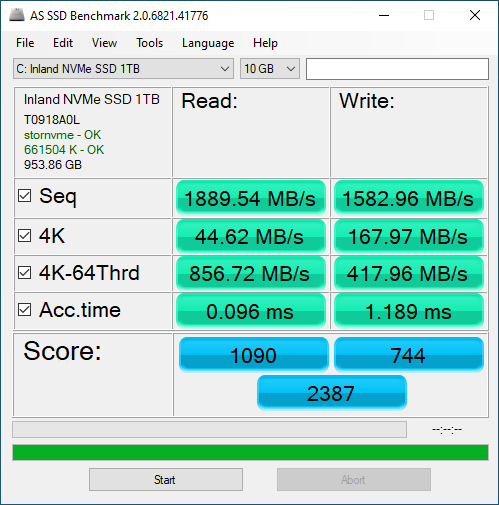
In AS SSD, the Inland Professional 1TB turns near-rated sequential performance numbers and moderate random performance. This combination puts it near the bottom of the graph, but performing ‘as advertised’ is not a negative in my book.
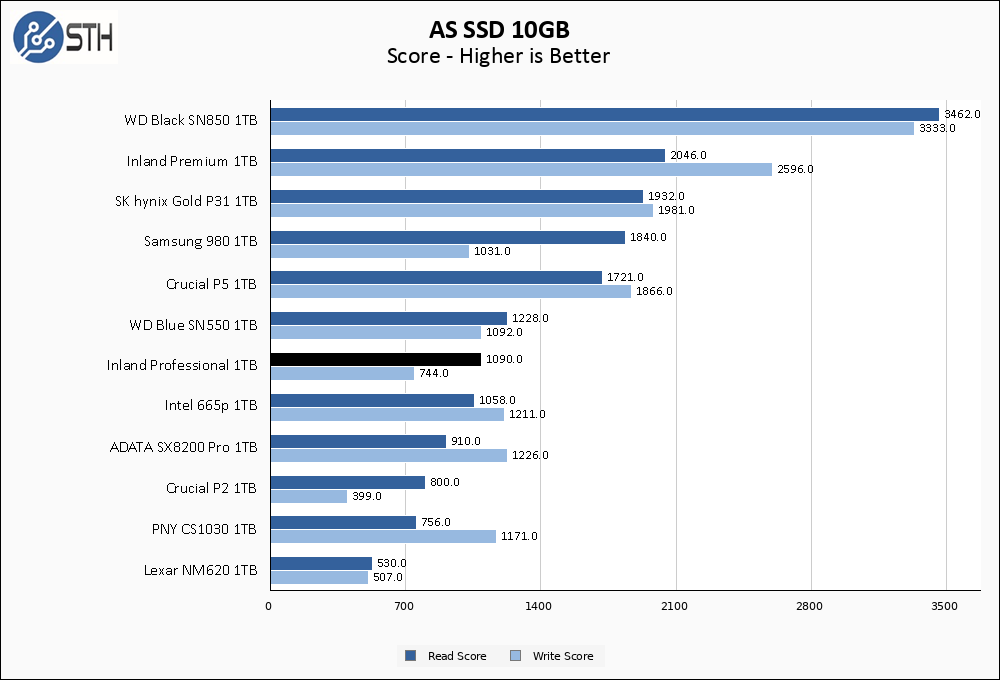
The Inland drive manages to actually improve its read score a bit on the larger AS SSD test, propelling it solidly into the middle of our chart. Write performance does not fare as well, though it still stays out of Crucial P2 and Lexar NM620 territory.
SPECworkstation, direct comparisons, thermals, and our conclusion are up next.


I have issues associating “Inland” with “Professional”. Those 2 words just do no go together for me. Same with “Inland” and “Premium”.
Perhaps it is because I always saw Inland on the shelves at Fry’s with other shelf spots being empty. Maybe the only Inland products I even bought at Fry’s were cables. What could go wrong with a cable, right?
And Fry’s will always be known to me as the place for the “blue tag” specials – the repackaged stuff that others returned and Fry’s probably did not check out very well before rewrapping it and reselling it. I was never into buying other people’s problems.
Comments are closed.