
The Intel Xeon E5-2620 model name has been used to describe a fairly consistent price point over three generations. The Intel Xeon E5-2620 V1 was launched in Q1’12 and is now about three years old. The subsequently released V2 and V3 versions were on Intel’s 22nm process and incorporated the new set of features from the Ivy Bridge-EP then Haswell-EP platforms. Two things have remained relatively consistent: they cost around $400-425 and have 6 cores/ 12 threads and 15MB L3 cache per chip. That makes them an excellent point to do a comparison piece on, so today we have benchmarks of all three.
Test Configurations
Since we are spanning two different sockets we had to use two different test configurations. This included motherboards, and RAM.
LGA2011-1
- CPU: 2x Intel Xeon E5-2620 V1 and V2
- Memory: 8x 8GB Samsung DDR3 RDIMMs (1600)
- Motherboard: Supermicro X9DRH-iF
LGA2011-3
- CPU: 2x Intel Xeon E5-2620 V3
- Memory: 8x 8GB Samsung DDR4 RDIMMs (2133)
- Motherboard: Supermicro X10DRH-i
Common components
- SSD: Intel DC S3500 800GB
- Chassis and PSU: Supermicro SC747TQ-R1620B
- OS: Ubuntu 14.04 LTS
Overall, we kept these configurations as close as possible but both provide a decent platform for testing. This is an update to our original Intel Xeon E5-2620 V2 v V3 article we posted but which used significantly different platforms.
Intel Xeon E5-2620 V1, V2 and V3 Benchmarks
For this test we are utilizing Linux-Bench as our benchmark tool of choice. It runs a number of Linux tests in an automated manner and gives fairly consistent results. The best part is that one can easily run it on their own systems using a LiveCD and three commands per the Linux-Bench How-To. In the interest of space, if you are interested in learning more about the benchmarks you can go to the Linux-Bench Benchmark Info page.
c-ray 1.1
c-ray 1.1 benchmarks are a go-to and scalable test that simulates ray tracing. For higher-end dual-socket configurations we typically look at the medium and hard tests.
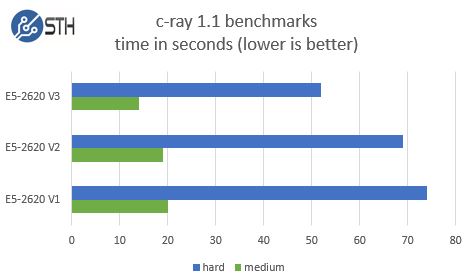
Here we see a steady progression in terms of performance. The E5-2620 V3’s higher clock speeds allow it to excel on this test despite an identical core count.
7-zip Compression
Our 7-zip benchmarks test a common server function: compression.

Again, we see each generation posting solid compression/ decompression speed increases. The compression differential was largest between V1 and V2 while the decompression differential was the largest between V2 and V3.
UnixBench
We look at both UnixBench 5.1.3’s single and multi-threaded dhrystone nad whetstone results (integer and double precision floating point). After doing our normal single threaded and multi-threaded only graphs, we realized the scale was too far off and therefore now have dhrystone and whetstone result sets.
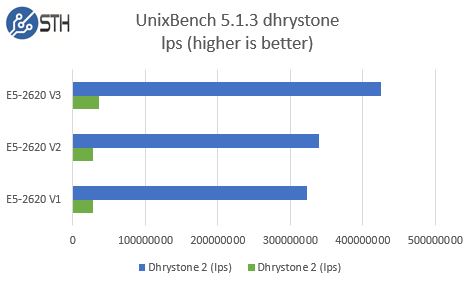
Here we can see the additional clock speed plus the generational improvements for the V3 generation show significant gains. When comparing v1 to v2, the difference is much more muted.
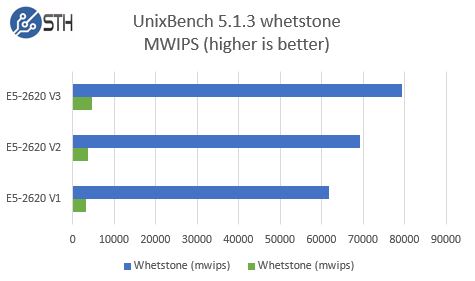
On our whetstone tests we can see a fairly linear progression in terms of generational performance gains. The V1 to V3 jump is large enough that the difference is likely to be similar to adding a core or two to the V1 generation part.
Sysbench CPU
Sysbench is an extremely popular Linux benchmark and we are using the CPU test to compare processors.
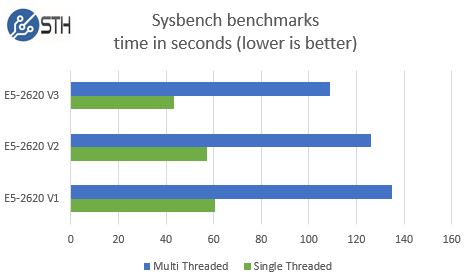
Our Sysbench CPU tests show a relatively small jump from V1 to V2. This is a common theme in many of the benchmarks we have seen thus far.
Power Consumption
We used data from our Extech power meter to do a quick comparison across generations.

We see some fairly dramatic gains between the V1 and V2 generations. The E5-2620 V1 samples were from just around launch in 2012 whereas the V2 samples were from early 2014. What the graph does show is the impact of both Haswell-EP idle power consumption savings as well as the impact of transitioning from V1 on a 32nm process to V2 on the 22nm process.
Conclusion
The bottom line is that there was incremental performance improvement between each generation which is expected. Although the media often focuses on the higher-end parts, the lower-cost E5-2620 line ends up selling a solid volume because of its price point. For owners of the V1 part or V2 part, there is likely little reason to upgrade. From a performance perspective, generally the V1 and V2 were relatively closer in performance with a much larger jump due to clock speeds and IPC improvements in V3. From a power perspective, the biggest jump accompanied the transition between V1 and V2 to the 22nm process. These results are as expected, but are useful as one evaluates different server options in the marketplace. At the end of the day, the E5-2620 is a budget processor that combines significantly more processing power than the Xeon E5-260x parts at a modest price premiums. Systems with the E5-2620 are generally not looking for the highest performance per socket performance and that makes sense in many workloads.


 processors to see performance and power consumption differences.)
nice test…what I missing here is comparison with older XEON X56xx platform for 1366 socket.
Agreed. Test this against the X5690s which can be had on ebay for like 500 or so for the pair.
Seconded. I’d also be interested in the 60w TDP Xeon L5640.
looks like autor of article dont give f.ck :(
+1 for the Westmere comparison with these. One thing i would like to see are cinebench scores.
5 years later and this is still relevant. I’m looking at picking up a cheap quad node box that can’t take v3 or higher chips. Good to get an idea of relative performance.
Comments are closed.