Crucial P2 1TB Performance Testing
We are moving towards using larger test sizes on our benchmarks, but on several tests, we also used the smaller default test sizes. This allows us to see the difference between lighter and heavier workloads.
BlackMagic Disk Speed Test
This is a popular speed test in the video community. It shows whether a storage device is suitable for throughput required at a given video format.
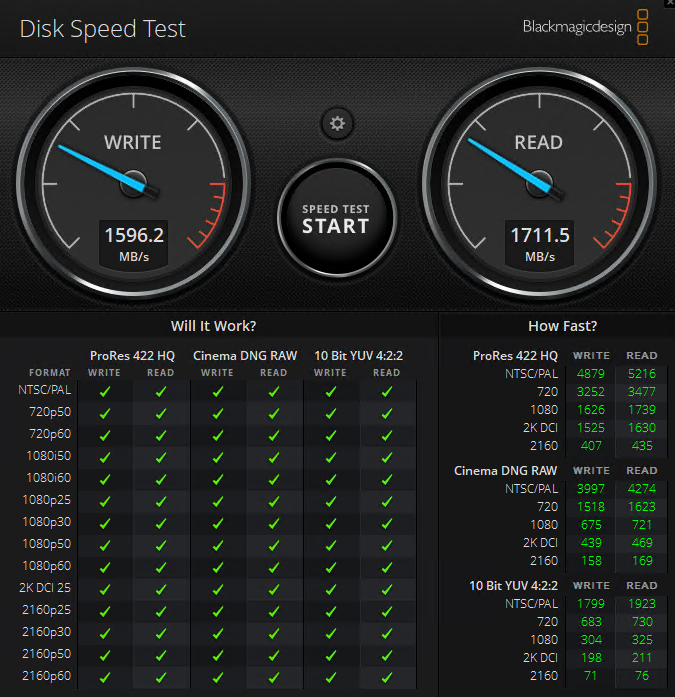
Given the lower rated speeds of the Crucial P2 1TB, we brought this test back out of retirement just to make sure it qualifies. Thankfully the P2 has no issues with any of the tested formats.
CrystalDiskMark 7.0.0 x64
CrystalDiskMark is used as a basic starting point for benchmarks as it is something commonly run by end-users as a sanity check.
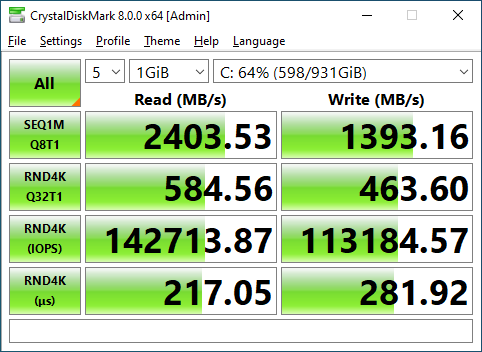

The Crucial P5 1TB was not the top performing drive when we reviewed it, and the value-oriented P2 is even less so. While the P2 manages to match the rated sequential read speed and be in a dead heat with the WD Blue SN550 unit, write speeds fall far below the rated 1800 MB/s.
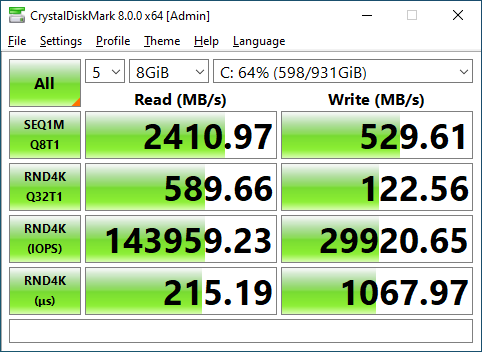
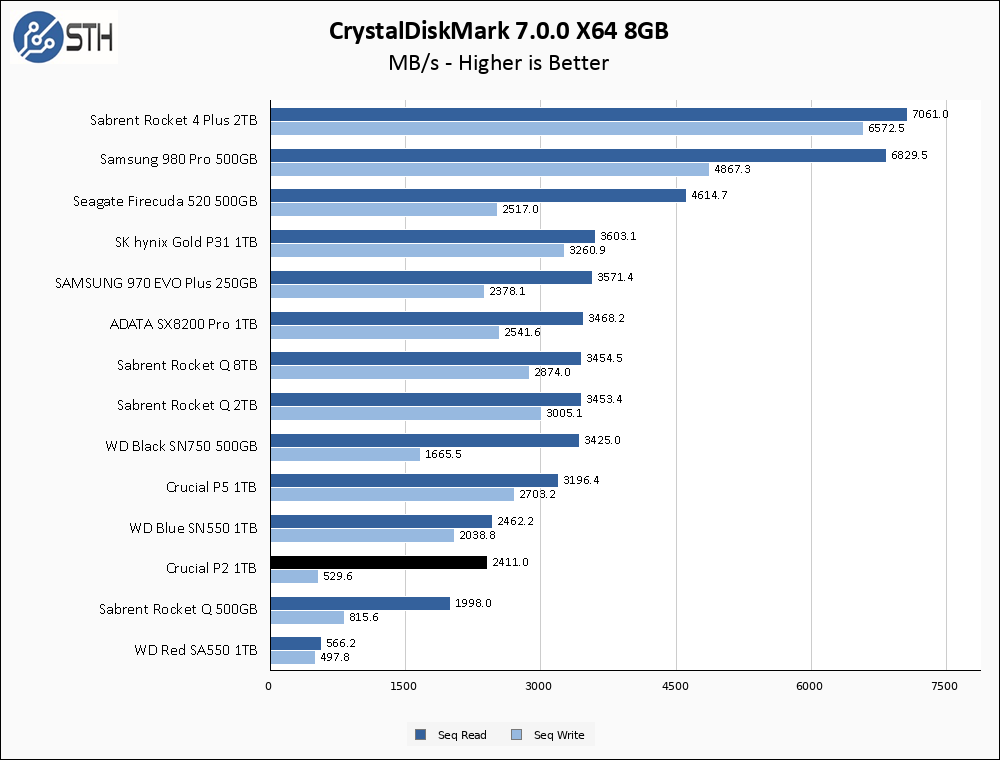
Moving to the larger 8GB benchmark does the P2 no favors. While read speeds hold steady, write speeds take a precipitous drop into what I would consider SATA territory; the WD Red SA550 1TB has been included on our performance charts for a comparison point.
ATTO Disk Benchmark
The ATTO Disk Benchmark has been a staple of drive sequential performance testing for years. ATTO was tested at both 256MB and 8GB file sizes.
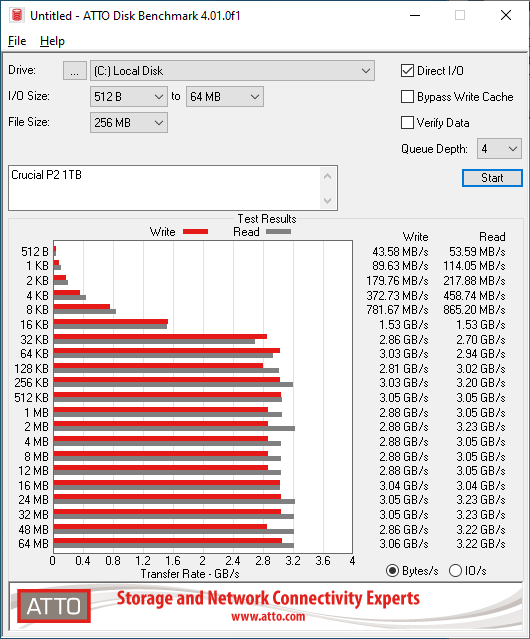
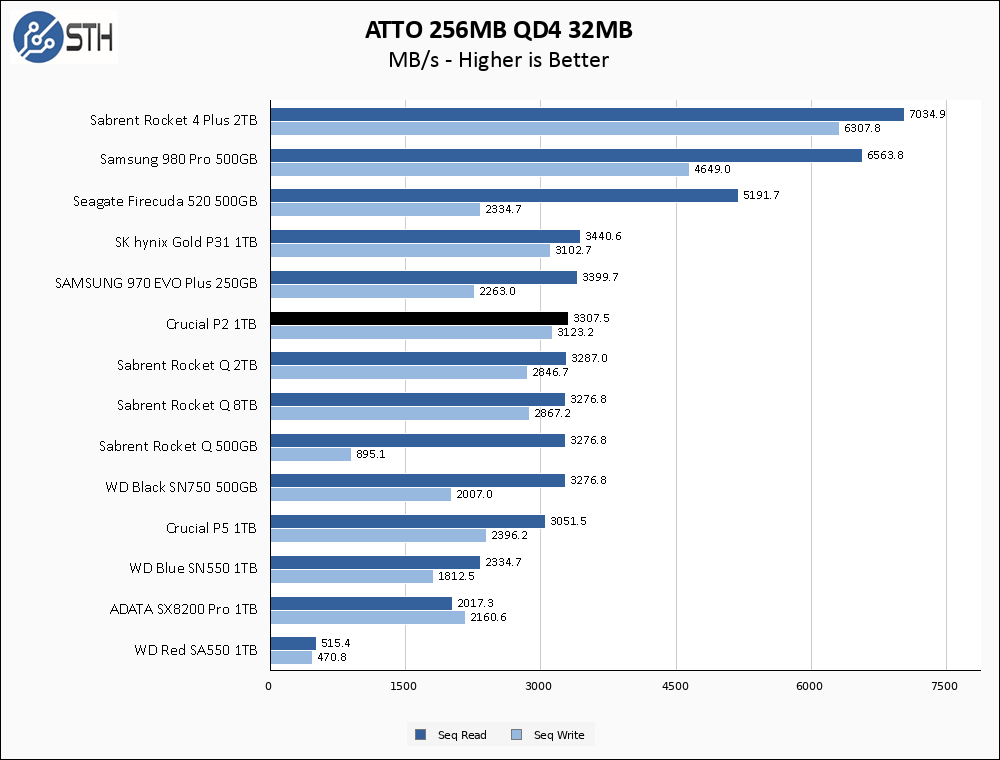
In a reversal of fortunes from CrystalDiskMark, the Crucial P2 1TB overperforms in ATTO. Here it manages to beat the P5, as well as the majority of the other PCIe 3.0 SSDs we have tested.
After some additional research, it has come to light that the anomalously high ATTO test results achieved by the Crucial P2 are the results of a specific interaction between the Phison PS5013-E13 controller and the compressible nature of the ATTO test data. As a consequence, these results should be discarded as they are not representative of any real world performance achievable by the P2.
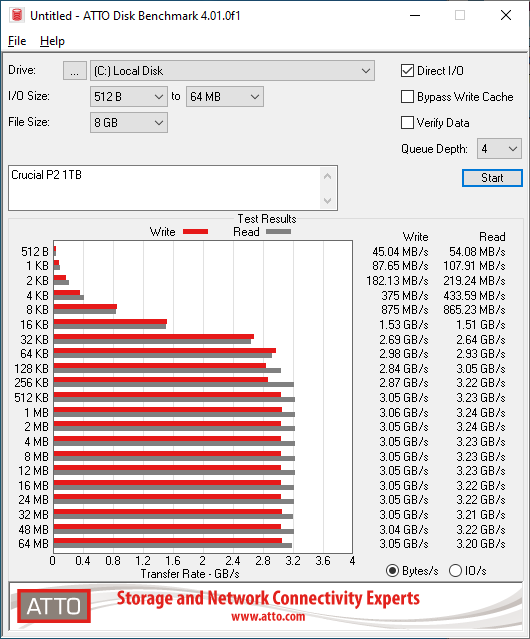

The larger ATTO still favors the Crucial P2 1TB, allowing it to post very good numbers in a dead heat with the top performers in the PCIe 3.0 space.
These results are invalid for the P2; see above.
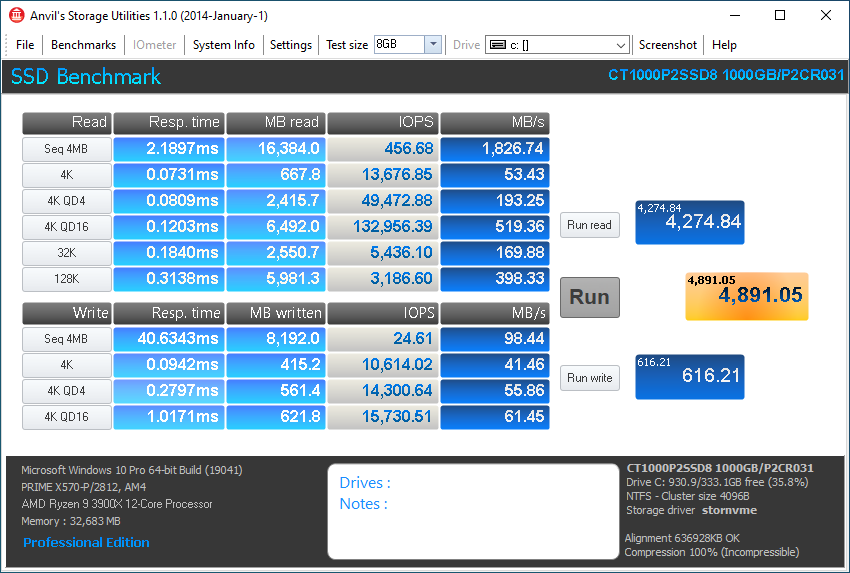
Anvil’s Storage Utilities
Anvil’s Storage Utilities is a comprehensive benchmark that gives us a very in-depth look at the performance of drives tested. This benchmark was run with both a 1GB and 8GB test size.

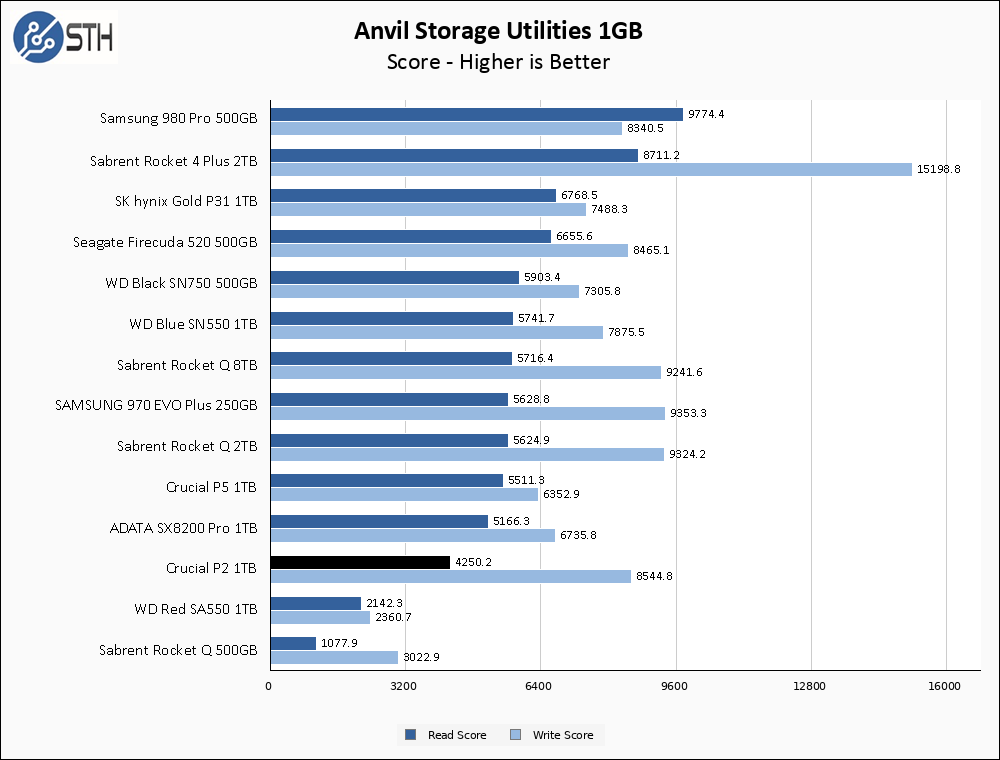
The overperforming of ATTO could not last, and with the move to Anvil the Crucial P2 1TB has returned to the bottom end of our performance charts. Heavily threaded write speeds still remain very strong though, which is likely courtesy of the Phison controller. Thanks to the strong write performance the P2 is very competitive on write score, but the read score leaves something to be desired.
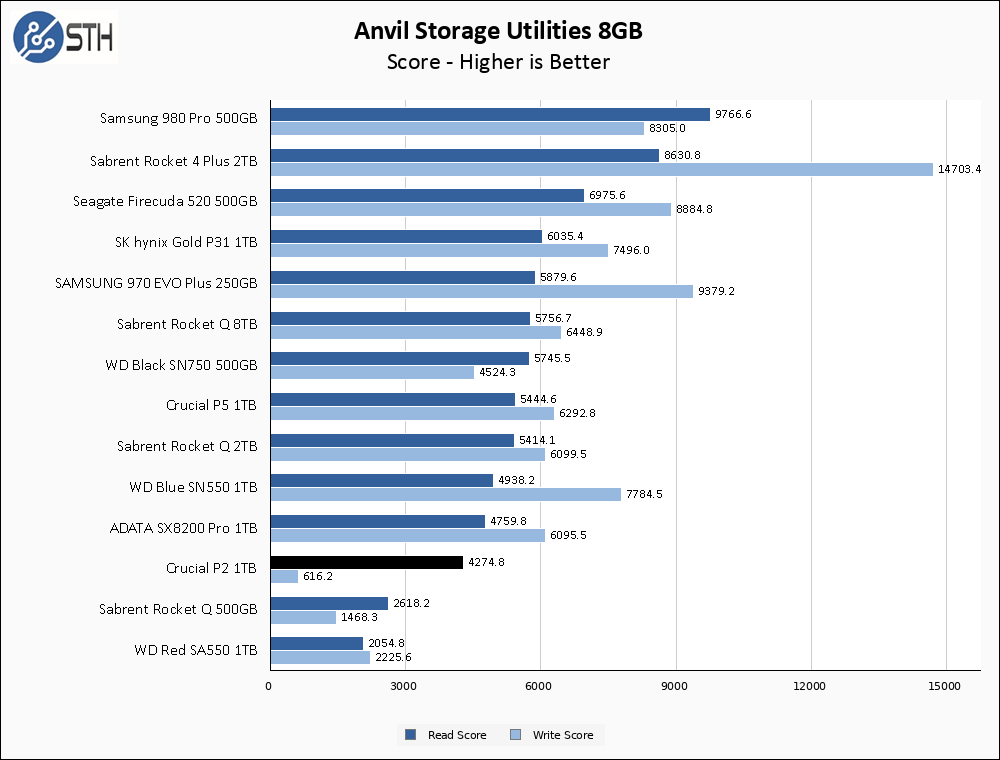
Unfortunately, moving to the much more stressful 8GB test, the Crucial P2 1TB drive suffers a massive drop in write performance. All rated performance metrics for writes drop into the double digits, and the write score is significantly below the SATA-based WD Red SA550 drive.
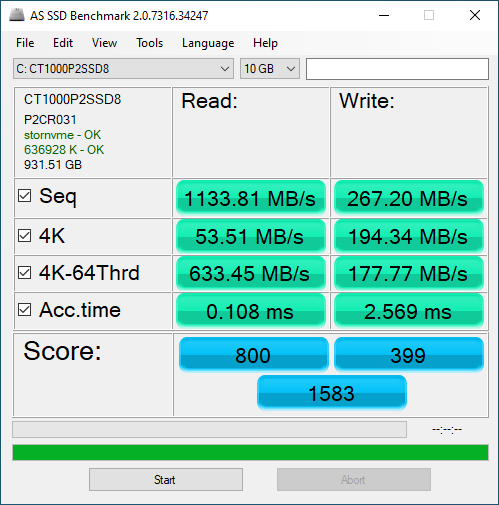
AS SSD Benchmark
AS SSD Benchmark is another good benchmark for testing SSDs. We run all three tests for our series. Like other utilities, it was run with both the default 1GB as well as a larger 10GB test set.
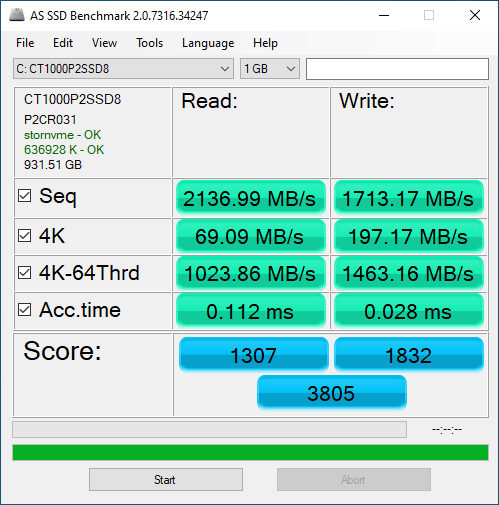
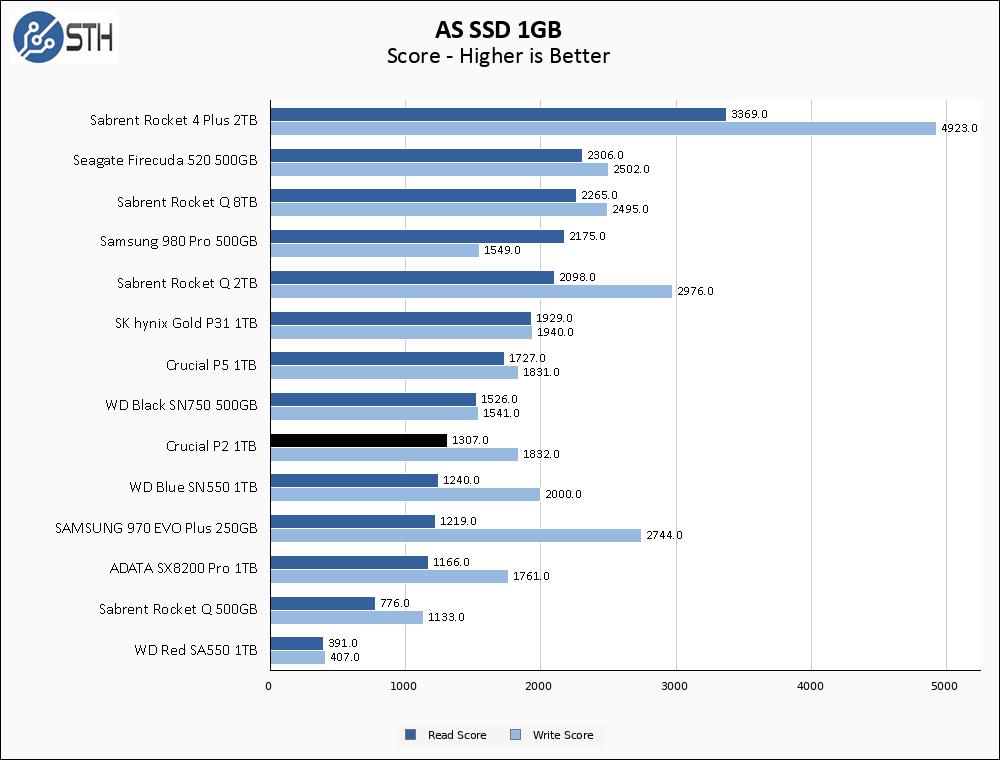
In the 1GB ASSSD test, the Crucial P2 1TB returns to the lower-middle of the pack. It narrowly edges out the WD Blue SN550 1TB in read score, and narrowly loses to it in write score.
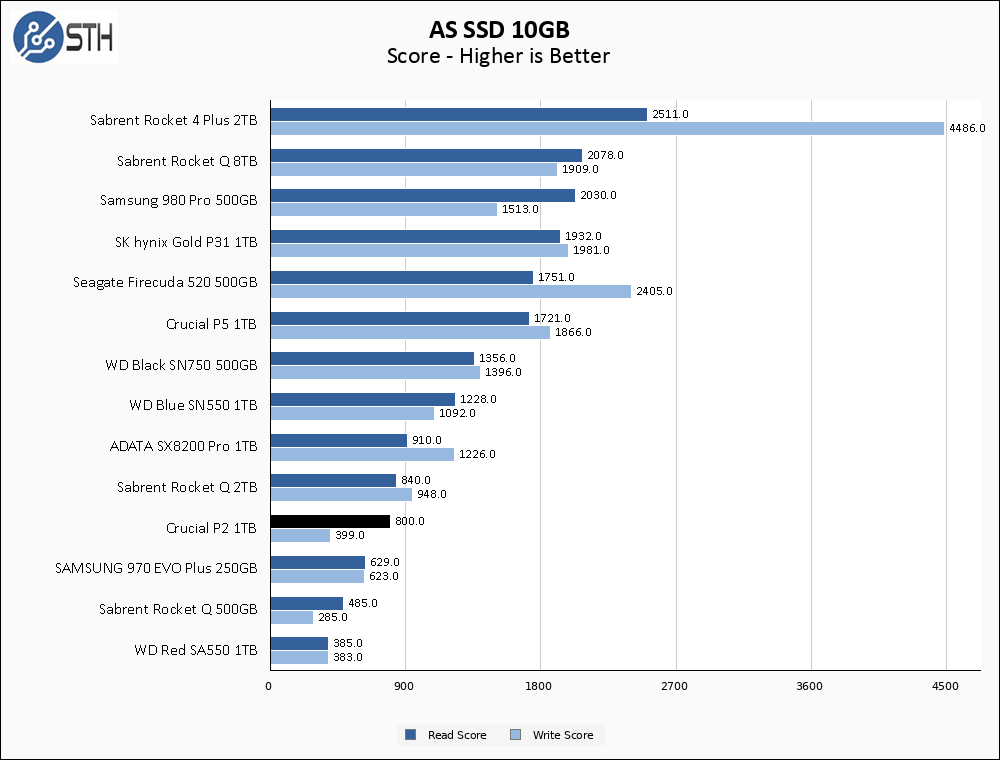
Unfortunately, as has happened in a couple other tests at this point, the larger test set has decimated the performance of the Crucial P2 1TB. In AS SSD’s larger test, both read and writes take a significant hit.
SPECworkstation, thermals, and our conclusion are up next.


i got an idea….why do we not make a chart of the temperatures of all drives like we do for performance testing ?
because in every nvme review we see only the temps of the tested drive, while for tested performance we see many other driver along side with tested drive….just put the temps of other drives with the tested drives…..
i think my point is clear enough what i mean
erik,
My logic is that temperatures aren’t a competition; drives operating at a lower temperature does not correlate to better performance. I don’t want to put multiple drives on a graph, and then say “lower is better” for temperatures, and have someone draw a conclusion that a drive that peaks at 60C is somehow ‘better’ than a drive that peaks at 62C.
The point of the temperature testing is to determine if the drive requires any additional cooling.
@Will.
i am not saying that the temps are effecting the performance. but it is easy to see the temps of different model at a glance as in the performance charts.
when i buy a nvme drive, the temp is important factor in my decision/choice.
“Lower is cooler”
How can it still score an 8 while not being recommended? 8/10 is very good!!
@J
the 7 is the true zero ;-)
DRAMLESS and/or QLC drives make no sense, they are not cheap enough to justify the big performance difference and diminished endurance.
For example, you can usually find the 860 EVO at the same price or even lower than the 860 QVO.
I love that the official spec page incorrectly states TBW as *Total* Bytes Written and rates the 2TB disk as 600 bytes. Total. Not terabytes, 600 total bytes. Guess P/E cycles on QLC is worse than I thought, hah.
@Greg
nice catch. This is so funny!
Why not to turn on QLC into SLC and make another set of test. Because that’s what you get, when installing drivers. Speed different is huge, when activated.
well i’m guessing its still alot faster then an old disc hard drive
what is the software that can tell me the temperature of my nvme ssd. i need one/
what is the software to check the temperature of nvme ssd.
Comments are closed.