Rendering Related Benchmarks
Next, we wanted to test the rendering performance of the card.
Arion v2.5
Arion Benchmark is a standalone render benchmark based on the commercially available Arion render software from RandomControl. The Benchmark is GPU-accelerated using NVIDIA CUDA. However, it is unique in that it can run on both NVIDIA GPUs and CPUs.

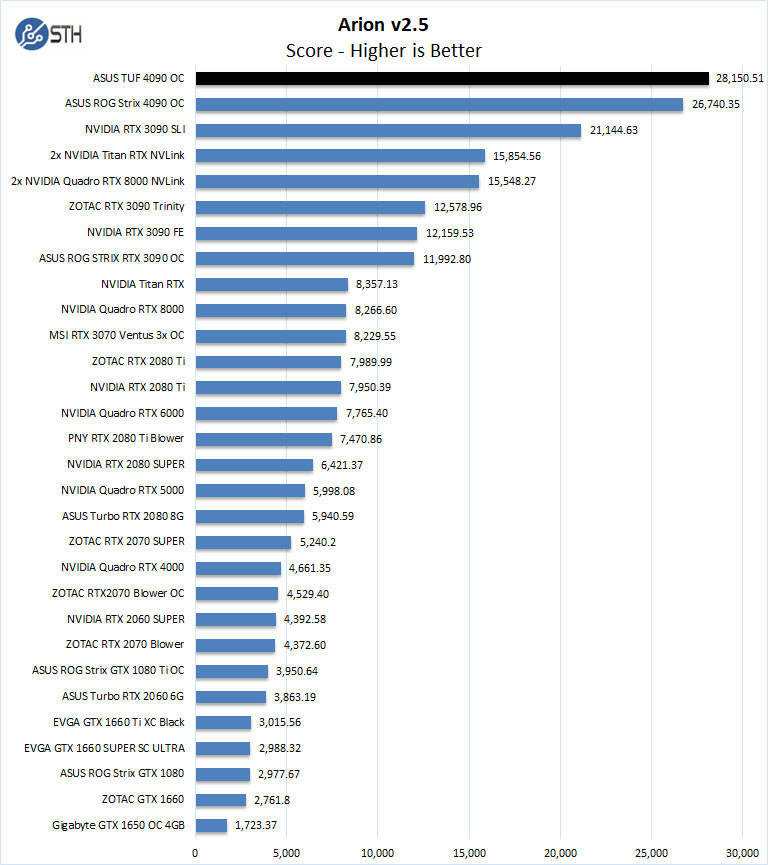
The TUF shows a nice boost in performance in Arion.
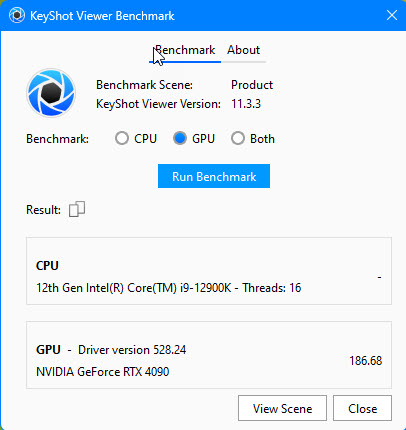
KeyShot
The KeyShot Benchmark is a simple yet powerful tool to test your CPU and/or GPU and evaluate their performance. KeyShot Viewer is a free standalone application for sharing KeyShot scenes for others to view and interact with your visuals.
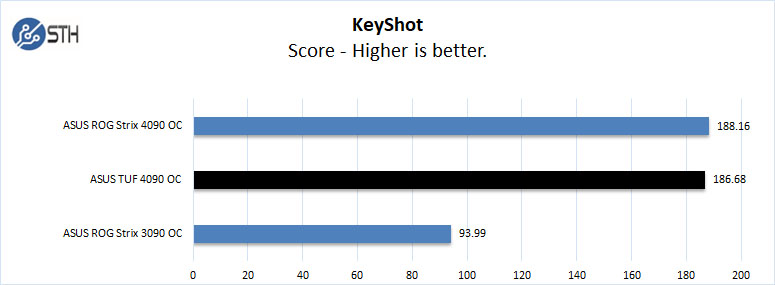
The results are multiples based on render time. Higher scores than 1.0 are better than the reference system. The reference system is an Intel Core i7-6900K CPU @3.20GHz, 2601 Mhz, 8 Core(s). A score of 1.0 matches the speed of the reference system. A score of 2.0 would be double the speed of the reference system.
As we can see, a score of 186.68 is almost double the speed of the reference system. We only used the ASUS TUF 4090 OC in this test. Our Intel Core i9-12900K (8x Performance Cores / 8x Efficient Cores – 16x Threads) generated a score of 2.46. For a total score of 190.62.
OctaneBench
This Benchmark has a new version, and we only have one entry at this time. This will be one that we update with future GPUs as we add them to the data set.
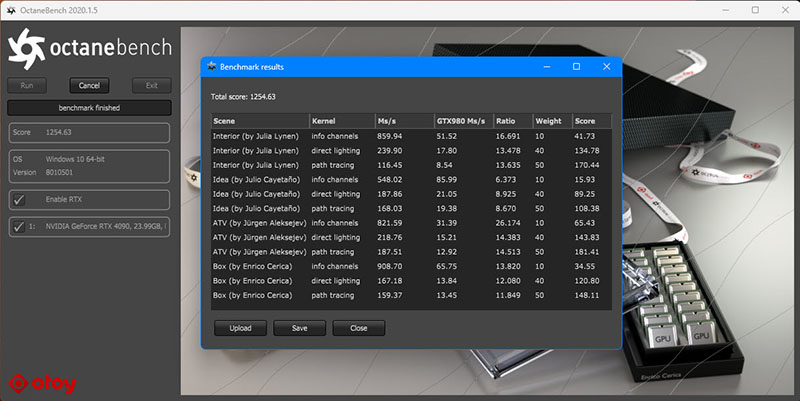
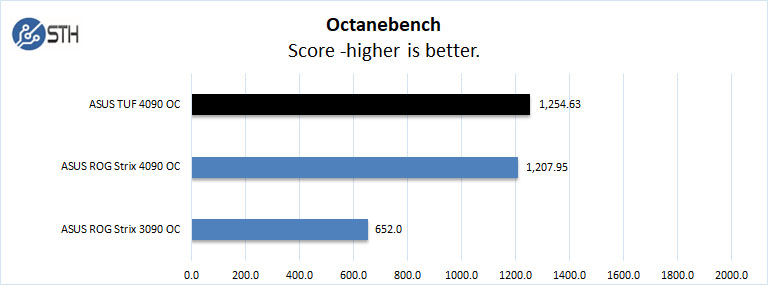
In this Benchmark, the ASUS ROG Strix 4090 OC generated a score of 1,207.95. The TUF was slightly higher at 1,254.63, while a GeForce RTX 3090 came in at 677.12.
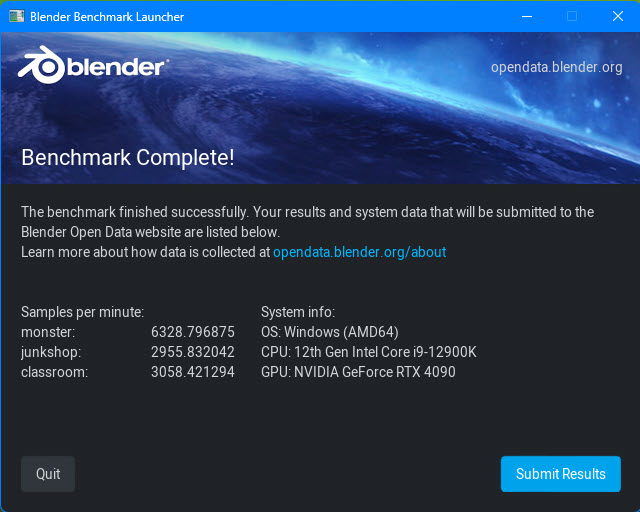
Blender
You can download the Open Data Benchmark from the opendata.blender.org homepage with Windows, Linux, and macOS versions. You can then select any 7 benchmarks (details listed below) to run on your Blender version and render device (CPU / GPU). The Benchmark will also gather non-identifiable data on your system setup, details of which can be found below. Once the Benchmark is complete, you can share your results on Blender Open Data publicly.
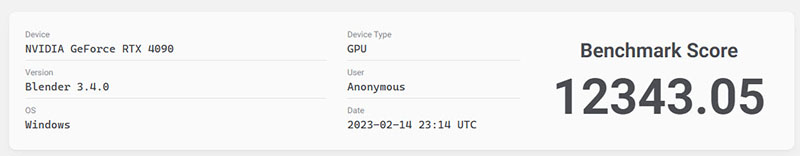
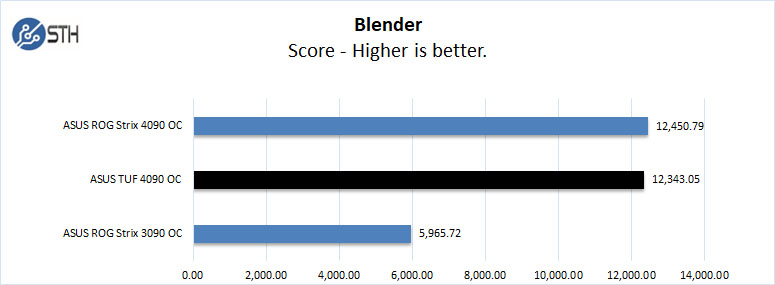
The ASUS ROG Strix 4090 OC showed excellent results and topped the chart with its 12,450 point score vs. the highest recorded at Blender – Open Data at 12,167.93. The results between the TUF and Strix are minimal in Blender.
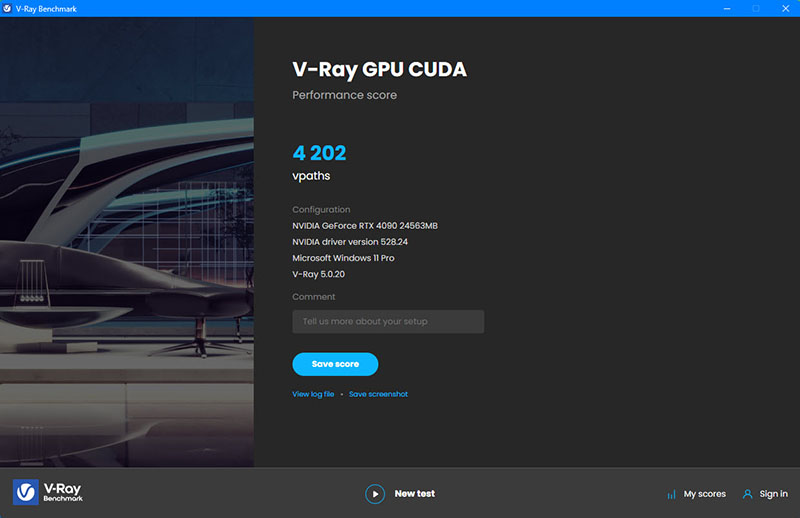
V-Ray
V-Ray does Photorealistic rendering and real-time visualization using CUDA and RTX benchmarks.
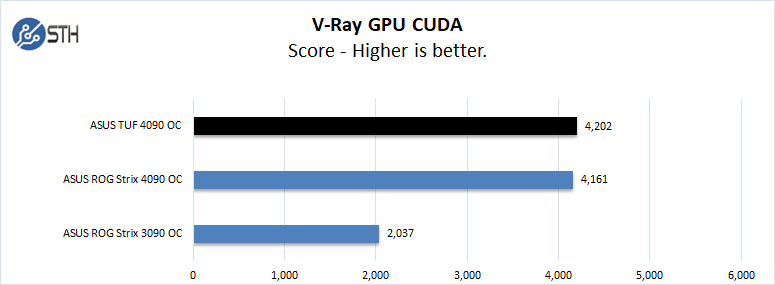
V-Ray GPU CUDA
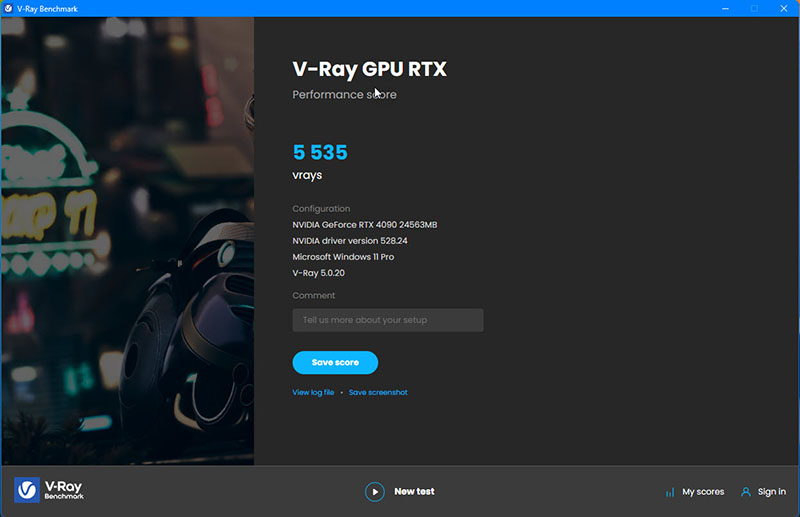
V-Ray GPU RTX
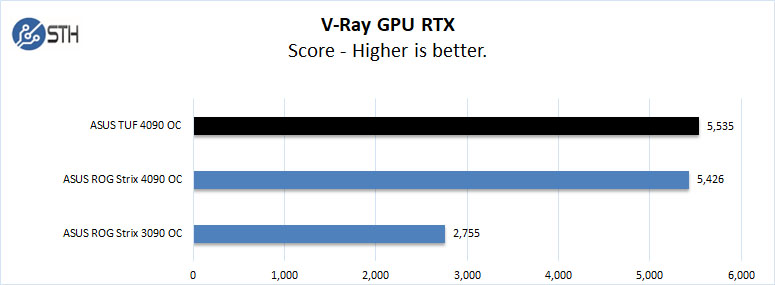
At this time, we only have two GPUs to show results. Again the results show a minimal difference.
UL Procyon
UL Procyon—benchmarks for professional users. Procyon is a new benchmark suite from UL that we’re creating specifically for professional users in industry, enterprise, government, and retail.
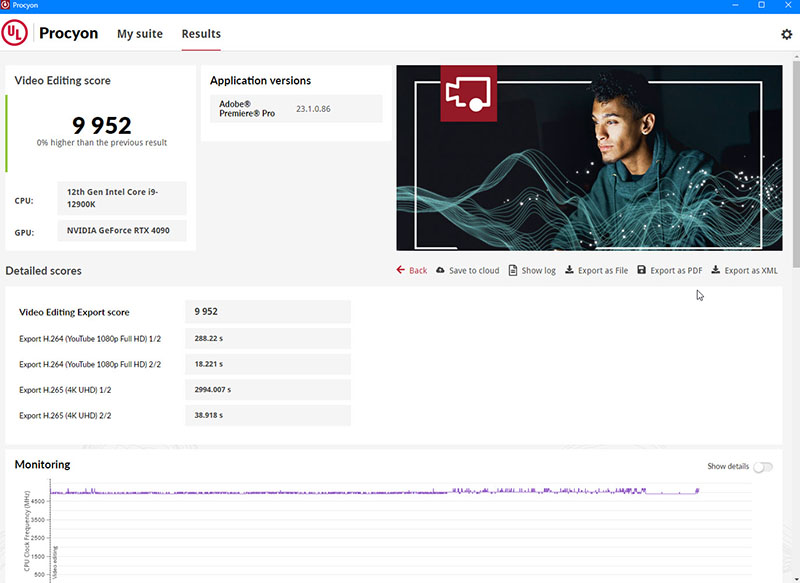
UL Procyon Video Editing
This Benchmark compares the video-editing performance of Windows PCs aimed at creators, enthusiasts, and creative professionals. This test is based on the typical workflow when creating content for online video-sharing platforms.
The Benchmark uses Adobe Premiere Pro to export video project files to common formats. Each video project includes various edits, adjustments, and effects. The benchmark score is based on the time taken to export the videos.
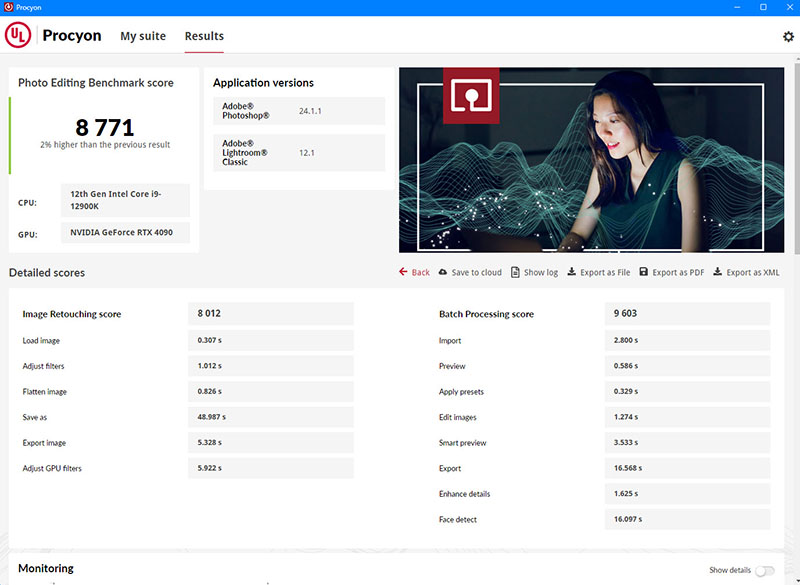
UL Procyon Photo Editing
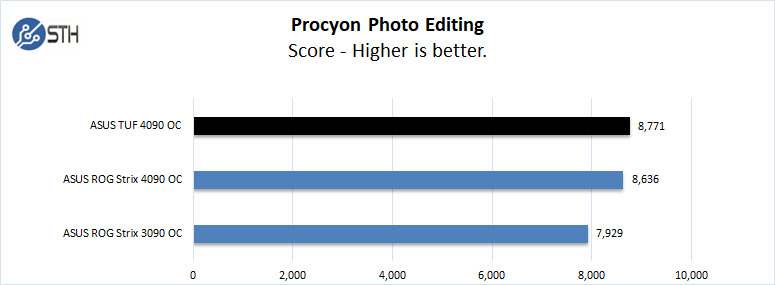
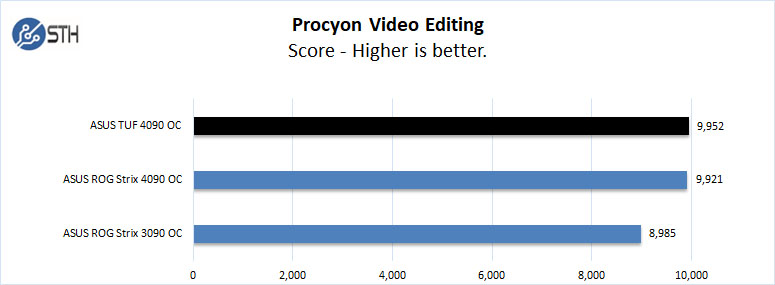
We see only slight differences in our results between the TUF and Strix cards.
Next, we will have Unigine and 3Dmark-related Benchmarks before moving on to power consumption, thermals, and our final thoughts.


Soon the PC form factor will need to change: the mobo will be installed in a slot in the nVidia GPU.
Comments are closed.