AMD EPYC 8005 “Sorano” Performance
For this performance section, we are comparing the AMD EPYC 8635P to the new EPYC 8005, the EPYC 8534P to the previous-generation EPYC 8004, and Intel’s Xeon 6716P-B to the Intel reference. AMD’s new part has 84 cores and a 225W TDP, while the EPYC 8534P has 64 cores at 200W, and the Xeon 6716P-B has 40 P-cores at 235W. That 40-core Xeon is the highest-core-count Xeon 6 SoC we had to test, and the TDP was in a similar range, which is why we are using it here.
LM Bench
LM Bench gives us a quick look at the EPYC 8635P memory latency profile before moving into competitive charts. This result is only for the EPYC 8635P, so it should be treated as a platform characterization chart rather than a direct comparison.
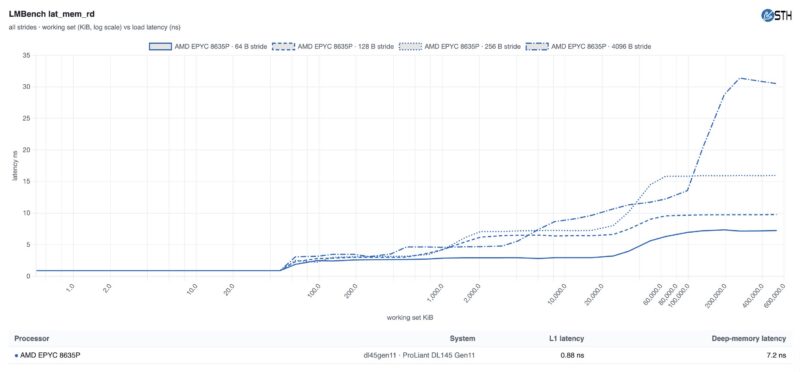
AMD EPYC 8635P shows 0.88ns L1 latency and 7.2ns deep-memory latency in this run. For a dense edge and lower-power server CPU, that gives us a useful baseline for the rest of the testing.
Core-to-Core Latency
Core-to-core latency is where the EPYC 8635P, EPYC 8534P, and Xeon 6716P-B can be compared directly. AMD’s new 84-core part has a much lower minimum latency than the Xeon 6716P-B, while the median result lands very close to both the prior EPYC 8534P and the Intel part.
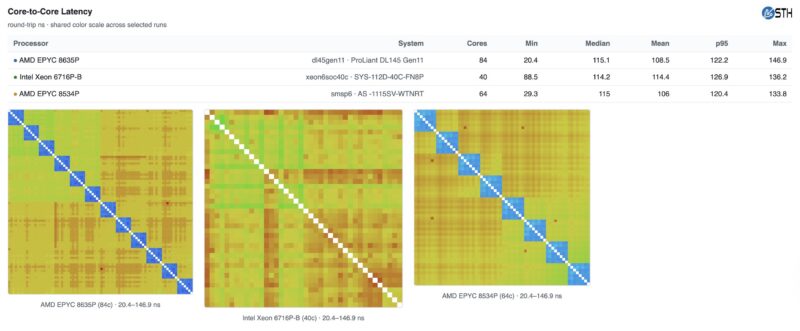
EPYC 8635P lands at a 20.4ns minimum, 115.1ns median, and 122.2ns p95. Xeon 6716P-B is at 88.5ns minimum, 114.2ns median, and 126.9ns p95, while EPYC 8534P shows 29.3ns minimum, 115ns median, and 120.4ns p95. Said another way, the newer EPYC 8005 part adds cores without turning the median core-to-core result into an outlier.
AgentSTH V7 Agentic AI Performance View
We are now collecting data using our AgentSTH V7. The concept was simple. Over the past few years, we have been discussing with folks in the industry that running one workload across a CPU is not as realistic on today’s large multi-core CPUs. Instead, the dominant use case was running multiple workflows across a chip. As agentic AI workflows took off, we worked with a few of the industry’s performance enthusiasts to profile what agentic workloads look like in terms of tools and call types, along with relative weights for how often they occur. Then it was time to run it on a bunch of hardware to see if we had made sense and if we could perceive the measurable differences. Currently, this takes around a day to complete a single run on a single CPU system. The results viewer is still not great, so apologies that the colors are going to shift a bit between charts. That is an action item to fix. Still, let us get to it.
AgentSTH V7 single-core testing is useful because it shows how the newer EPYC 8005 Zen 5 cores behave before the extra core count enters the picture versus the older Zen 4c designs. The AMD EPYC 8635P leads this group, with EPYC 8125P very close behind and the Xeon 6716P-B ahead of the older EPYC 8534P.
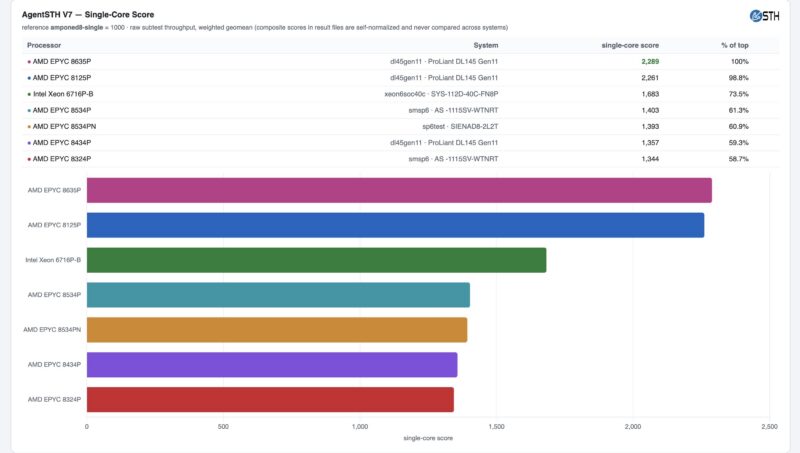
In the single-core performance results, the AMD EPYC 8005 series performs extremely well. The Intel Xeon 6716P-B reaches 1,683 sits between the Zen 4c AMD EPYC 8004 series parts, which are all tightly grouped.
Breaking the AgentSTH V7 result into dimensions shows where that single-core advantage is coming from. EPYC 8635P is ahead in throughput, coordination, and memory versus both the EPYC 8534P and Xeon 6716P-B in this chart.
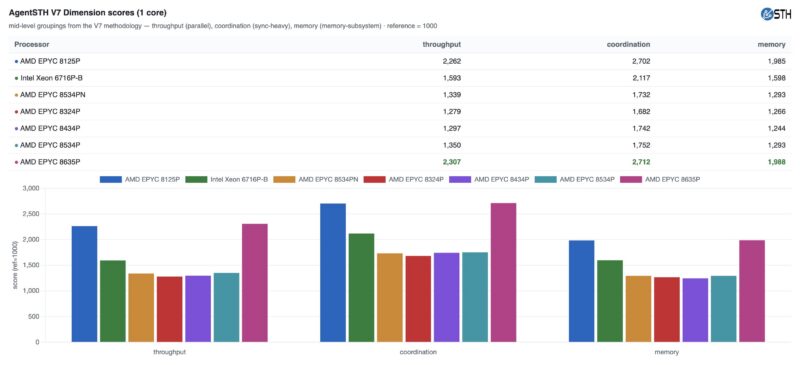
Just a bit of background here, the throughput is what most folks would expect in terms of what architectural factors influence the performance. The Coordination portion is actually negatively impacted by the number of cores/ threads you are running on, as well as chiplet boundaries, since those tests are often spreading work out to all available cores/ threads and then aggregating results. The Memory portion is those that were profiled and have an outsized impact on memory bandwidth, but we are omitting straight STREAM-style testing here. Vendors all use STREAM, and it is largely academic. Still, when we profiled this on systems from small to large, some of the functions we found AI agents doing were highly influenced by memory bandwidth.
Scaling charts need a little care, since this one is showing speedup versus each CPU’s own one-core result. It is not an absolute performance chart. This is the result at a given core count over the single-core result for each CPU.
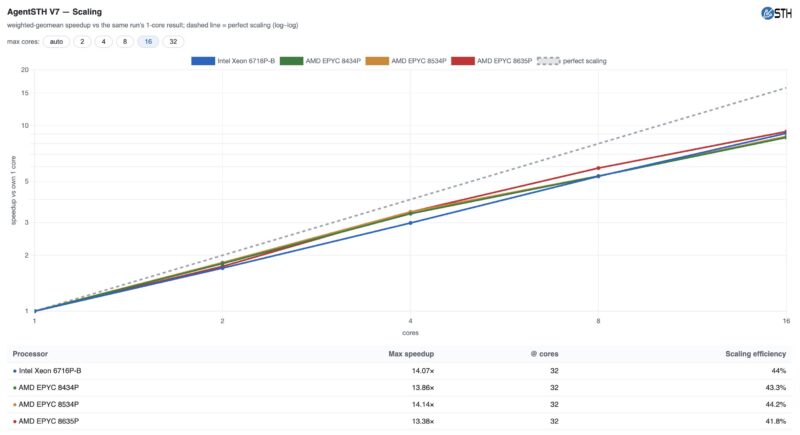
Here, we capped the chart at 16 cores just because we wanted results you could read. The 8-core result was a standout for the EPYC 8635P. As a note for other segments, this was actually an interesting one since if you have heterogeneous cores in the design, you have scaling of P cores, E cores, (potentially LP E-cores), and then need to choose how you will pick the base to show scaling.
Multi-agent efficiency is another way to look at how the CPUs handle partitioned work. This chart is more about split behavior than a simple winner-take-all bar chart. The idea behind this is fairly simple. What if you need to run X agentic workflows on a CPU rather than being constrained by the number of cores? An important way to look at this is how loading a CPU impacts the performance. We expect the performance of a single workflow to decrease as the number of simultaneous workflows increases. To be fair, this is also one we are likely going to change the visualization on over time.
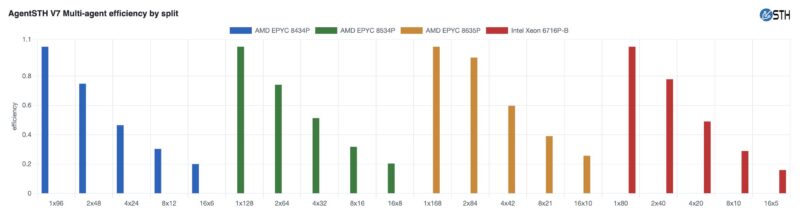
Interestingly, here, we did not profile on the EPYC 8005 series, since that was a chip that arrived after we reached AgentSTH V7. Still, the EPYC 8635P scaling from 1×168 to 2×84 was exceptional. The AMD EPYC 8635P is able to handle more agents while maintaining performance, which is a neat finding.
There is still a bit of work to do on a viewer for results. Frankly, we are now generating huge amounts of data. Similar to the network side, with our new IxNetwork and CyPerf testing, generating data is one part that I think we have covered. How we present the data is what we are working on now.
SPEC CPU2026 Estimates
SPEC CPU2026 estimates are unofficial STH estimates here, using LLVM 22 with -O3, Ubuntu 26.04 LTS and non-reportable SPECrate base results. These should not be directly compared to what you see on the official SPEC results. Those often involve custom compilers and highly optimized system setups and compiler flags. This is more of the least common denominator level of results using open source compilers and lower levels of system and compiler flag tuning. Treat these more as STH-to-STH results set rather than an STH to official results set. With that said, Integer rate is the first view.
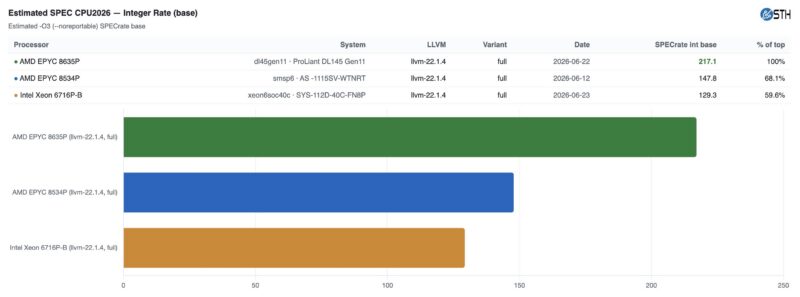
We might expect that the AMD EPYC 8534P would do well here versus the Intel Xeon 6716P-B just given core counts. Across these charts, EPYC 8005 looks like a meaningful step up from EPYC 8004 for this class of platform, with the 84-core EPYC 8635P also providing AMD a strong comparison point against Intel’s Xeon 6716P-B. To be fair, the AMD EPYC 8635P has over twice the number of cores as Intel’s Xeon 6716P-B, but it has a 10W lower TDP. AMD has more I/O, but Intel has more acceleration and NIC IP built in.
Floating point rate shows a similar pattern, again using unofficial STH estimates rather than reportable submissions.
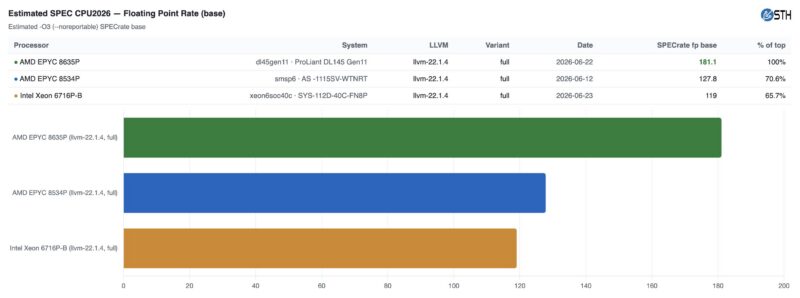
Core count helps, but the result also aligns with the stronger single-core AgentSTH V7 performance seen in the EPYC 8005 part. This workload can cause high power consumption, so the TDP is certainly a limit. Ideally, we would be testing against the 6776P-B, Intel’s 72-core Granite Rapids-D, but we did not have that part to test, and there is a 100W TDP gap between the two platforms.
Geekbench 5 Generational Top-bin Performance
Just comparing top-bin to top-bin, Geekbench 5 shows a fairly massive performance improvement:
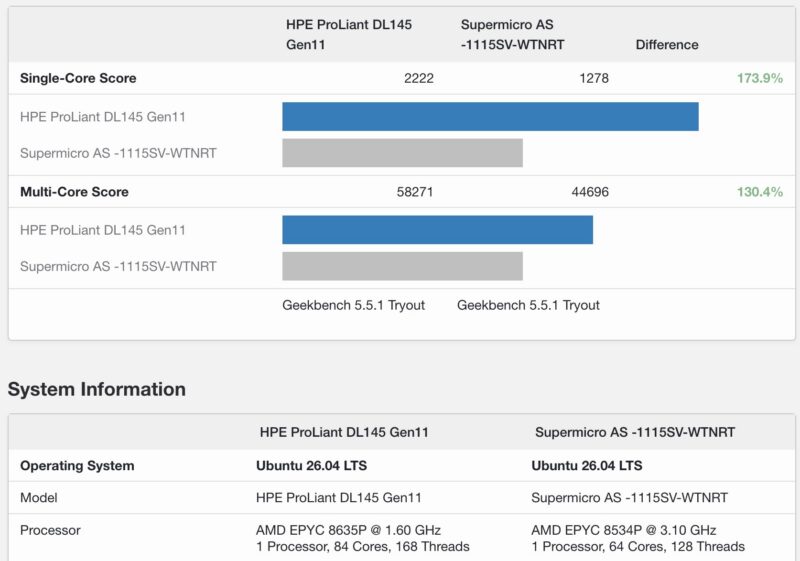
Seeing 30.4% more multi-core performance with 31.25% more cores is quite great scaling when we are only getting 12.5% more CPU TDP. The single-core performance uplift is borderline crazy. Still, if you want a quick and dirty performance comparison to what you have, this might be useful for folks.
Next, let us get to the key lessons learned.


