5th Gen Intel Xeon Emerald Rapids Performance
We wanted to run the new 5th Gen Intel Xeon Emerald Rapids parts through the same gauntlet we have run other server CPUs through to see how it performed.
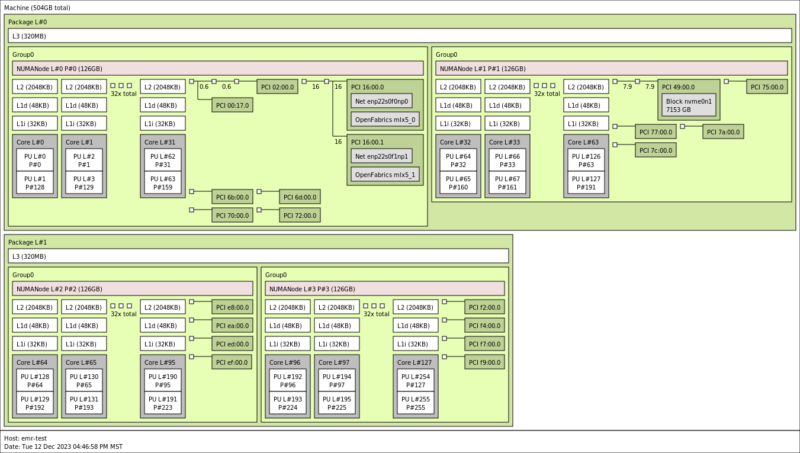
Perhaps one of the biggest changes to the platform is the addition of a big L3 cache, as can be seen above, with 320MB per package. In the previous generation Intel Xeon Platinum 8490H with 60 cores, we only got 112.5MB of L3 cache.
While the TDP is not making big generational jumps, and the cores are effectively the same design, Intel is no longer cache-poor on its higher-end parts that have big caches. At the lower-end with parts that we did not have, there is still a huge L3 cache size delta.
Python Linux 4.4.2 Kernel Compile Benchmark
This is one of the most requested benchmarks for STH over the past few years. The task was simple: we had a standard configuration file, the Linux 4.4.2 kernel from kernel.org, and made the standard auto-generated configuration utilizing every thread in the system. We are expressing results in terms of compiles per hour to make the results easier to read.
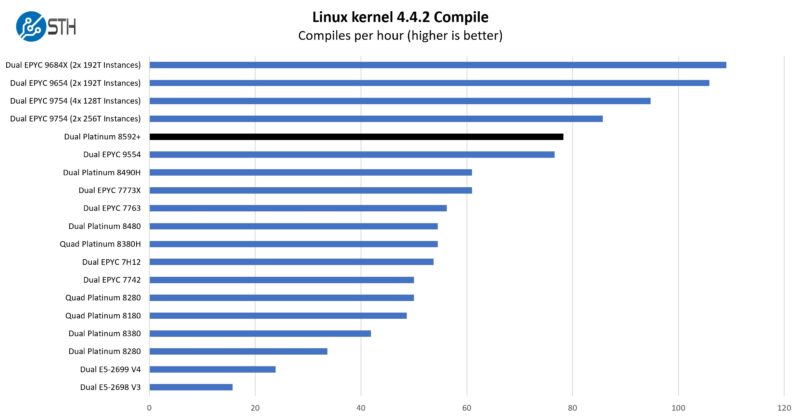
More cores and more cache really help Intel a lot here. Intel can now get into a core-for-core shootout with AMD and get some small victories. Of course, AMD has bigger parts, but on this test, at 256 threads total, we are at the edge of where we need to split the test up into multiple instances to have it run efficiently. Next year, we will be splitting into instances by default.
c-ray 1.1 Performance
We have been using c-ray for our performance testing for years now. It is a ray tracing benchmark that is extremely popular for showing differences in processors under multi-threaded workloads. Here are the 8K results:
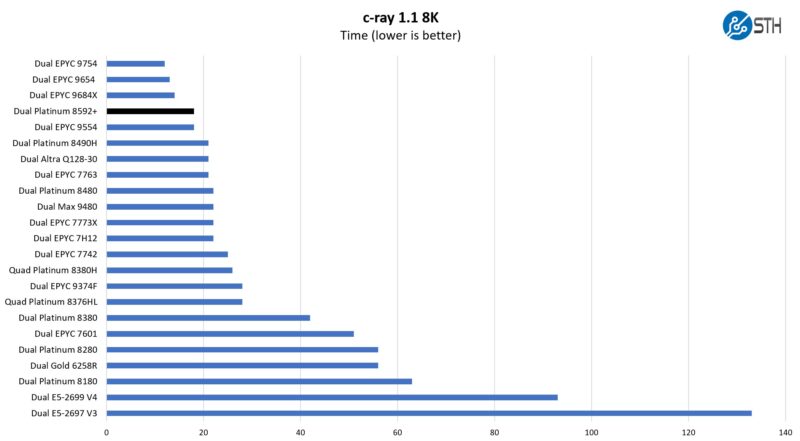
Here the Intel and AMD figures are very close. AMD’s chips have been in the market longer, but Intel is now much more competitive.
7-zip Compression Performance
7-zip is a widely used compression/ decompression program that works cross-platform. We started using the program during our early days with Windows testing. It is now part of Linux-Bench. We are using our legacy runs here to show scaling even without hitting accelerators.
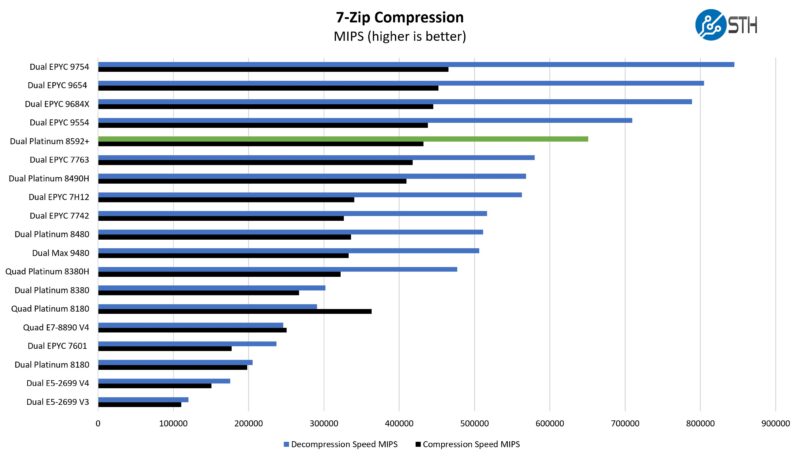
Again, simply adding more cores is really helping Intel. Our sense has always been that the Platinum 8490H was more of an exotic part at 60 cores because scaling did not always go how we would expect. AMD does well here, but AMD typically does well on this test.
Here again, though, Intel would point to its QAT acceleration for SKUs that have it enabled for compression workloads. We are just going to suggest that you check out Hands-on Benchmarking with Intel Sapphire Rapids Xeon Accelerators for more on features like QAT and AMX.
SPEC CPU2017 Results
SPEC CPU2017 is perhaps the most widely known and used benchmark in server RFPs. We do our own SPEC CPU2017 testing, and our results are usually a few percentage points lower than what OEMs submit as official results. It is a consistent ~5% just because of all of the optimization work OEMs do for these important benchmarks. This is a bit different than a normal launch since OEMs have already published performance numbers, so it feels right to use the official numbers if we are talking about a benchmark.
First, we are going to show the most commonly used enterprise and cloud benchmark, SPEC CPU2017’s integer rate performance.
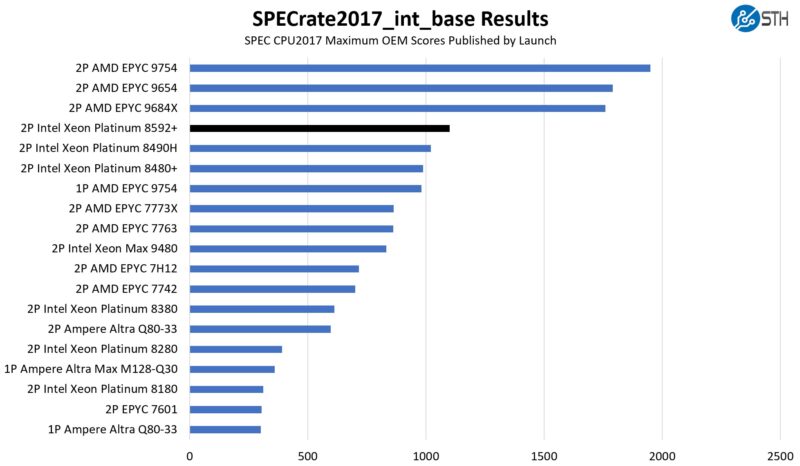
SPEC CPU2017 does not rely as much on the larger L3 cache. It also does not use accelerators. As a result, we get performance that is certainly better than the Platinum 8490H, but not a game-changing difference.
On the floating point side here are the figures:
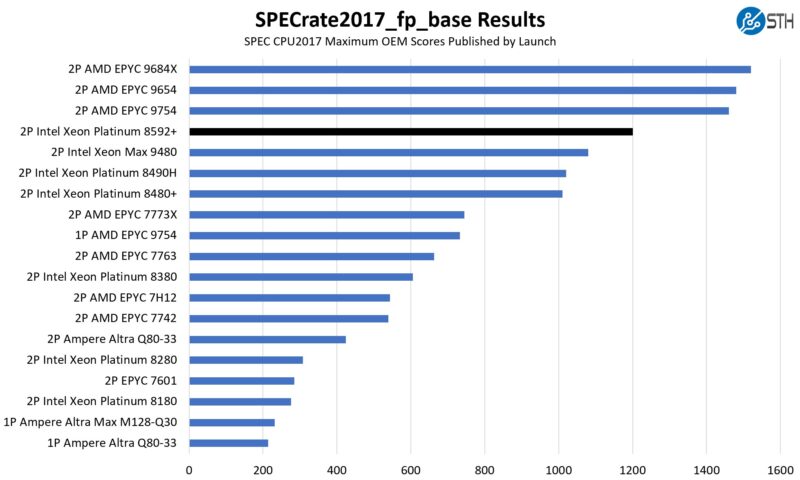
Intel has a bit more separation in this test. What is perhaps more interesting to many folks is just how close Intel is getting to AMD’s 96-core and 128-core parts. The AMD EPYC 9754 is a Bergamo 128 core part. With double the core count, AMD is only 22% faster. Many (e.g. most of the current Arm server contingent) would argue either is too much as the CPU market bifurcates into performance and cloud-native segments.
These figures matter because they are common RFP metrics. Companies use these figures and their per-core license costs to determine not just AMD versus Intel but also the number of cores they target for their deployments.
Still, CPU2017’s rate metrics are looking at scaling microbenchmarks across all cores. Modern high-core count CPUs sometimes do this, but often, the more important metric is the performance of the parts running workloads with multiple components or running multi-tenant diverse workloads.
STH nginx CDN Performance
On the nginx CDN test, we are using an old snapshot and access patterns from the STH website, with DRAM caching disabled, to show what the performance looks like fetching data from disks. This requires low latency nginx operation but an additional step of low-latency I/O access, which makes it interesting at a server level. Here is a quick look at the distribution:
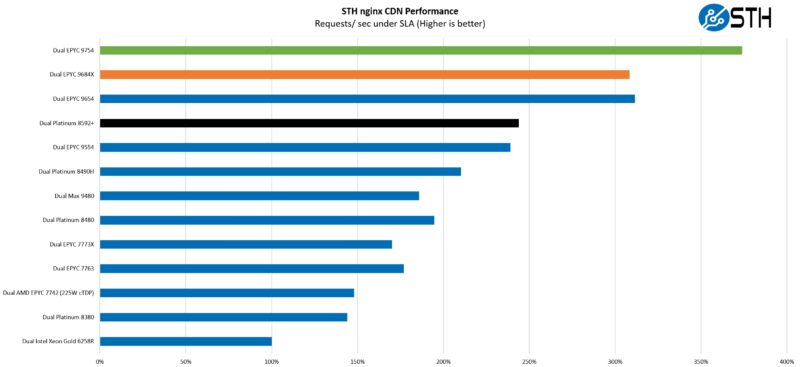
Here, we get some really nice performance from Emerald Rapids. We should point out a few things, however. First, this is a workload that is moving to the cloud-native processor segment. That is AMD EPYC Bergamo and also Arm-based processor solutions. Next year for Intel that will be Sierra Forest. Still, let us face it, there are many organizations that run web servers on whatever is their standard virtualization platform. More cache is good here, and it shows.
What we are not doing is the TLS stack with the Intel QAT acceleration. Technically this part has a single QAT accelerator, not multiple, so keep that in mind.
MariaDB Pricing Analytics
This is a very interesting one for me personally. The origin of this test is that we have a workload that runs deal management pricing analytics on a set of data that has been anonymized from a major data center OEM. The application effectively looks for pricing trends across product lines, regions, and channels to determine good deal/ bad deal guidance based on market trends to inform real-time BOM configurations. If this seems very specific, the big difference between this and something deployed at a major vendor is the data we are using. This is the kind of application that has moved to AI inference methodologies, but it is a great real-world example of something a business may run in the cloud.
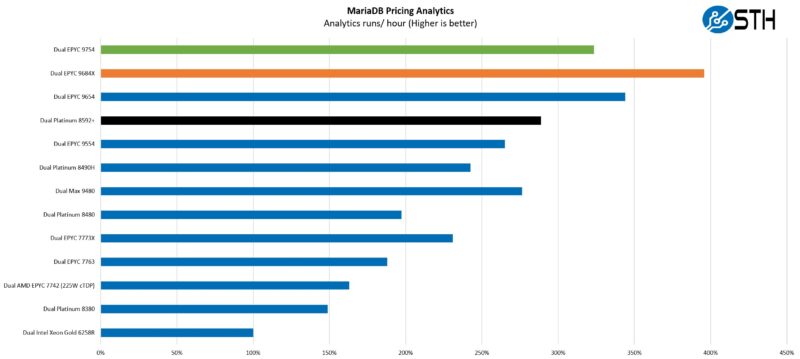
This is really interesting because the 56-core Intel Xeon MAX SKUs do well here. Despite having faster DDR5 memory and 8 more cores in the newer CPU generation, we still see the Intel Xeon MAX is holding its own.
Intel’s positioning is really that this is a drop-in upgrade for new server deployments, but there is no suggestion of pulling 4th Gen CPUs for in-place upgrades.
STH STFB KVM Virtualization Testing
One of the other workloads we wanted to share is from one of our DemoEval customers. We have permission to publish the results, but the application itself being tested is closed source. This is a KVM virtualization-based workload where our client is testing how many VMs it can have online at a given time while completing work under the target SLA. Each VM is a self-contained worker. This is very akin to a VMware VMark in terms of what it is doing, just using KVM to be more general.
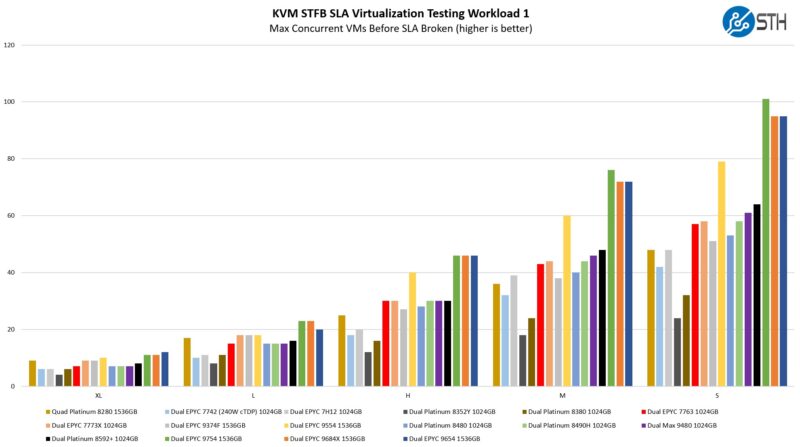
Here AMD will look at lot better on some of these tests, but with good reason. In DRAM capacity-constrained scenarios, doing one DIMM per channel for a socket to get the maximum speed means that AMD gets more memory capacity. Using 64GB DIMMs, AMD gets 1.5TB of memory in a dual-socket server (two 12-channel CPUs), while Intel gets only 1TB (two 8-channel CPUs.) When we get to the larger size VMs, Intel is doing very well with its new 5th Gen Intel Xeon Platinum 8592+ versus the 4th Gen Platinum 8490H.
5th Gen Intel Xeon Emerald Rapids Power Consumption
One area that Intel has focused on with the new chips is lower idle power consumption. To say that Sapphire Rapids (4th Gen Xeon) chugged power at idle would be an understatement. Intel says its new servers can see a ~100W per socket power savings at idle.
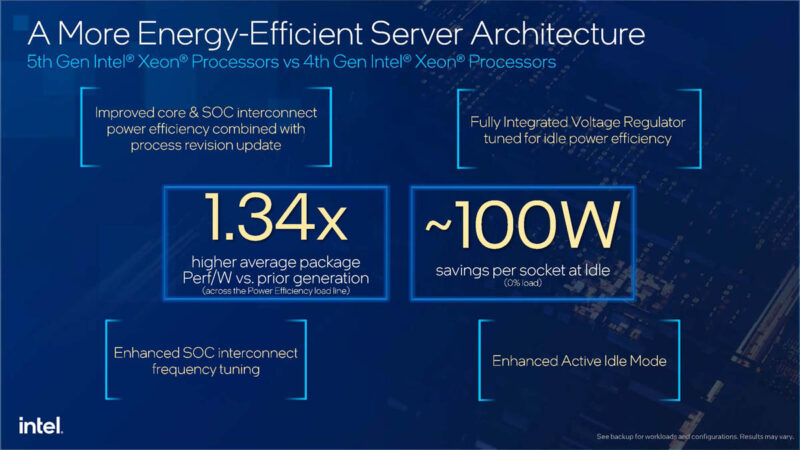
We asked Intel’s architects about this. It is largely being driven by the change from the four-package solution to the two-package one.
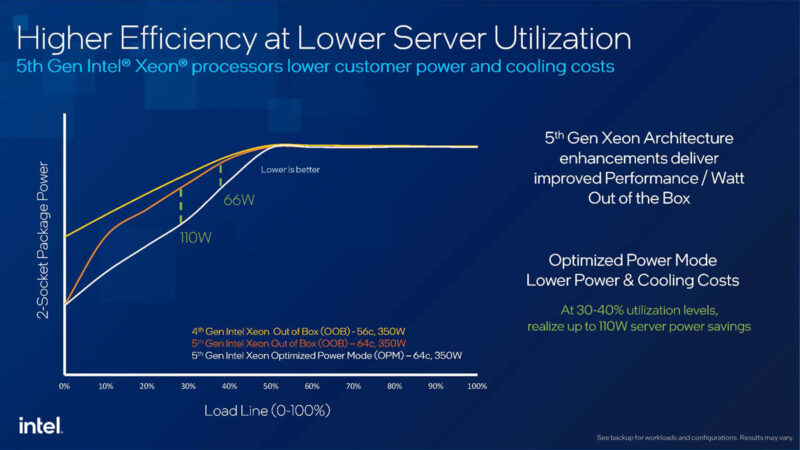
In our testing, we could see top-end power consumption on a dual-socket 1U server of 900W-1kW, a similar range to top-end SKUs of the previous generation. At idle, we did not quite see a 200W idle power consumption savings. Instead, it was more in the 160-180W range. Still, that meant our 5th Gen Xeon test configuration was idling around 155-160W, whereas a 2nd Gen configuration was around half that. Then again, buying a $30,000+ server to have it sit idle is probably not the ideal use of capital.
Next, let us discuss the market impact as we wrap up the piece.


