WD Blue 1TB Performance Testing
We test using both the default smaller test size and larger test sets on our benchmarks. This allows us to see the difference between lighter and heavier workloads.
CrystalDiskMark x64
CrystalDiskMark is used as a basic starting point for benchmarks as it is something commonly run by end-users as a sanity check.
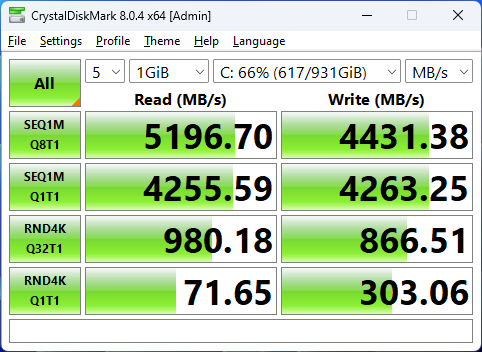
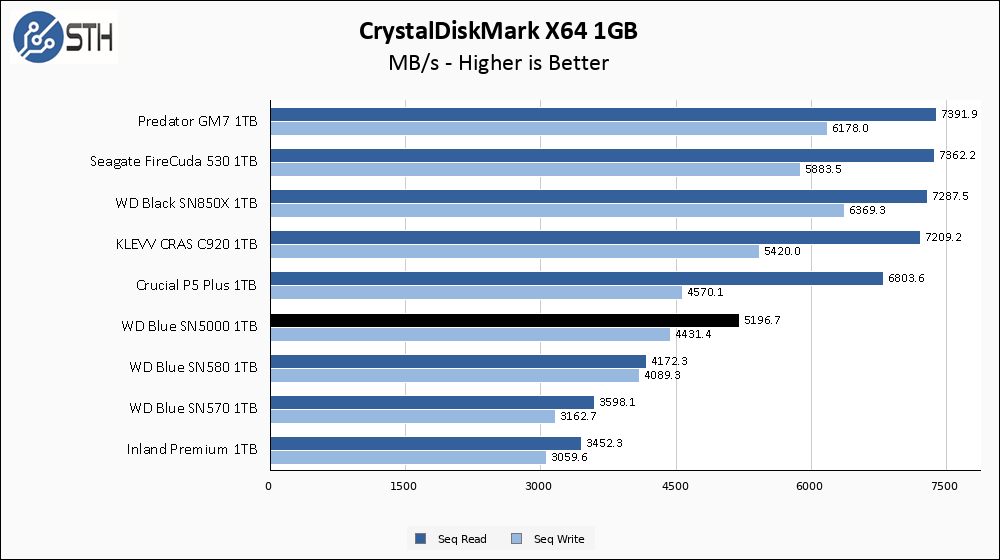
For sequential read performance, the WD Blue 1TB set its target at 5150 MB/s read and nailed it. The write performance target was 4900 MB/s, and unfortunately my testing shows the SN5000 falling a step short. I often basically forgive drives that get really close to their stated performance numbers, but I would say coming in nearly 10% slower than the advertised speed is not a good look. With that said, both numbers manage to beat the SN580, which is the immediate predecessor to this drive.
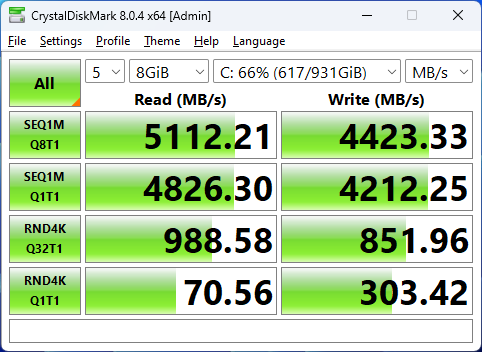

The larger CrystalDiskMark has the SN5000 turning in nearly identical results. This means once again that read scores get a pass, and write scores come in just below what I would deem acceptable. The lead on the SN580 is maintained, which is good.
ATTO Disk Benchmark
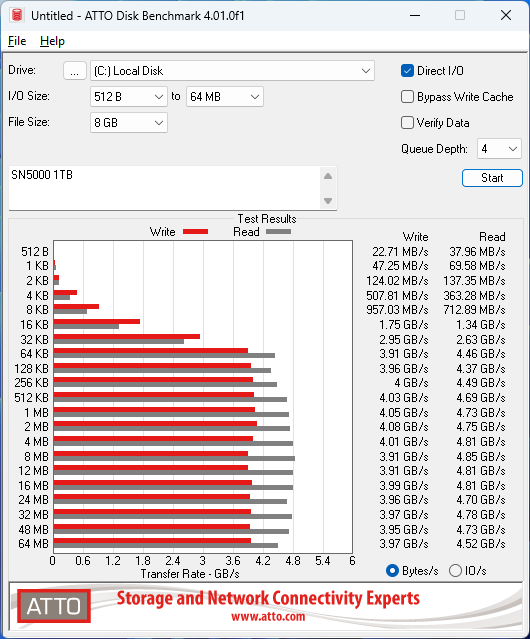
The ATTO Disk Benchmark has been a staple of drive sequential performance testing for years. ATTO was tested at both 256MB and 8GB file sizes.
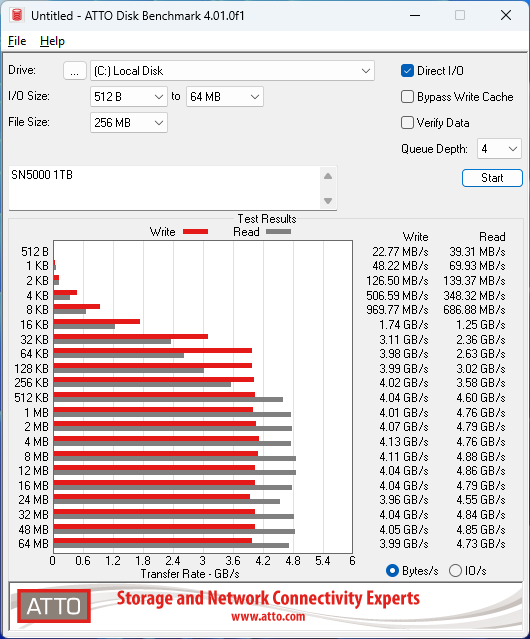
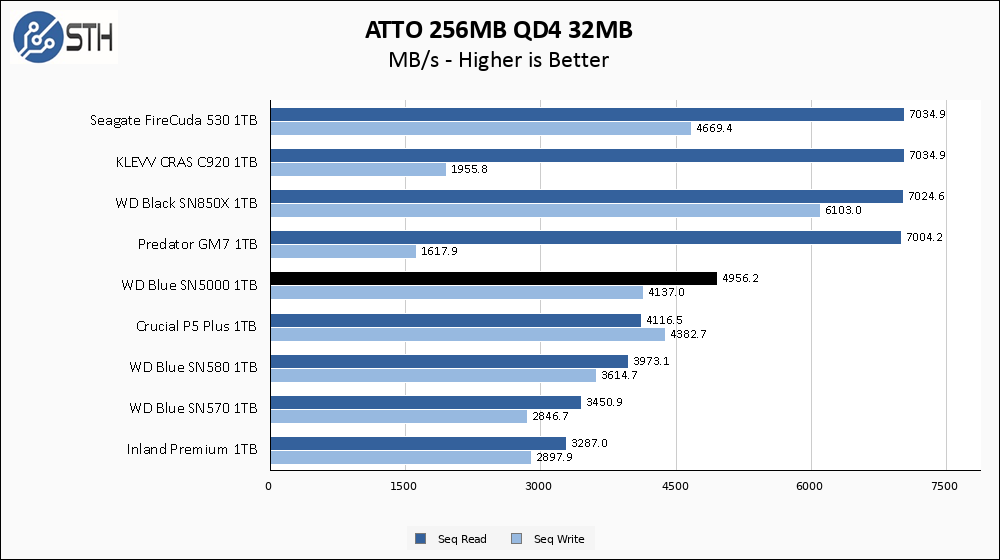
ATTO sequential results are pretty consistent across the board, and the WD Blue SN5000 turns in performance very similar to CrystalDiskMark. It manages to slightly outpace the Crucial P5 Plus in read performance, and maintains its advantage over the SN580 by a small margin.
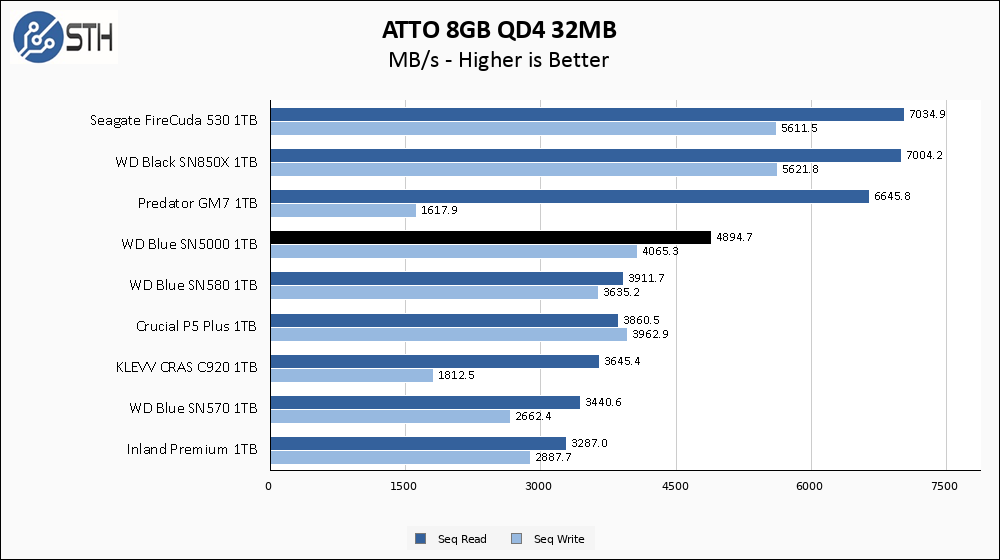
The larger ATTO test shows very consistent performance across the test, which is always something I appreciate. Relative performance on the chart has improved as well, with the SN5000 now holding a lead over the KLEVV C920 and the P5 Plus.
Anvil’s Storage Utilities
Anvil’s Storage Utilities is a comprehensive benchmark that gives us a very in-depth look at the performance of the drives tested. This benchmark was run with both a 1GB and 8GB test size.
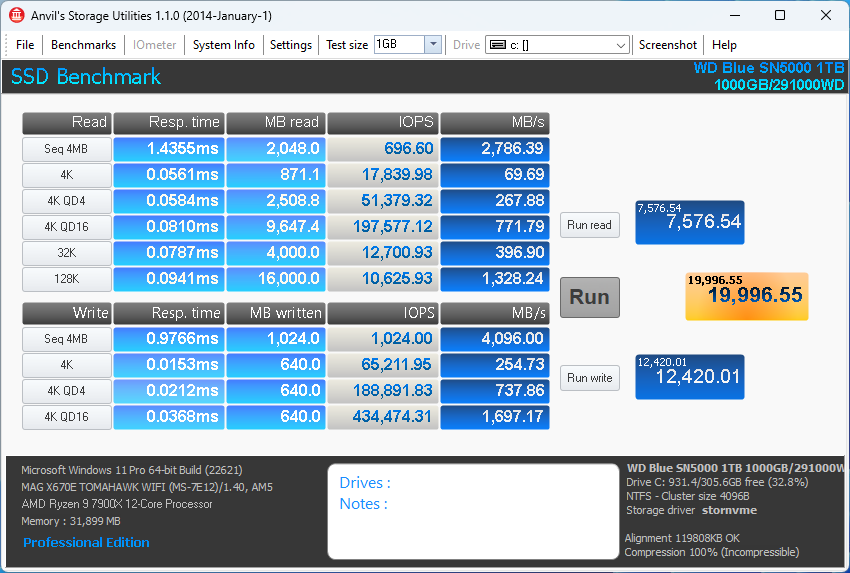
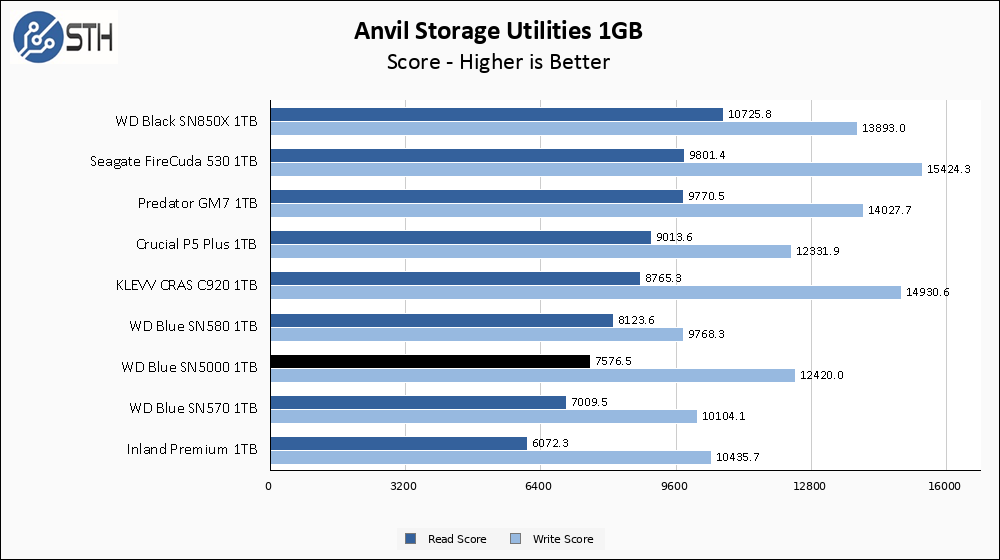
Anvil can sometimes punish a lower-end SSD, and it takes a bit of a toll on the SN5000. Read performance is relatively weak compared to the purely sequential tests of CrystalDiskMark and ATTO, and the SN580 manages to squeak out its first victory compared to its newer competitor. At least write performance remains strong, with the SN5000 punching above its weight class in that regard.

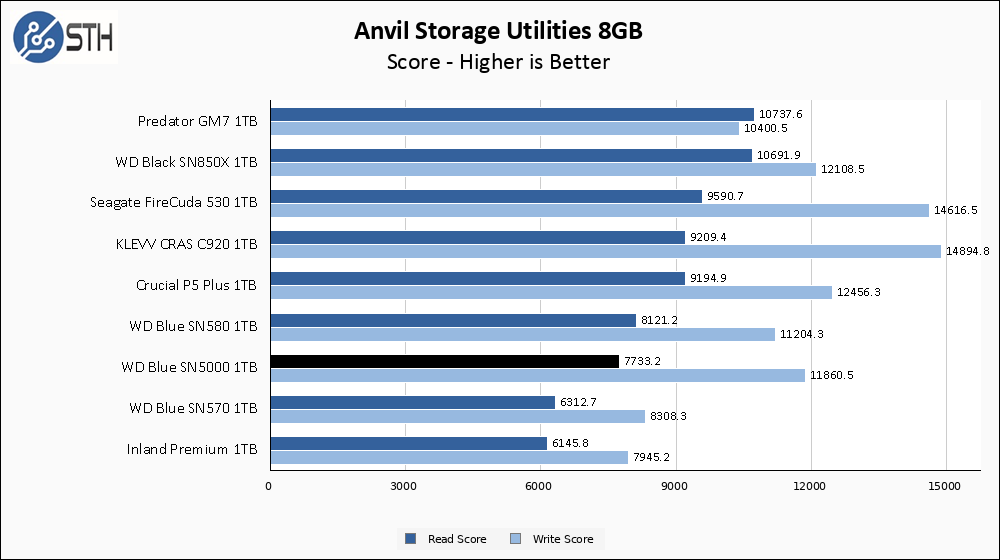
The SN5000 changes very little when put up against the larger Anvil test. Read score still slightly trails the SN580, while write score is still compellingly strong.
AS SSD Benchmark
AS SSD Benchmark is another good benchmark for testing SSDs. We run all three tests for our series. Like other utilities, it was run with both the default 1GB as well as a larger 10GB test set.

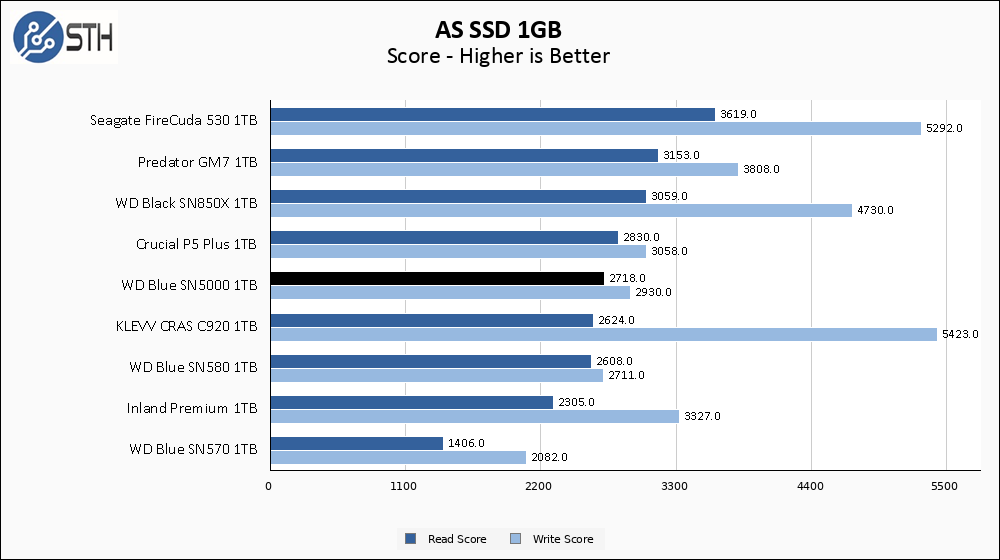
AS SSD allows the SN5000 to retake its position atop the SN580, if only by a thin margin. Middle of the road is definitely the summary for the SN5000 here.
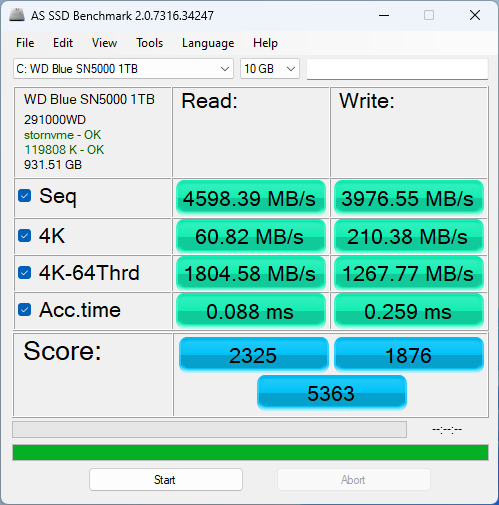
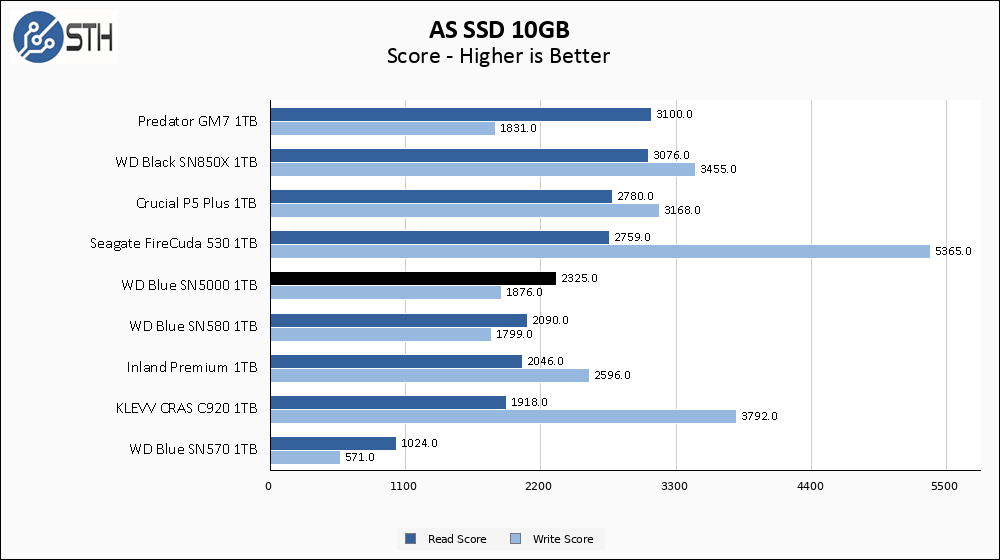
The SN5000 manages to hold onto its lead versus the SN580, and remains firmly in the middle of the read score pack on this larger AS SSD test. One additional thing to note here is the comparison to the two-generations-old WD Blue SN570, which both the SN580 and the SN5000 manage to leave in the dust.
SPECworkstation, thermals, and our conclusion are up next.


The review touches on the 4TB model as being QLC but I think undersells what’s been achieved. Benchmarks from a few other reviews I’ve seen show the 4TB model’s next gen QLC flash sustaining 540-600MBps post cache speed, which is closer to TLC level than past gen QLC and at least as performant as the TLC model figures here.
Greg,
I’ve got one of the 4TB drives, I plan on doing a review on it, but preliminary testing lines up with what you’re saying.
Thanks for the review!
I only wish we in the ‘server community’ could refrain from going away from the DWPD (Drive Writes Per Day) classification as it serves a good understanding on how durable the drive is according to daily usage. Often it would also be the same across the capacities but in this particular review it would highlight the different technology used. To only write out the TBW value adds a math equation on readers part.
Thanks.
Comments are closed.