WD Black SN770M 1TB Performance Testing
We test using both the default smaller test size and larger test sets on our benchmarks. This allows us to see the difference between lighter and heavier workloads.
A note for testing this drive: I do not have many other 2230-sized drives for the SN770M to compete against in my benchmark database. The Lexar PLAY and Silicon Power UD90 are the only other 2230 sized drives on the benchmark charts; every other drive is a 2280-sized drive.
CrystalDiskMark x64
CrystalDiskMark is used as a basic starting point for benchmarks as it is something commonly run by end-users as a sanity check.
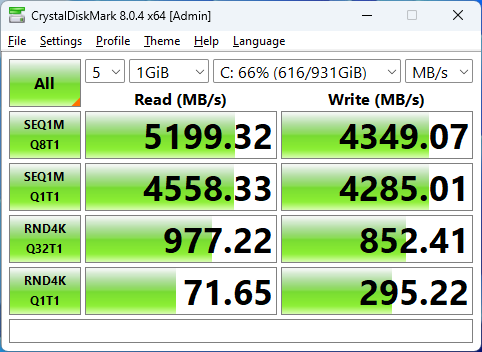
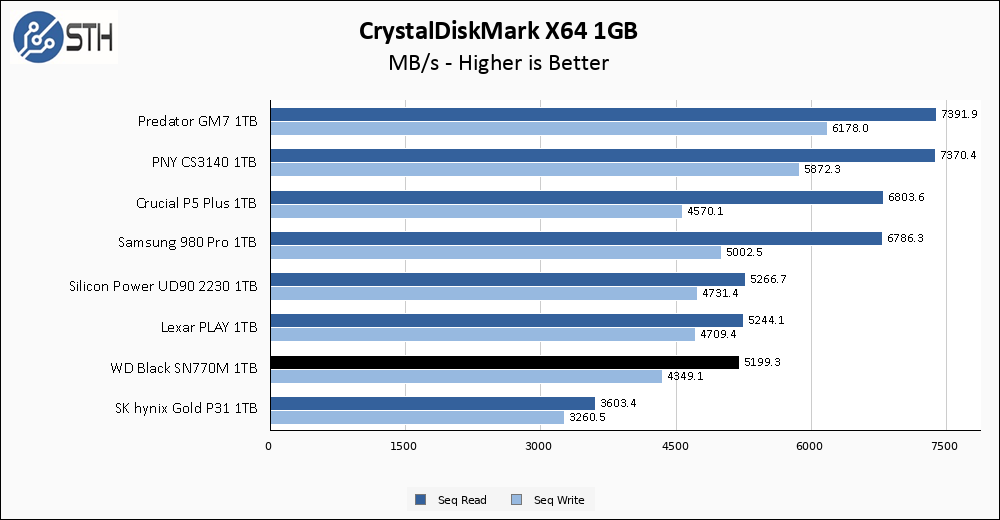
Out of the gate, the WD SN770M 1TB achieved similar sequential performance to the previous 2230 sized drives I have tested. With that said, write speeds come in a touch below the claimed 4800 MB/s specifications, and a little behind the other drives I have tested.
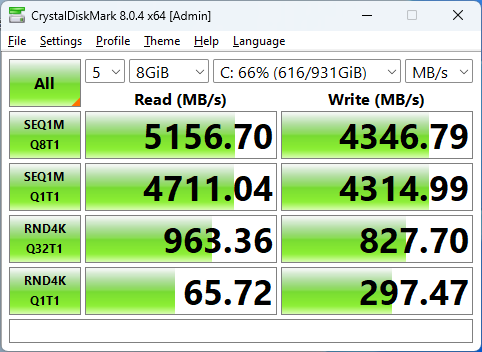
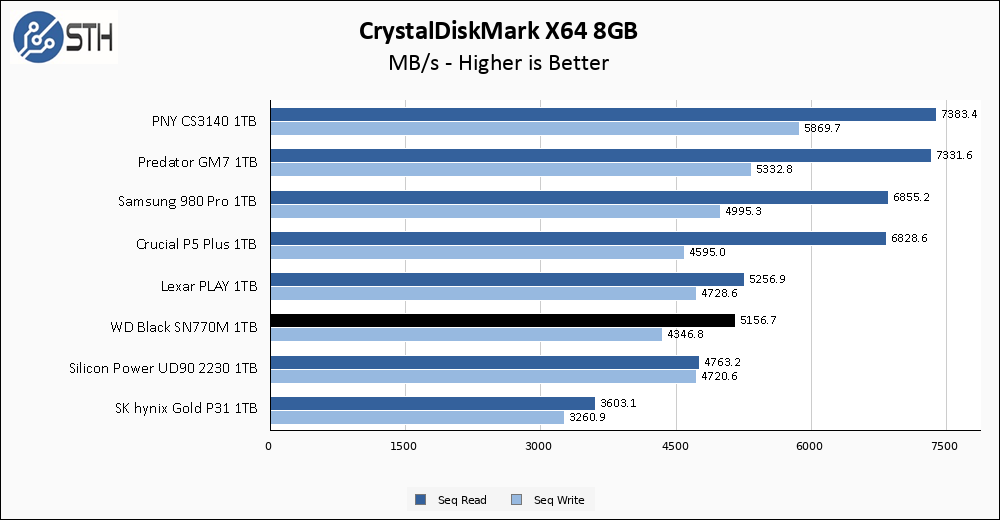
The WD SN770M performance on the larger CrystalDiskMark test remains essentially identical. That is good because no performance was lost, but less so because write performance still remains below spec.
ATTO Disk Benchmark
The ATTO Disk Benchmark has been a staple of drive sequential performance testing for years. ATTO was tested at both 256MB and 8GB file sizes.
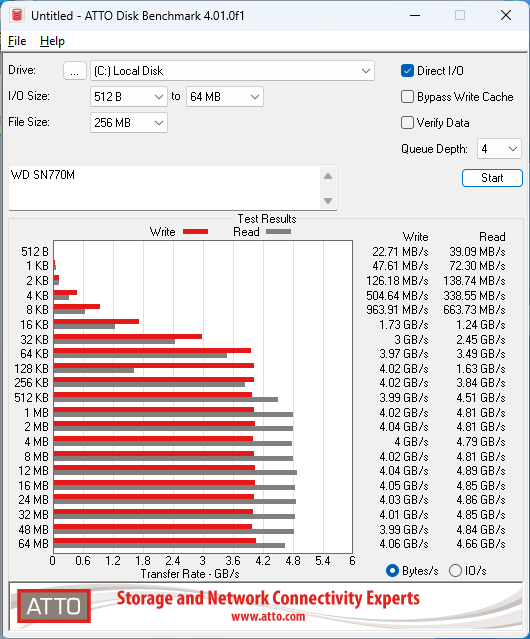
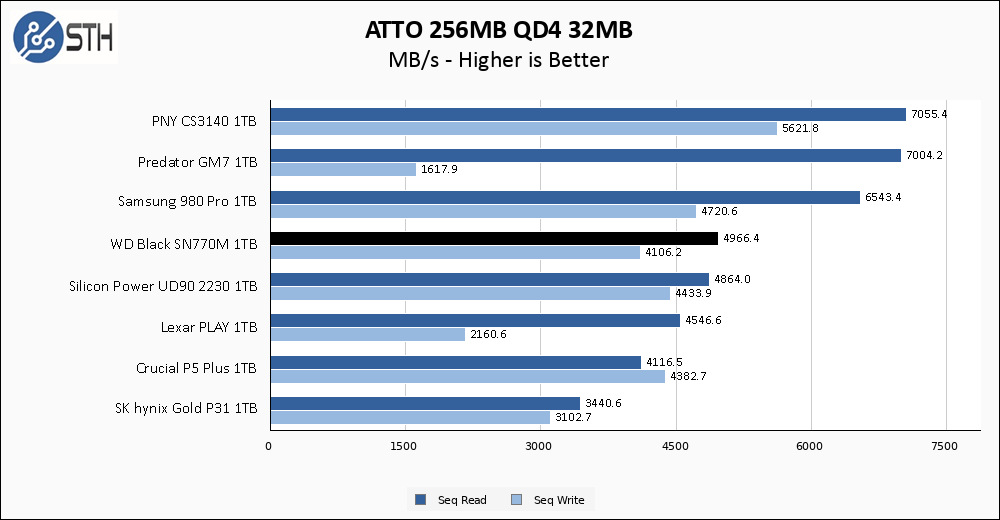
ATTO sequential results tend to come in slightly below what CrystalDiskMark records on most of my reviews, and that is the case here for the WD SN770M. Results for both sequential read and write look good here, with the continuing exception that write results are below advertised spec. My only problem with the performance on display here is the mismatch between what is advertised and what is delivered.
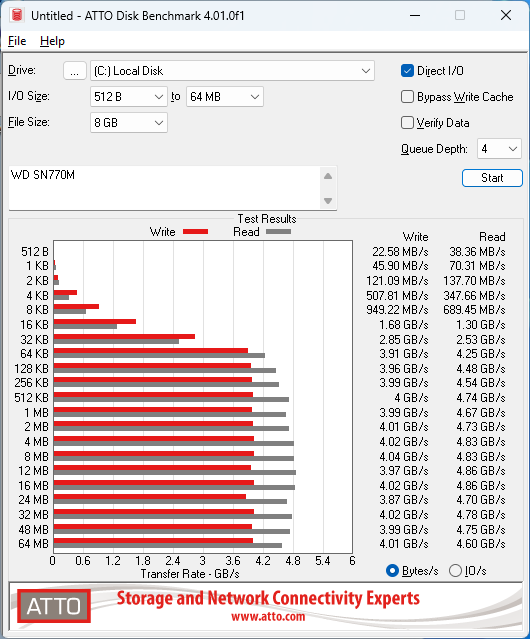
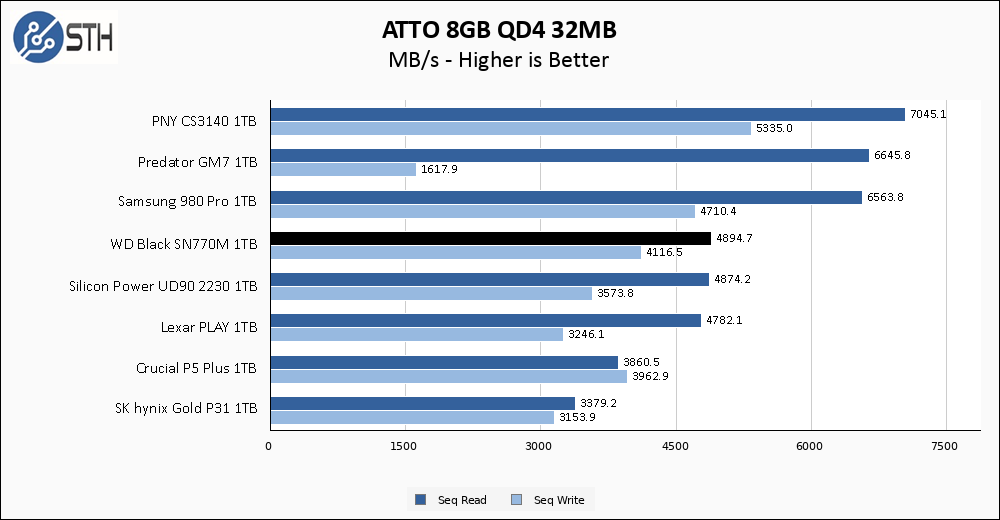
The larger ATTO test shows a negligible difference in performance, which is what I always want to see. In comparison with my other 2230 sized drives, the WD Black SN770M actually does the best of the lot here.
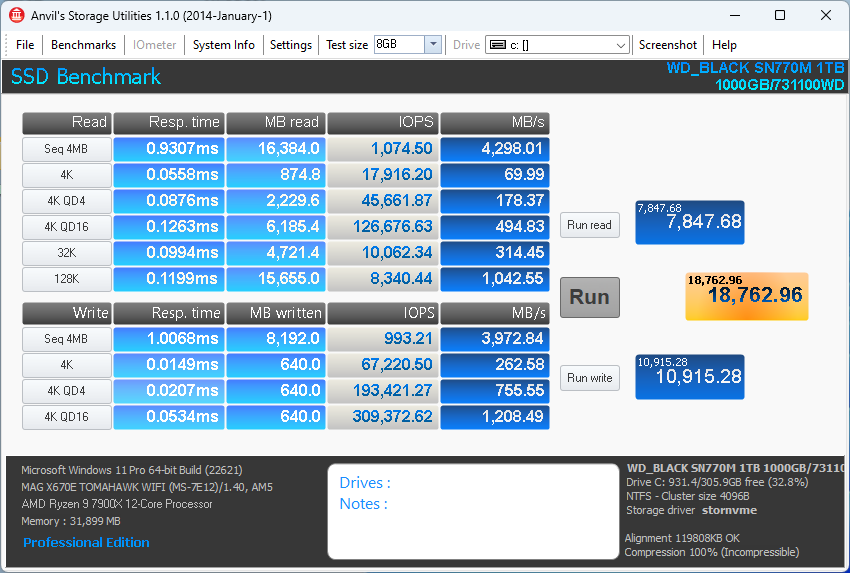
Anvil’s Storage Utilities
Anvil’s Storage Utilities is a comprehensive benchmark that gives us a very in-depth look at the performance of the drives tested. This benchmark was run with both a 1GB and 8GB test size.

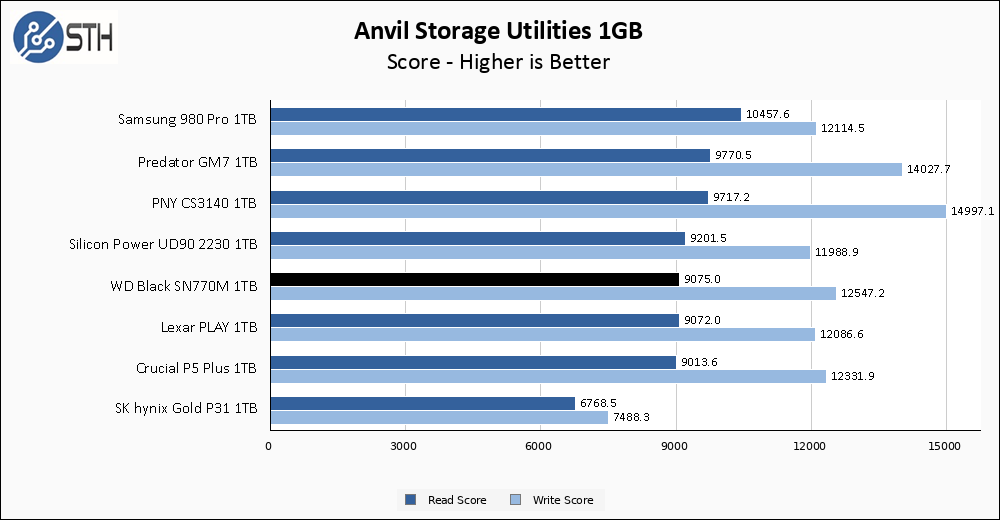
Anvil results for the WD SN770M 1TB are good, with read score results right in line with the UD90 and the PLAY, and slightly superior write performance compared to those two drives.
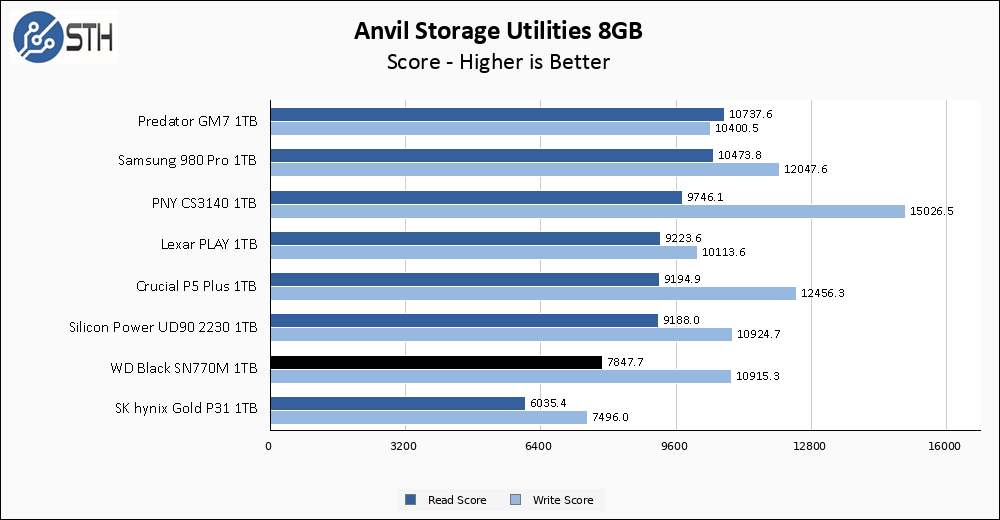
The WD SN770M takes a small tumble on the larger Anvil test, suffering particularly in the read performance department. Sequential read performance remains essentially identical, but most of the random read benchmarks come in a good bit slower. Write performance comes in a bit slower as well, but not to the degree that read performance dipped.
AS SSD Benchmark
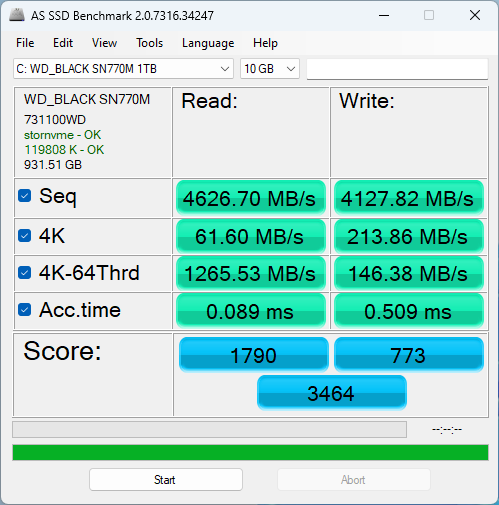
AS SSD Benchmark is another good benchmark for testing SSDs. We run all three tests for our series. Like other utilities, it was run with both the default 1GB as well as a larger 10GB test set.

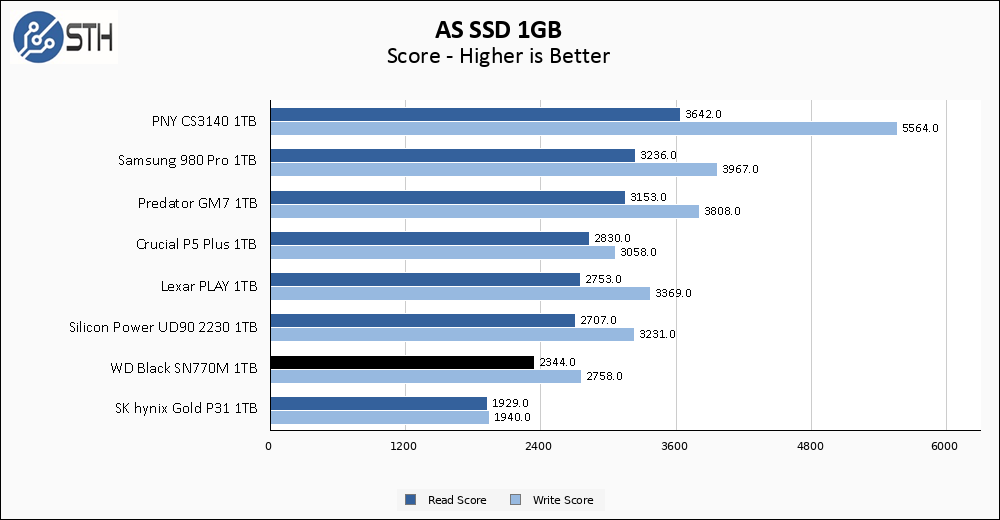
Suffice it to say, performance in AS SSD is not the WD Black SN770M’s strong point. The WD drive comes in below all the other Gen 4 drives on my chart, managing only to beat out the SK hynix Gold P31, which is on my chart as a representative of Gen 3 drives.
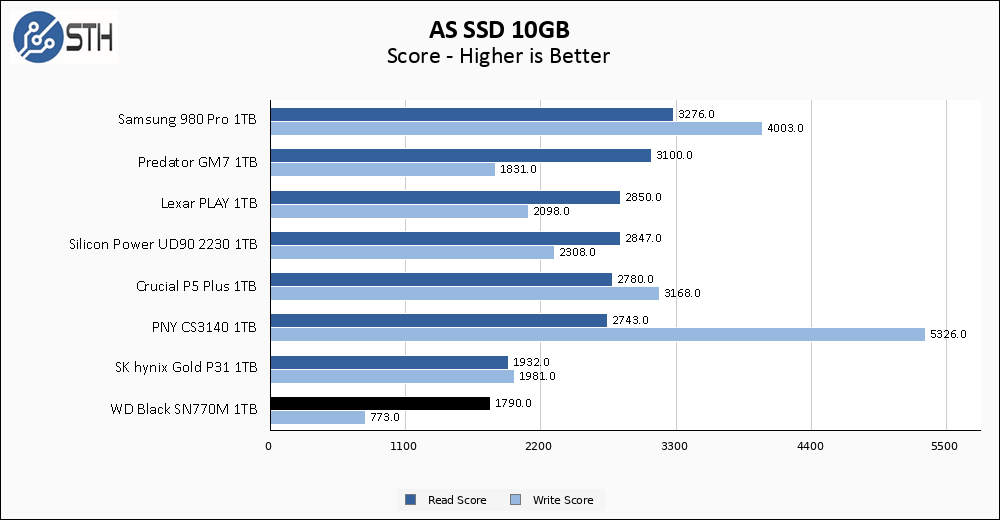
Things get even worse for the WD Black SN770M on the larger AS SSD test. Performance now drops below even the only Gen 3 drive on my chart, for both read and write score. In particular, the highly threaded 4K random read and write performance took a hit, and in writes that hit was particularly large.
SPECworkstation, thermals, and our conclusion are up next.


Probably the most obvious sign is that it definitely draws more power than the 2269xt based drives. Not great when most times it underperforms them
And it’s precisely those devices it will go into where you want to watch the power draw
In the review it is written “SPEC performance likely is not what this drive is targeted at, so I am mostly fine with these results.” I don’t understand this statement.
If the SSD targets simple synthetic benchmarks but underperforms on tests which mimic real application access patterns, that’s something I would not be fine with. I’d take that as a warning sign.
Comments are closed.