SK hynix Platinum P41 1TB Performance Testing
We test using both the default smaller test size as well as larger test sets on our benchmarks. This allows us to see the difference between lighter and heavier workloads.
CrystalDiskMark x64
CrystalDiskMark is used as a basic starting point for benchmarks as it is something commonly run by end-users as a sanity check.
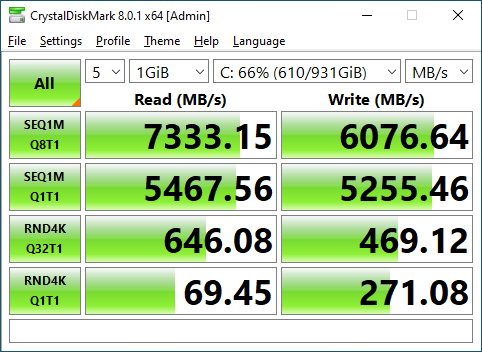
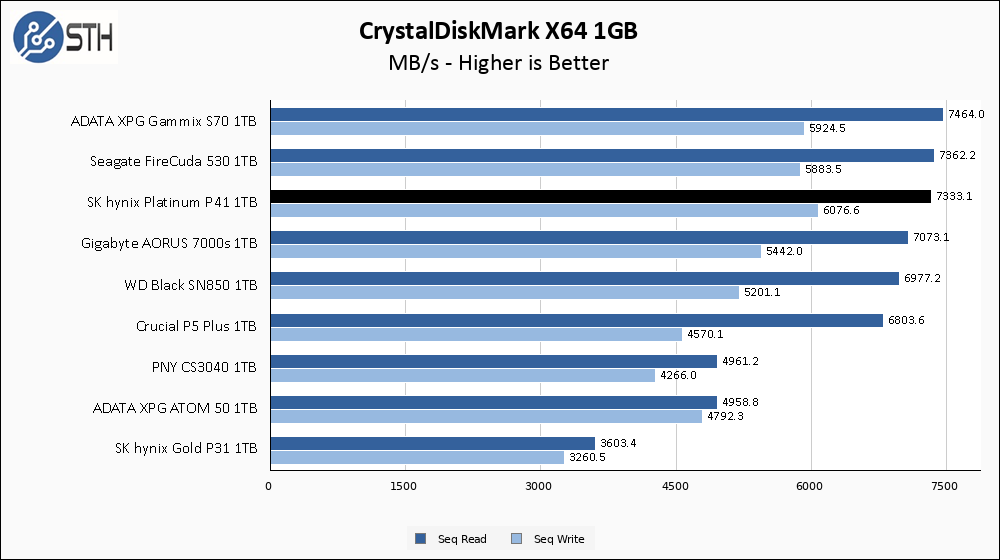
The Platinum P41 manages to exceed its rated sequential read speeds by a fair margin, but does not quite match its rated write speeds. Despite not quite matching write performance claims, the P41 still manages to turn in chart-topping sequential write performance, and is very close to the same on reads.
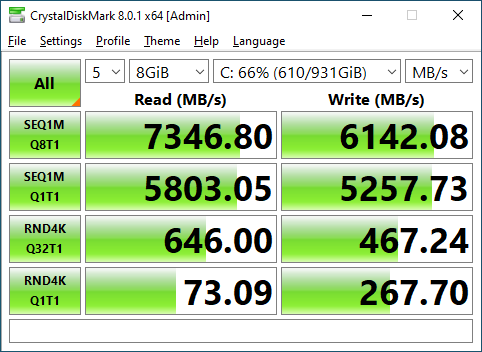
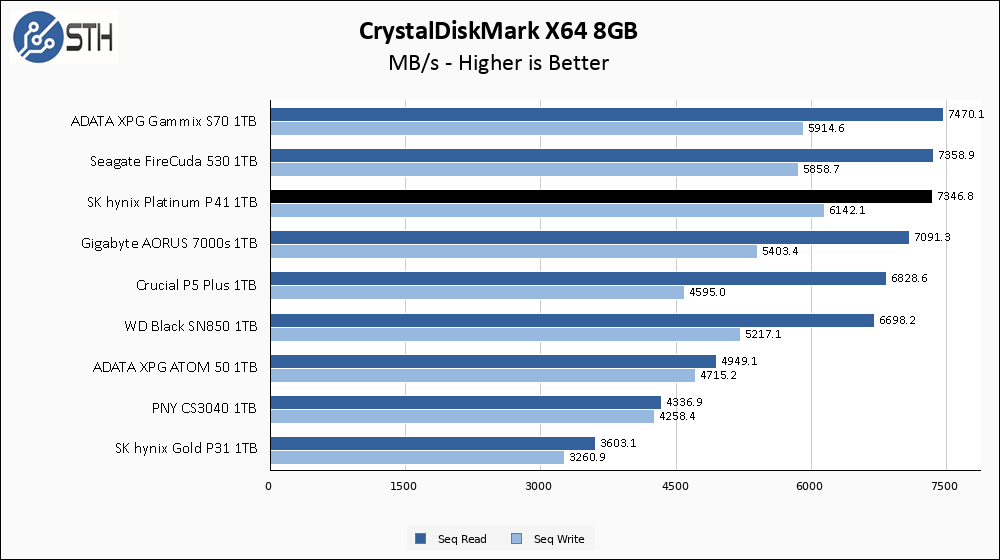
Performance improves ever so slightly on the larger CrystalDiskMark test. The improvement is not enough to catch up to the claimed 6500 MB/s write speed, but it does allow the P41 to extend its overall write speed crown over the rest of the competition.
ATTO Disk Benchmark
The ATTO Disk Benchmark has been a staple of drive sequential performance testing for years. ATTO was tested at both 256MB and 8GB file sizes.
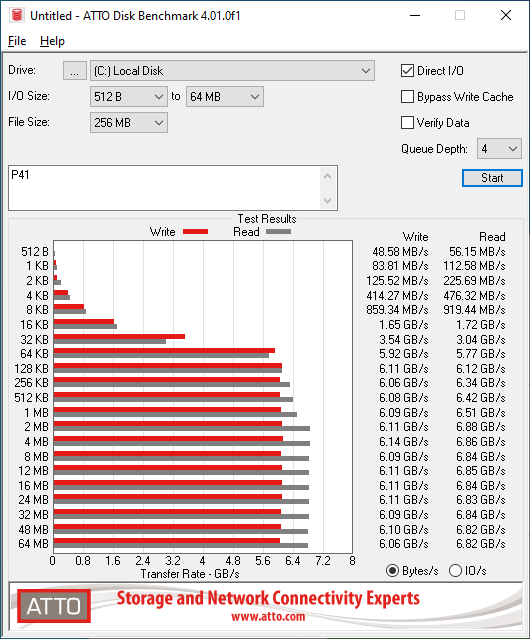
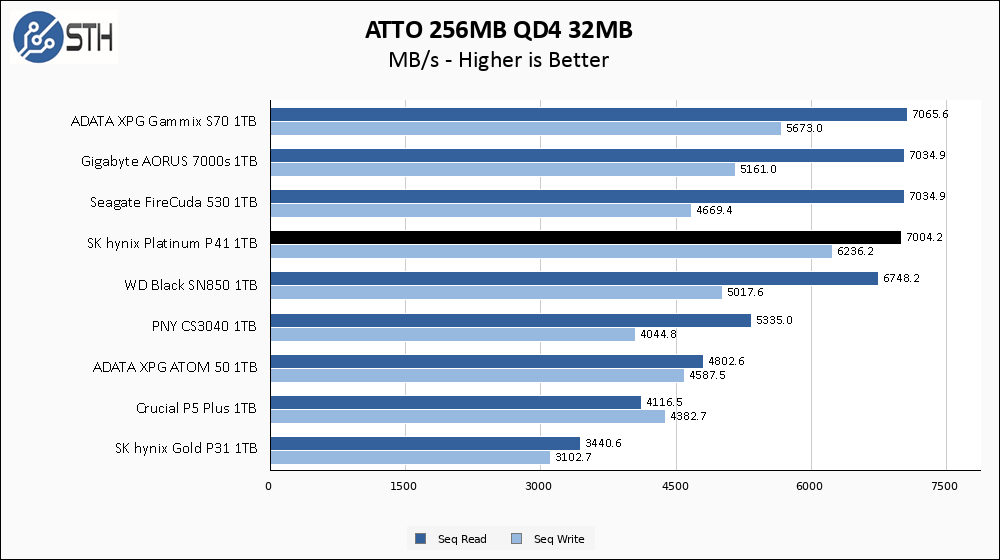
In ATTO read speed takes a small hit compared to CrystalDiskMark but still manages to meet its advertised performance as well as turning in a virtual tie with our other top-end PCIe 4.0 drives. Read speeds actually improve a bit versus CrystalDiskMark, and they remain the fastest sequential write speeds on the chart.
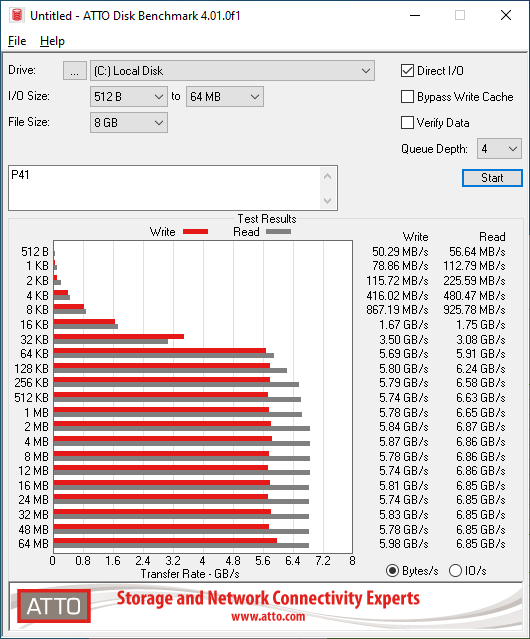
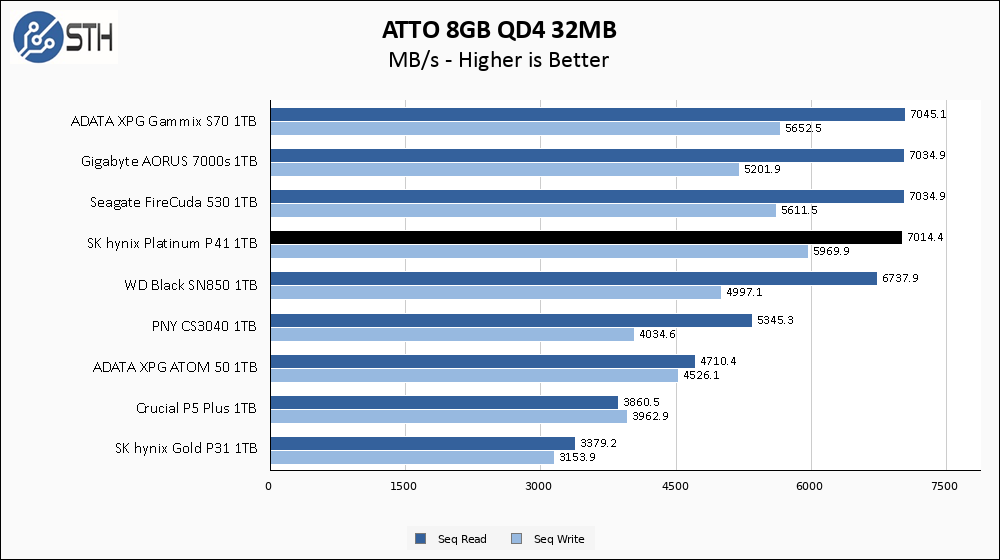
The P41 holds its ground in the larger ATTO test. Read speeds are still a tie with other top-end drives and write speed is still the fastest we have seen.
Anvil’s Storage Utilities
Anvil’s Storage Utilities is a comprehensive benchmark that gives us a very in-depth look at the performance of drives tested. This benchmark was run with both a 1GB and 8GB test size.
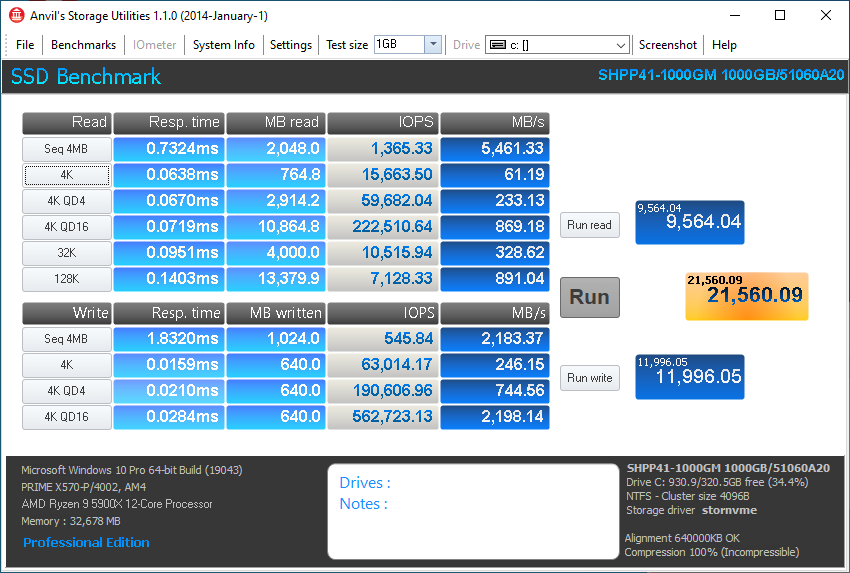
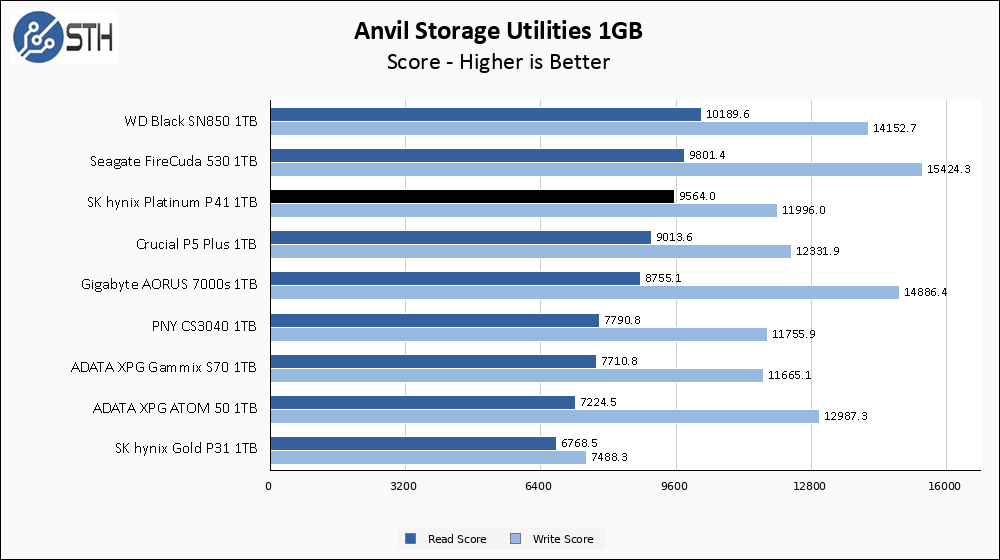
In Anvil, performance for the SK hynix Platinum P41 takes a small hit compared to the sequential-only tests we recorded in CDM and ATTO. While the P41 was the sequential write speed king in our previous tests, the write score in Anvil is much more down-to-earth. The P41’s scores are still fine, but it is in no way chart-topping like the CDM and ATTO results were.
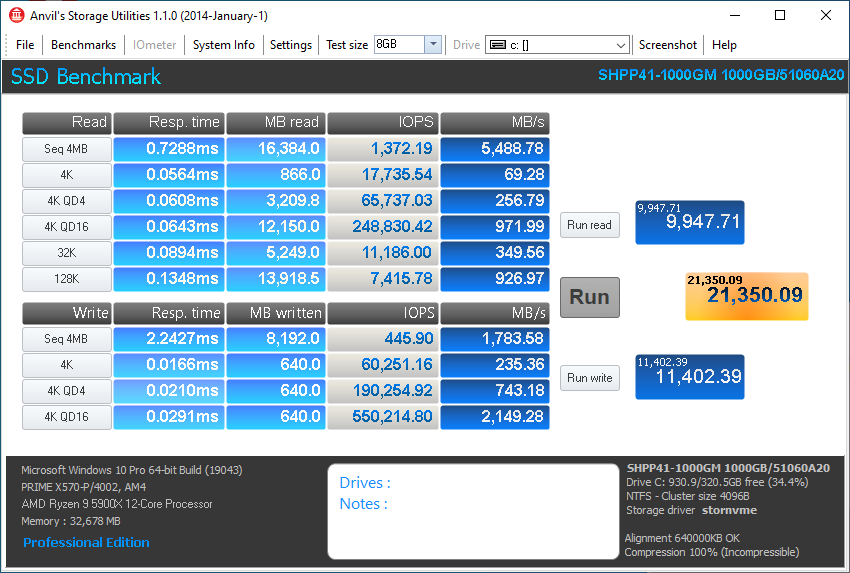
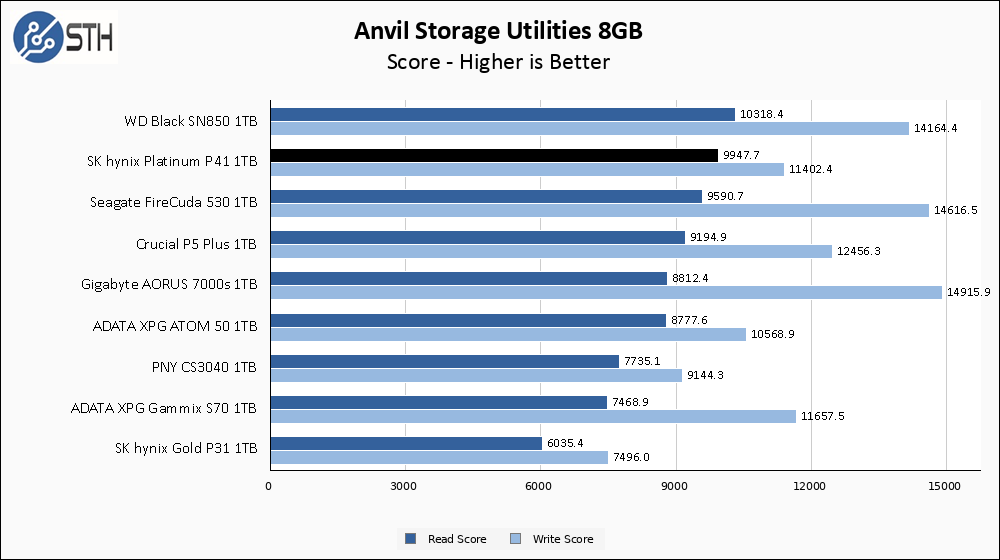
The P41 barely loses a step in the larger Anvil test. Read score is now in second place on our chart, narrowly losing to the WD Black SN850, and write score is still OK.
AS SSD Benchmark
AS SSD Benchmark is another good benchmark for testing SSDs. We run all three tests for our series. Like other utilities, it was run with both the default 1GB as well as a larger 10GB test set.
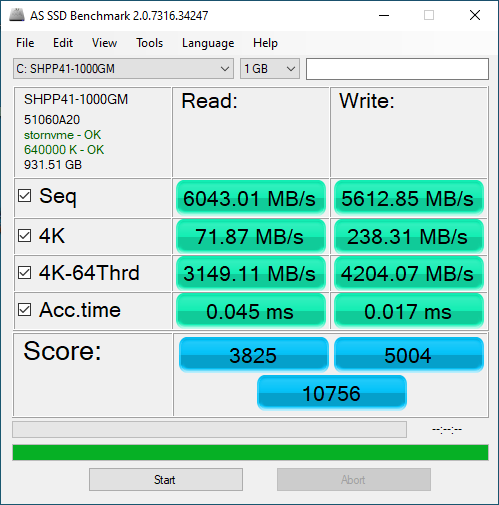
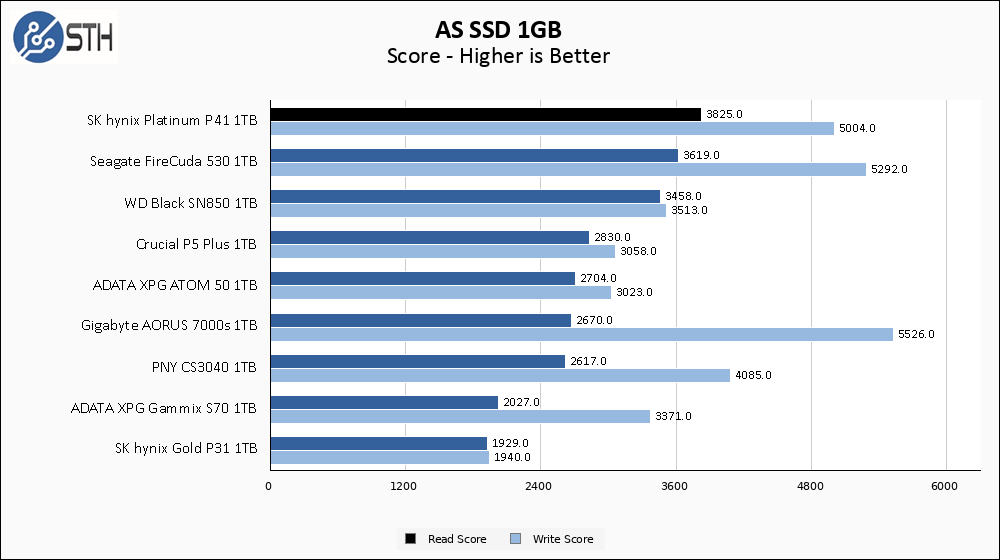
The SK hynix Platinum P41 turns in a great read score in AS SSD, landing at the top of my chart. Read score is also improved in AS SSD versus in Anvil, and the P41 lands a solid third place finish for writes.

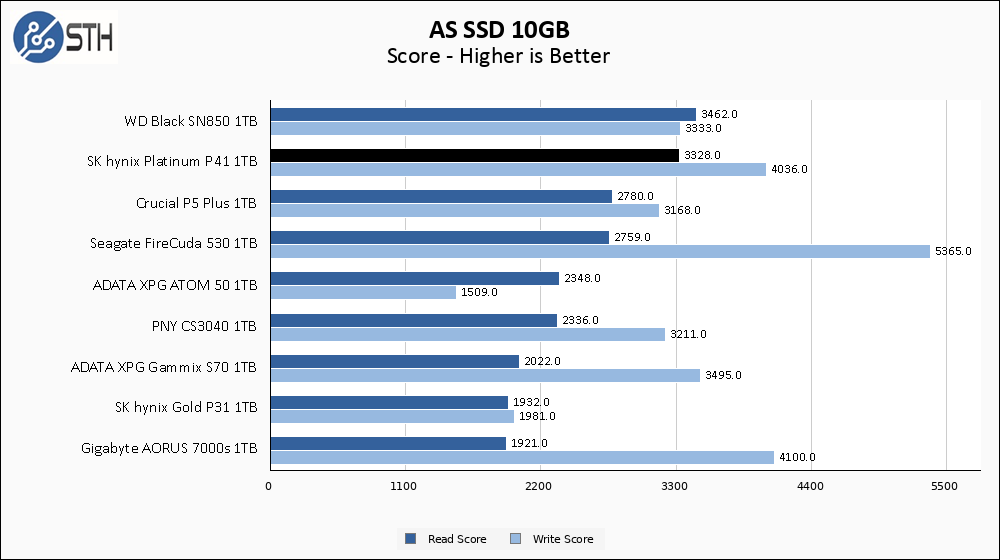
Performance in the larger AS SSD test slips a small amount, which allows the SN850 to squeak out a read score win. With that said, the P41 results in AS SSD remain very strong.
SPECworkstation, thermals, and our conclusion are up next.


test power and efficiency otherwise useless review
I don’t care about power on a SSD
If after running all the tests one starts over with the first one, are they repeatable?
The housekeeping and wear leveling chores could change over time even on a freshly trimmed drive. While I know each test includes multiple trials within each run, going through the whole benchmark series three (or more) times and breaking out the maximum, median and minimum results in a separate graph would add some statistics to the review which I’d find meaningful.
This is truly a pointless review if energy efficiency isn’t measured. That is what SK Hynix SSDs are famous for. No one cares if it gets hot under extreme load. Laptops usually have heatsinks to help with heat anyway.
May I ask why is Samsung 980 PRO drive missing from the comparison lineup? Given samsungs historical primacy as performace leader in segment, I would expect it to be THE benchmark for others to compare against.
I have the P31 Gold 1TB drive. It’s a good drive overall and my complaints about it are centered around the lack of firmware updates and the overall usefulness of their drive tools (something Intel and Samsung are great at). The drive tools are plain ugly due to poor formatting causing overlapping text and numbers. There hasn’t been a new firmware release since I bought the drive early last year. Aside from that it’s been a great drive. I’d pick up a P41 once I build a computer that has PCIe 4.0 support. Hopefully they’ve polished up the drive tools and support the drive with firmware (if needed)
Secondary question – does anyone know why are SK hynix consumer ssd seemingly absent from european market?
There some ram modules, but ssd are not listed seemingly anywhere ( Czech Republic region).
The phison E16 gen had around 1400 TBW for a 1 TB SSD. now that has come down to 750 TBW. Any idea Why that is
May I ask you a question why do Samsung drives are missing on the graphs? They are quite a good ones and I’ve used’em for years. Would be a good comparison point
Artem – that is a fairly easy one. We tested many of the Samsung drives when we were still using 500-512GB drives. We swapped to 1TB and folks do not like seeing 512GB drives with 1TB given performance variations at capacity points.
Just so you know, we have a few Samsung and Sabrent drives (Sabrent was also in this with either larger or smaller than 1TB drives) coming so we can add them.
As SSDs evolve in their underlying flash memory structure (SLC -> QLC), it would be interesting if you could say more about the used SSD controller properties. Especially with non-consumer SSDs the properties of the controller may have a large impact on the life expectancy and durability of the SSD. I’m thinking for example of wear levelling: dynamic wear levelling versus static (& global) wear levelling. With Project Kenko 01 you you took a look at the wear and tear in a quantative way. That will usually not be possible for reviewing & testing new SSDs. However, considering your expertise, it should be possible to say something in a qualitative way about the controller, either extracted from the datasheets or via personal connections within the industry.
Comments are closed.