Seagate FireCuda 540 2TB Performance Testing
We test using both the default smaller test size as well as larger test sets on our benchmarks. This allows us to see the difference between lighter and heavier workloads.
CrystalDiskMark x64
CrystalDiskMark is used as a basic starting point for benchmarks as it is something commonly run by end-users as a sanity check.
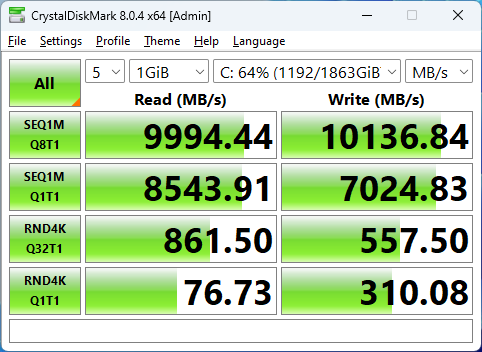
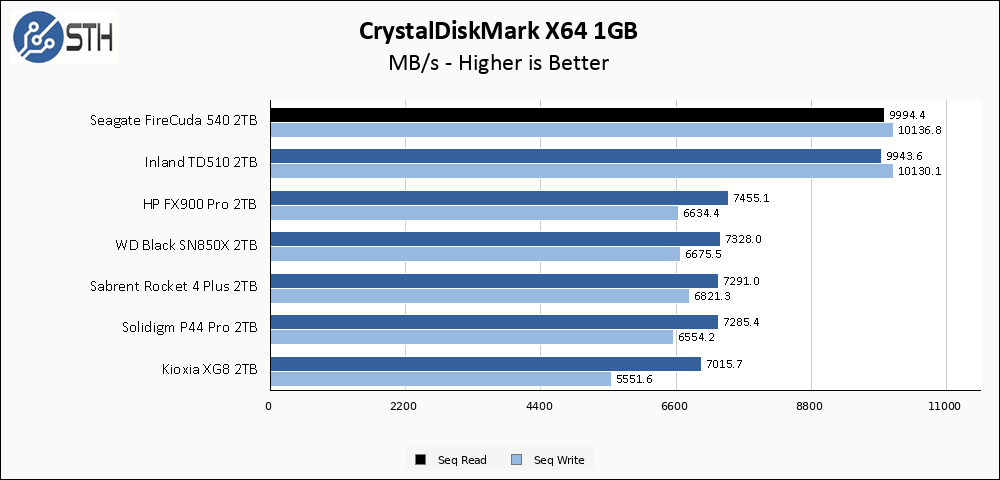
The Seagate FireCuda 540 2TB reaches for 10000 MB/s read and write and basically gets there. Performance is very similar to the TD510 which is to be expected as they share many of the same components.
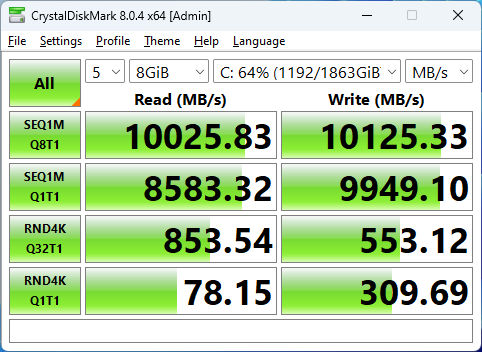
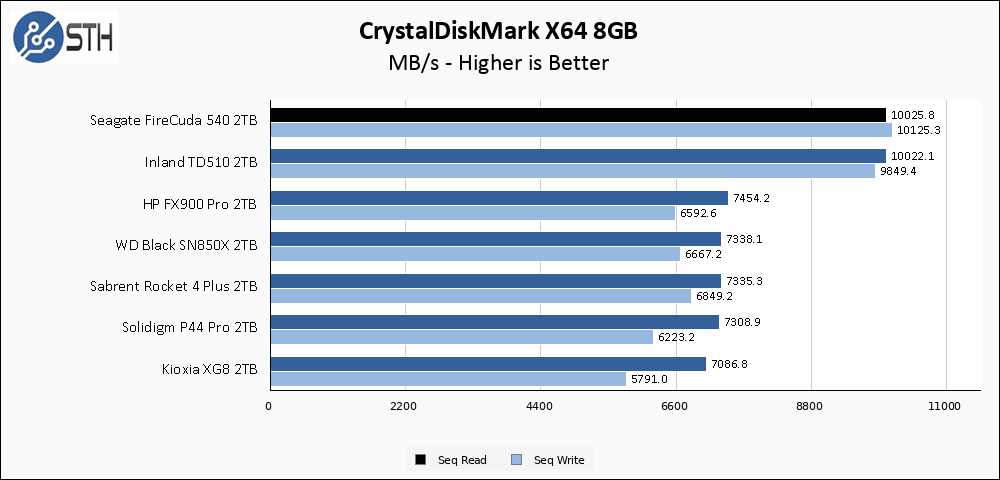
The larger CrystalDiskMark test is an even better showing for the FireCuda 540.
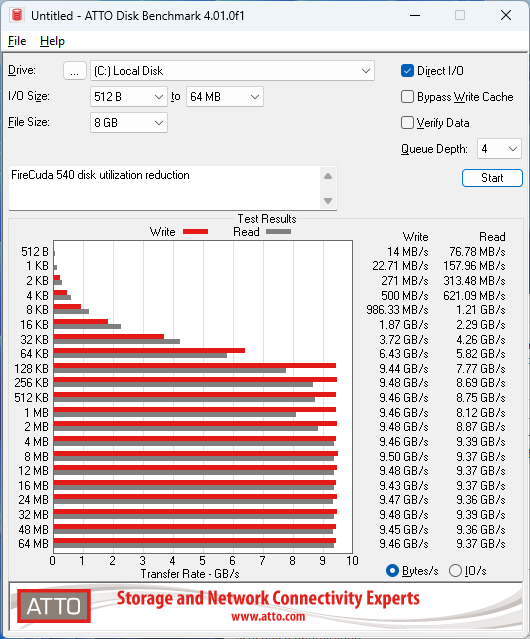
ATTO Disk Benchmark
The ATTO Disk Benchmark has been a staple of drive sequential performance testing for years. ATTO was tested at both 256MB and 8GB file sizes.
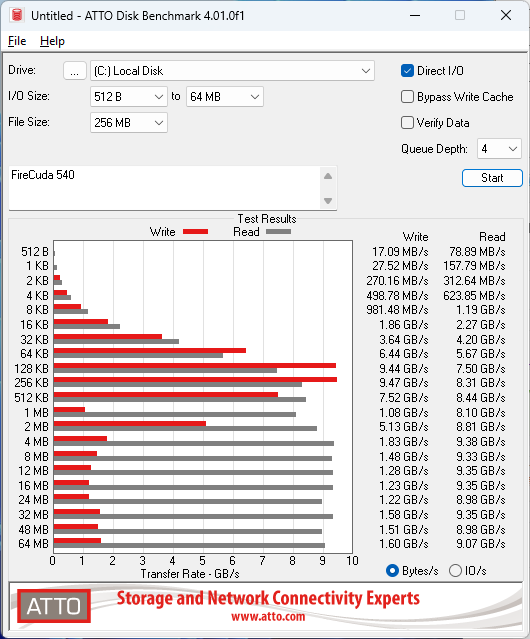
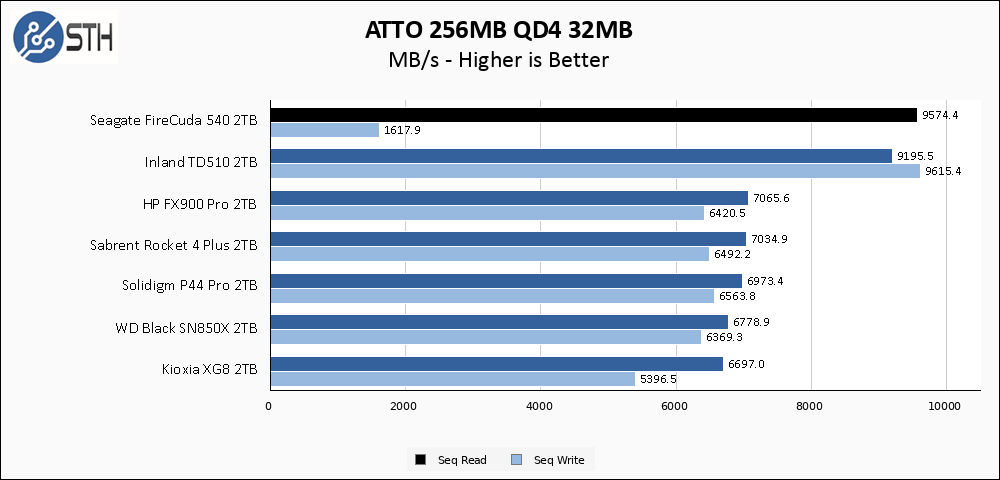
ATTO results are… strange. This behavior was repeated after several re-runs of the benchmark. The FireCuda 540 simply does not like this test, where the TD510 has no problem with it. Given the overall performance of the FireCuda 540 I am willing to essentially write this off as some kind of specific interaction with ATTO, but it is interesting nonetheless.
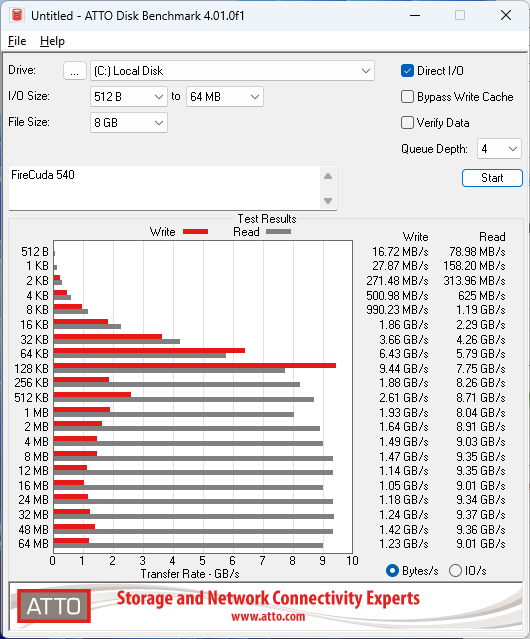
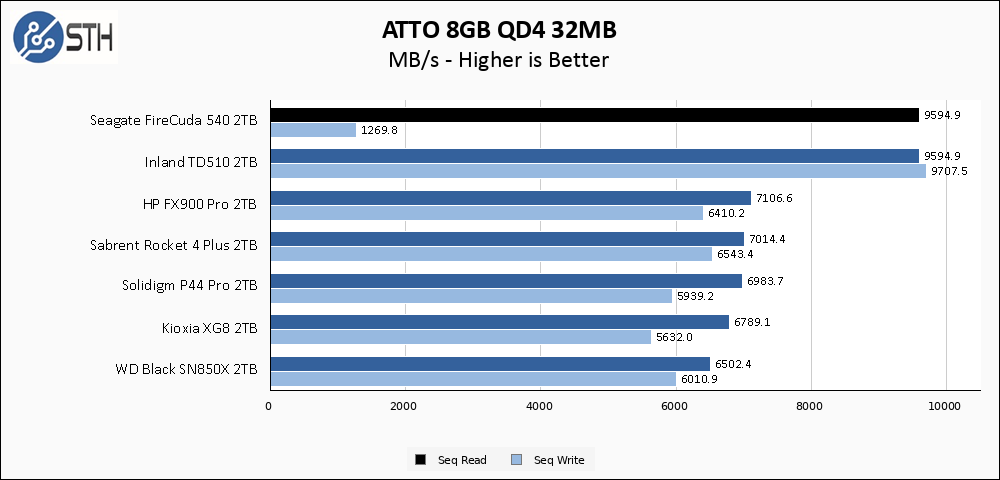
The larger ATTO test continues to show the strangely low write performance for the FireCuda 540, where once again the Inland drive does not suffer the same issue.
ATTO Anomaly Tested
*Edit* 18/08/2023
I have partially isolated the performance issue causing the low ATTO write performance results; it seems to be related to the utilized disk space on the drive. I test drives at around 65% used disk space after my prep process. I re-ran ATTO with disk space at closer to 4% used, and the results completely clear up.
I will be reaching out to Seagate and providing them with my results.
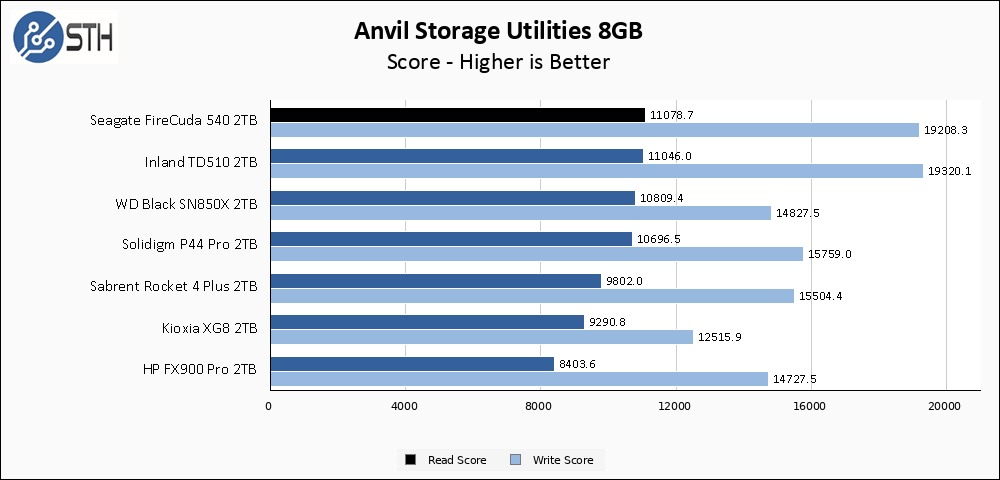
Anvil’s Storage Utilities
Anvil’s Storage Utilities is a comprehensive benchmark that gives us a very in-depth look at the performance of the drives tested. This benchmark was run with both a 1GB and 8GB test size.
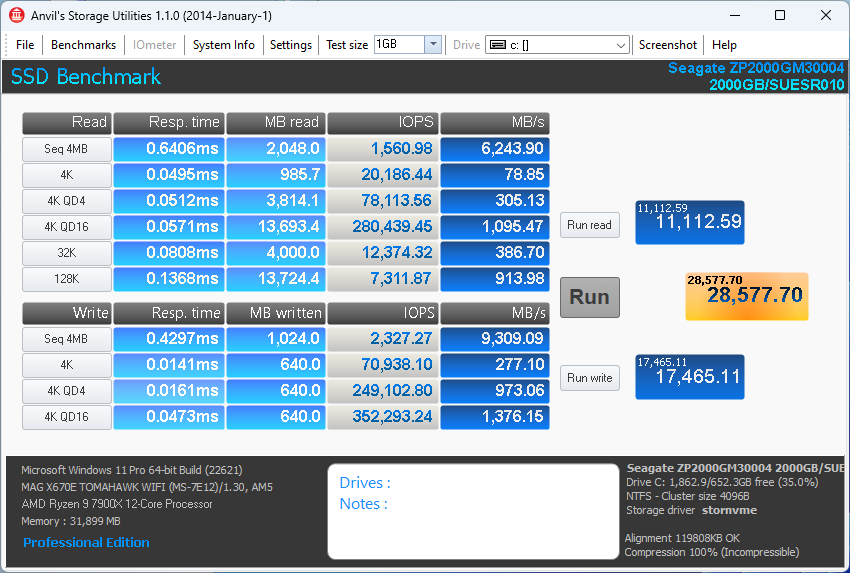
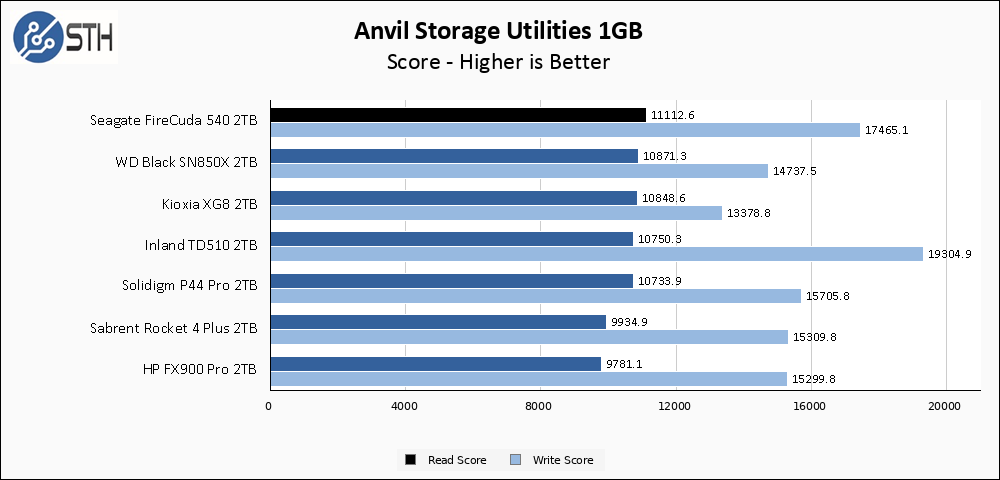
Read performance in Anvil chalks up a win for the FireCuda 540, which narrowly manages to edge out both the TD510 and the rest of my benchmark pack. Write performance is still very fast, but the TD510 has an edge there.
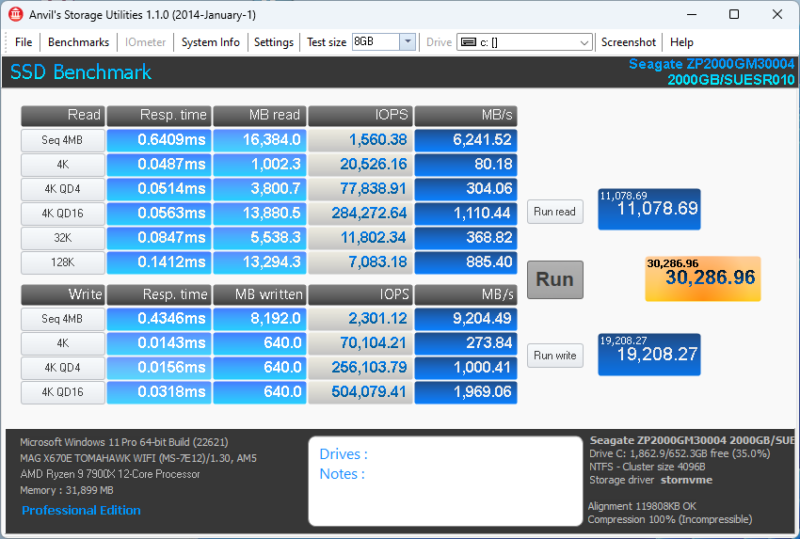
The larger Anvil test has the FireCuda 540 equalizes the FireCuda 540 and the TD510 and both turn in very similar results.
AS SSD Benchmark
AS SSD Benchmark is another good benchmark for testing SSDs. We run all three tests for our series. Like other utilities, it was run with both the default 1GB as well as a larger 10GB test set.
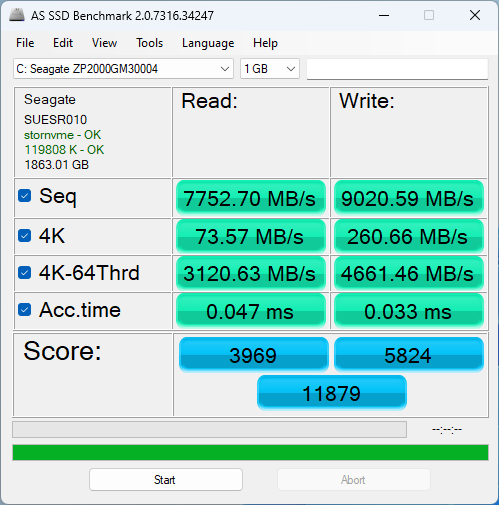
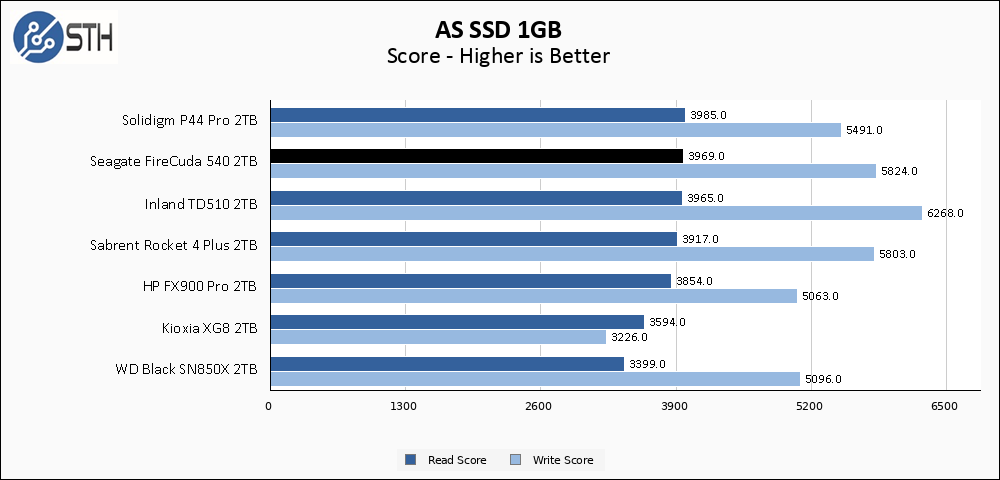
AS SSD results once again show a narrow advantage for the TD510 in write performance over the FireCuda 540, while the read performance on the 540 is equal or better.
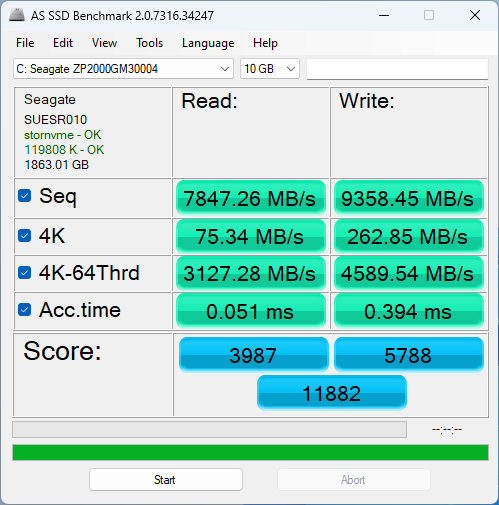
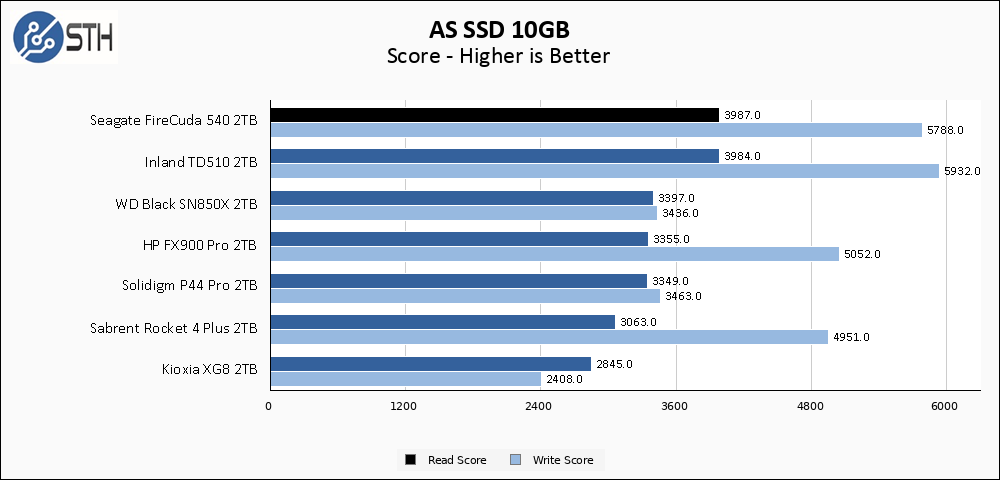
Once again the larger AS SSD lets the FireCuda 540 catch back up with the TD510 in terms of write score while maintaining its margin-of-error lead in read score.
SPECworkstation, thermals, and our conclusion are up next.


Since you’re not controlling for thermals during the benchmarks it’s likely that the ATTO results are caused by thermal throttling, possibly because you’re using a motherboard heatsink on top of a thermally conductive sticker that should be removed (or tested without the heatsink but with airflow). It also highlights how primitive the benchmark methodology is so perhaps some improvement is needed there.
David,
You are quite incorrect. I test drives for their thermal performance during the initial drive load, and then make adjustments to prevent the drive from thermally throttling while I run through the rest of my benchmark suite. Under my heatsink, this particular drive never reached 60C during all of the actual benchmark tests, as was explained in the thermals section of the review.
In my opinion, a drive which performs poorly on one of the benchmarks (such a ATTO) may also perform poorly for a real application. It would add significant value to these reviews if further investigation determined the underlying cause of the unexpected performance. Then readers could decide whether that problem would affect their real world usage.
Two things have raised an eyebrow with me on these Gen5 SSDs. One is how many are sporting massive heatsinks right out of the box (although this one doesn’t), and the other is this odd ATTO anomaly.
Average temp under load may not tell enough of the tale here. It might require hi-res thermal imaging to detect small isolated hot spots that still suffice to trigger thermal throttling. Is STH equipped to perform such imaging?
@Will this reads as if you’re only relying on the temperature reporting of the drive itself, which according to documentation sports a single thermistor for temperature monitoring. I’m fairly certain that your anomalies are caused by the controller thermal throttling. A simple test could confirm this, remove your heat sink and add ample airflow while running the ATTO tests.
David, and Bob,
ATTO performance remains an anomaly, despite some retesting I just performed. Despite completely disagreeing with David that his “remove your heat sink and add ample airflow” would yield sufficient results, I went ahead and tried that. I removed the heatsink and pointed a high speed fan directly at the drive and re-ran ATTO. At the 256KB chunk and all subsequent chunks the drive reached 80+ C and thermal throttled hard for the rest of the test. If you would like to see what that graph looks like, here it is: https://i.imgur.com/9P4CGZe.png
If you look at that and compare it to the ATTO results in my benchmark, you will see that it looks quite different. Specifically, you will note that when the 540 is thermal throttling that it also affects read speeds, which drop to below 2 GB/s. When this test is run with the heatsink attached – which also has some airflow going over it – the drive is kept much cooler and while the write speed suffers the read speed stays consistently above 9 GB/s.
Bob, I do have a thermal camera – it is a FLIR C5. With that said, it isn’t much use to me while the drive is underneath a heatsink, because it cannot see through metal. Regardless, I do not believe this drive is thermally throttling while installed on my heatsink, as the ATTO benchmark result behavior is quite different when I *know* it is throttling. I suppose I cannot prove that it isn’t throttling, but the evidence I am looking at seems to support my supposition. Other benchmark results (non-ATTO) turned in by this drive do not support the idea that it is thermally throttling during testing, and ATTO is far from the most intensive test that gets run.
After some additional testing, I have a theory as to the degraded ATTO performance. It seems to be tied to utilized disk space. As you may know from reading my reviews – hopefully – I test drives in a ‘used’ state. I load them up to ~80% disk space used, then delete a bit so it is near to 65% disk space. In my mind, this helps simulate a drive that is ‘mid-life’ rather than fresh out of the box and blank, and performance can differ. In some drives in the past, testing this way has exposed performance problems with drives when run at capacity; the XPG S70 comes to mind. On a hunch, I deleted all of my test data from the drive which puts the drive at only 5% used capacity, ran a TRIM, and then re-ran ATTO. It passes the test with flying colors, 9+ GB/s read/write the whole way down the line. I then regenerated my test data, which is around 1.1TB on a 2TB drive, and re-ran ATTO. Voila, the same write performance problem has recurred. I will reach out to Seagate.
Very interesting. A plot of %-data-preload vs. ATTO score might be entertaining. On an HDD, one might wonder about file fragmention.
I presume the usual SSD test protocol is to format the drive to 100% of declared capacity, and separately, check for any changes in Bad Block stats … and that over-provisioning/reassignment is not suspected in the case.
The full drive prep (for a consumer drive) starts with either a factory new drive, or one that has been blanked and TRIM’d and then allowed time to rest.
Once that is done, the drive is inserted into M2_1 on my test system and a secondary SSD (a small 250GB NVMe drive) is inserted into a secondary slot. That secondary SSD contains the ‘template’ – Windows 11 installation, plus all of my benchmark utilities and such. The install also has a static IP set on its network adapter and that static IP does not have a gateway, so it has no internet access, thus preventing things like automatic updates from running in the background that might disrupt or color testing. That template is cloned via Macrium Reflect over to the test SSD, then the system is shut down and the secondary SSD is removed.
Windows boots up then directly from M2_1, the volume is expanded to consume the rest of the space on the disk (because it was only 250GB when it cloned over), CDI is checked to ensure things like PCIe link speed and drive health are reporting good. At that point HWMonitor is started up, and I use a random file creation utility that I run 10 copies of concurrently. Each copy creates 15 10GB files (on a 2TB SSD) which takes the system up to around 85% total disk use. During the creation process for these files, I monitor both temperature (via HWmonitor, and via FLIR if things look like they need a second opinion) and write speed via Task Manager. Drives tend to heat up pretty quickly during this process, so if they begin to throttle I make note of that and attach a heatsink to the drive – which I can do while it is still writing data – and observe that the throttling behavior stops and write speeds go back up and temperatures drop as expected. Near the end of this writing process is when I take my post-cache write speed screenshot, when the write speed has leveled out to its lowest point.
Once all that is done, I go into the folder with all the 10GB random test files and delete 30 of them. This leaves me with between 64% and 66% used disk space. I then begin with CrystalDiskMark, then ATTO, then Anvil, then ASSSD, then SPECws. I take screenshots of all of the testing results along the way. CDI gets checked on the way out the door, as does HWMonitor to make sure there were no unexpected temperature spikes during the tests. Some of this process is automated, some of it is manual, and if anything is anomalous looking then the whole process gets repeated manually.
To help me make a more informed buying decision it would be helpful if you focused less on synthetic benchmarks focusing on sequential r/w and use a more real-world application based testing. Because based on what you have shown here, in terms of day to day use, this drive looks like a show pony with no practical advantage over a less expensive Gen4 drive.
@Will I stand corrected then on the thermal throttling, thanks for re-testing and interesting that drive capacity influences the benchmark results. Perhaps this drive utilizes dynamic cache by using a portion of the NAND in SLC mode which is greatly reduced when the drive is nearly full, even though the specs list that this drive has DRAM onboard.
So, this drive is not suitable for some use-cases, such as RAW 8K60p DeepColor video recording using DeckLink 8K Pro
Are there any news or comments from Seagate? Thank you for the update.
Comments are closed.