Seagate Barracuda 510 1TB Performance Testing
We test using both the default smaller test size as well as larger test sets on our benchmarks. This allows us to see the difference between lighter and heavier workloads.
CrystalDiskMark x64
CrystalDiskMark is used as a basic starting point for benchmarks as it is something commonly run by end-users as a sanity check.
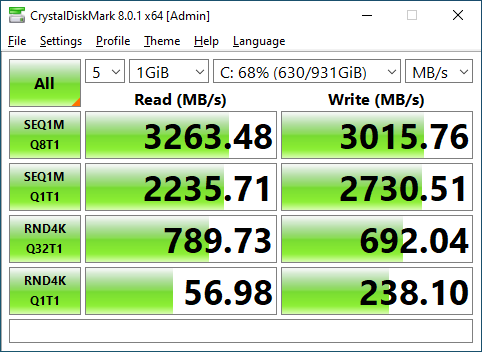
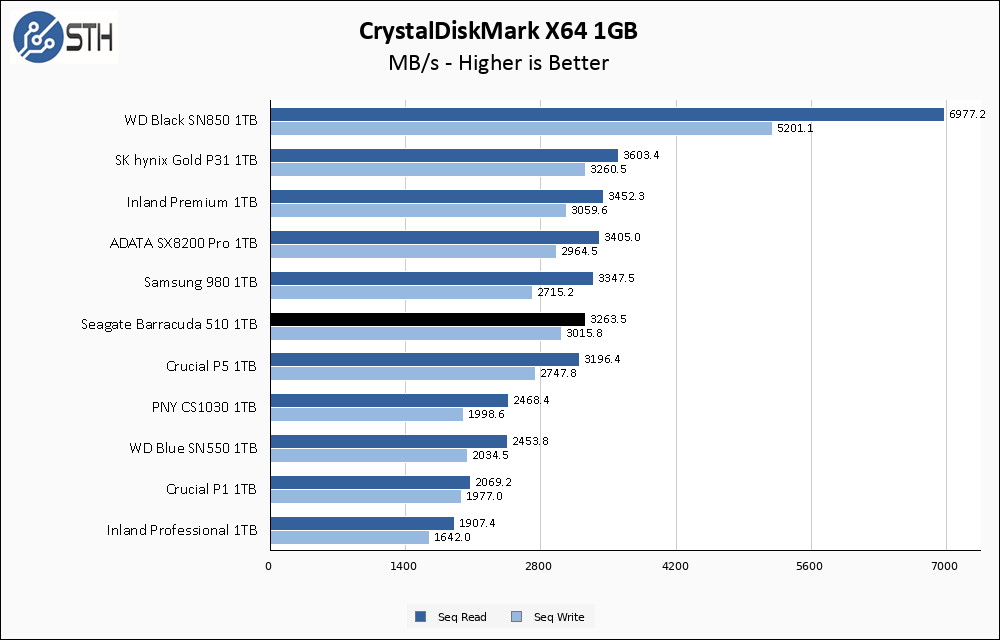
The Seagate Barracuda 510 lands in the company of other good-performing PCIe 3.0 SSDs. Read performance comes up a tick shy of the 3400 MB/s rated, but write performance is exactly on target.
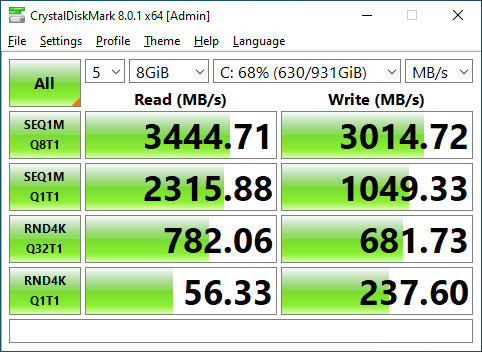
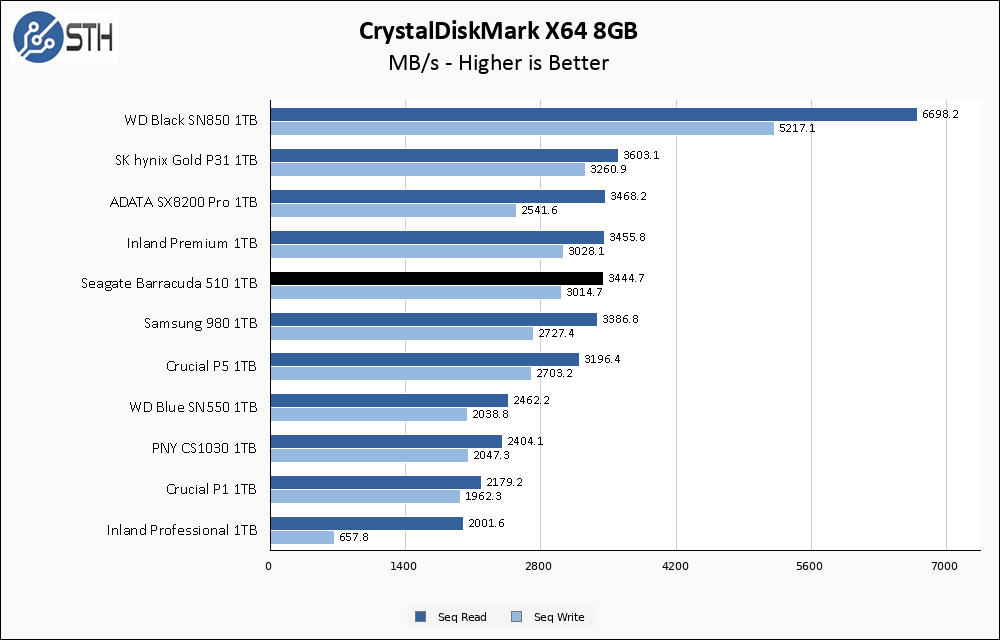
The larger CrystalDiskMark test improves performance on the Seagate Barracuda 510 1TB, and as a result it now manages to match its rated specs as well as come in a virtual tie with the Inland Premium 1TB drive.
ATTO Disk Benchmark
The ATTO Disk Benchmark has been a staple of drive sequential performance testing for years. ATTO was tested at both 256MB and 8GB file sizes.
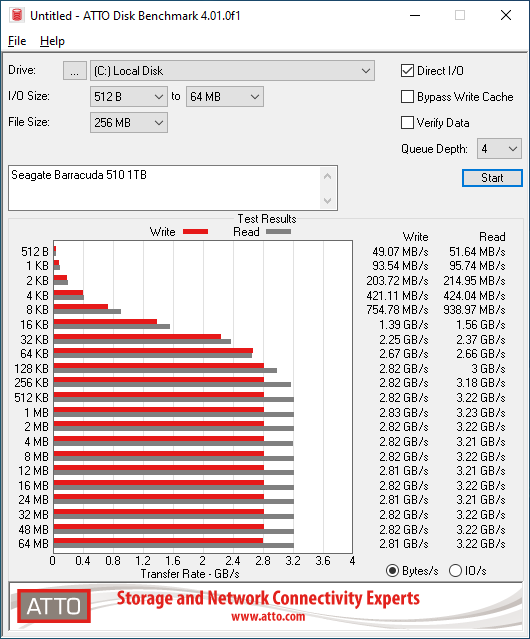
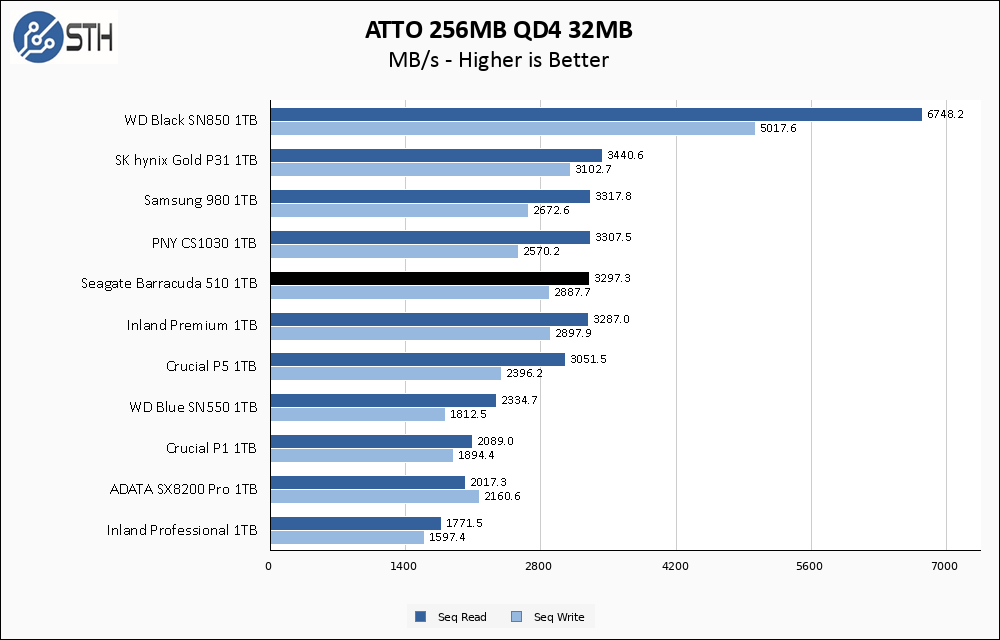
Similar to CrystalDiskMark, the Seagate Barracuda 510 1TB turns in results that have it competing with the best PCIe 3.0 SSDs we have reviewed. Both read and write results in ATTO are a tad bit slower than in CDM, but still reasonably close to the advertised rates.
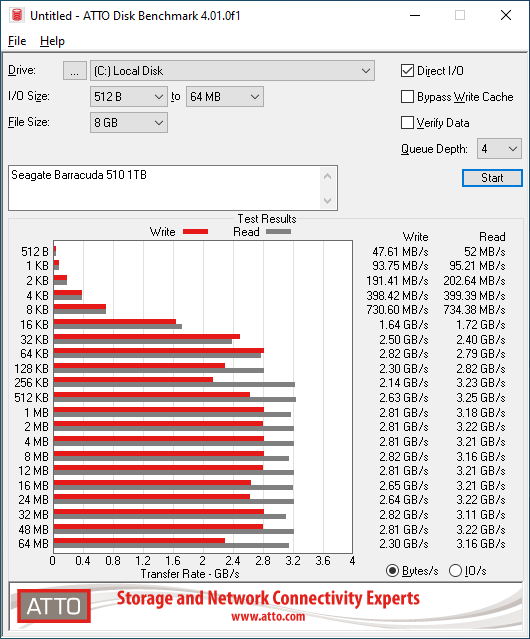
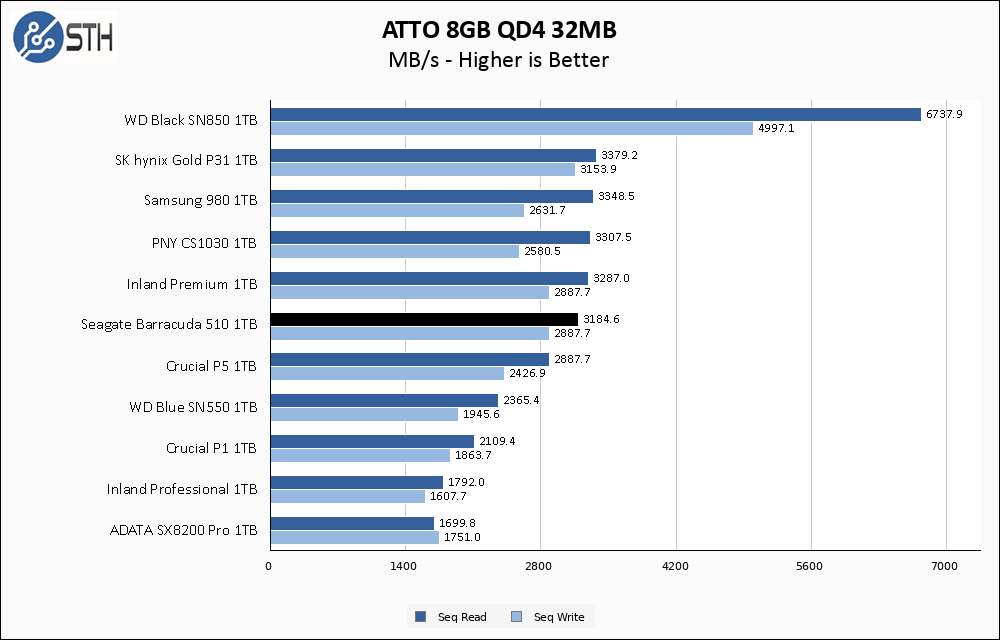
The larger ATTO test knocks the read performance of the Barracuda 510 down by a tiny bit, just enough that it falls to the bottom of the high-performance PCIe 3.0 pack rather than the middle. In reality these results are all close enough together that distinguishing between them is very difficult.
Anvil’s Storage Utilities
Anvil’s Storage Utilities is a comprehensive benchmark that gives us a very in-depth look at the performance of drives tested. This benchmark was run with both a 1GB and 8GB test size.
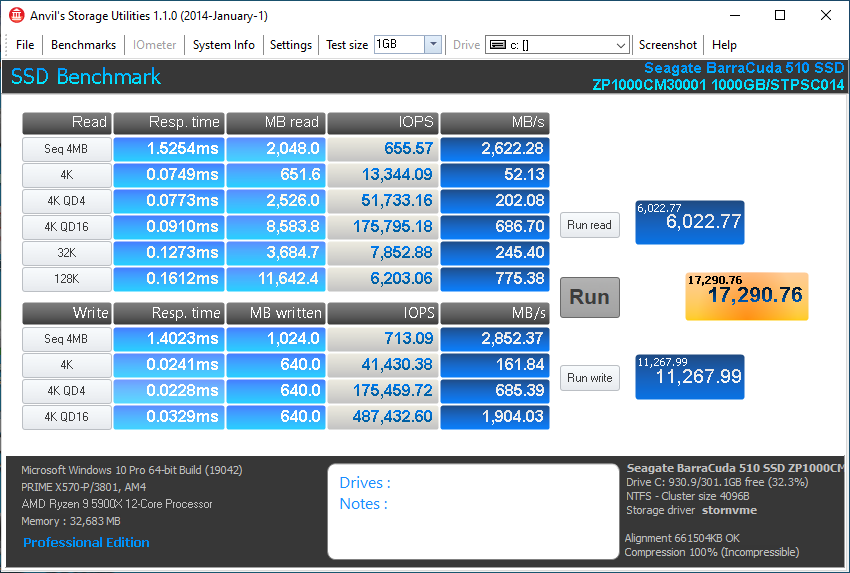
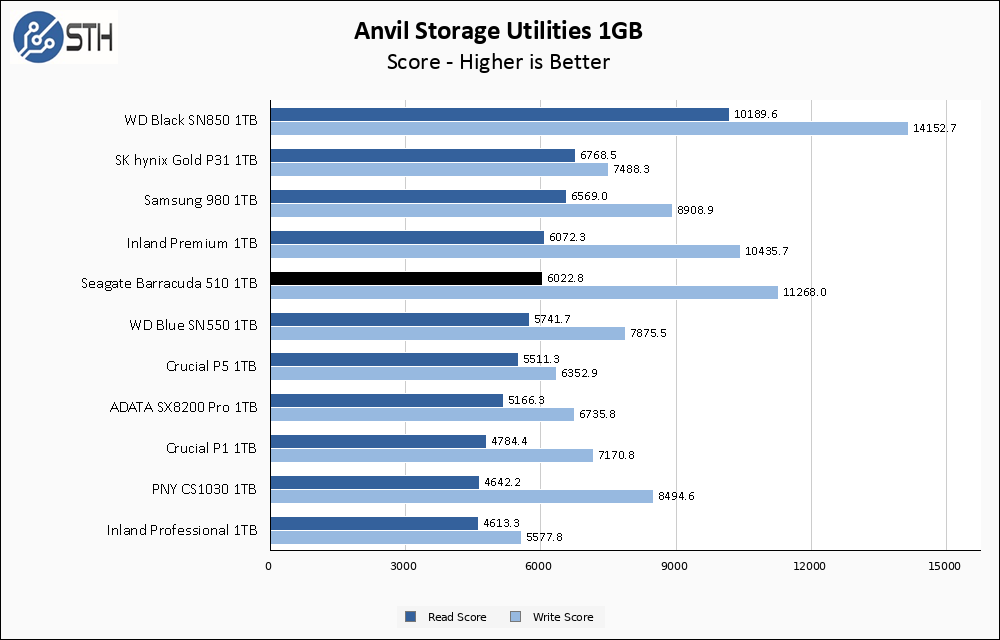
The traditional Phison controller excellence in Anvil write score is on full display here, with the Seagate Barracuda 510 turning in our top write score to date among PCIe 3.0 1TB SSDs. Read score remains a dead heat with the Inland Premium drive and very close overall with the other high-performance PCIe 3.0 drives.
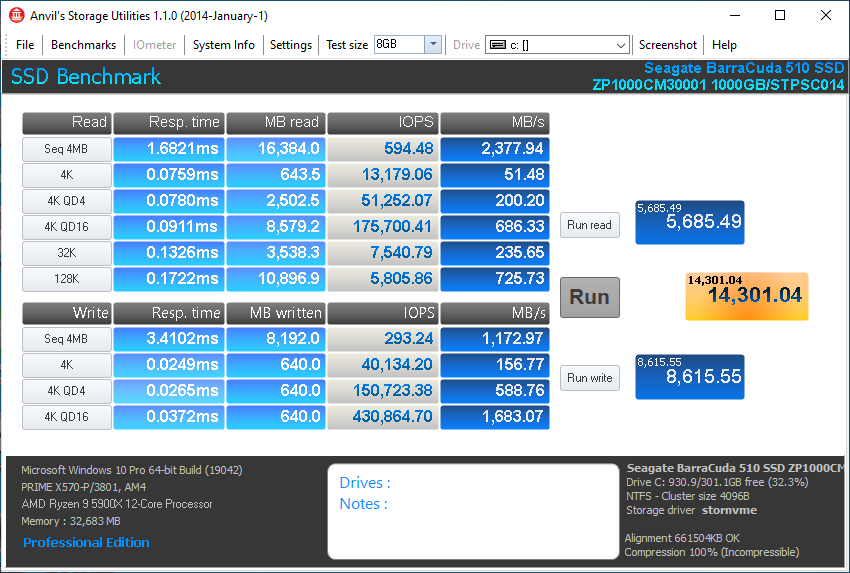
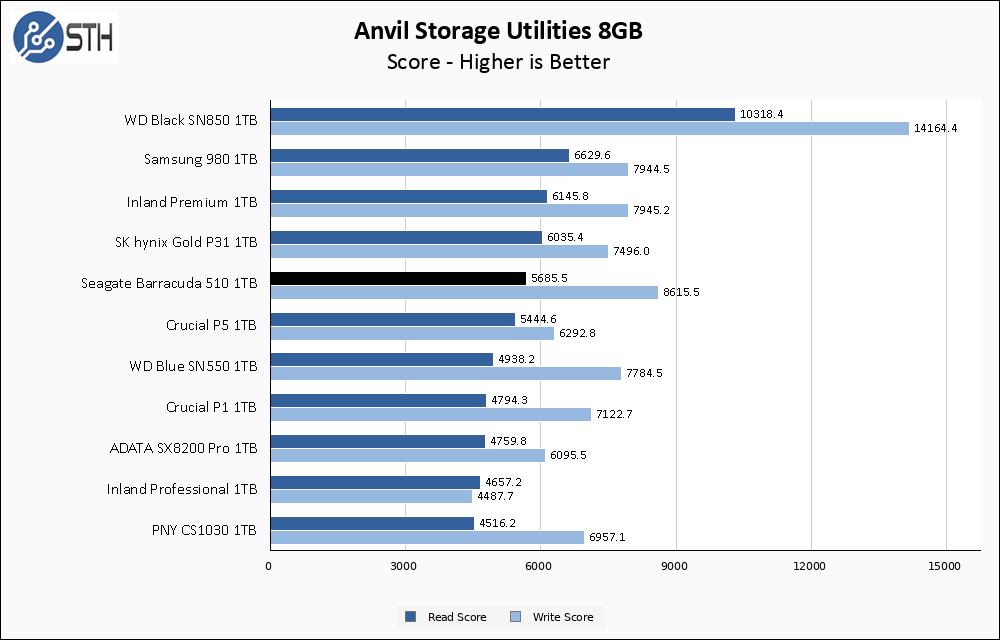
The larger Anvil test shows perhaps the most differentiation yet among the PCIe 3.0 pack, with the read score on the Barracuda 510 coming in a step behind most of its competitors. Write score remains chart-topping among the PCIe 3.0 drives.
AS SSD Benchmark
AS SSD Benchmark is another good benchmark for testing SSDs. We run all three tests for our series. Like other utilities, it was run with both the default 1GB as well as a larger 10GB test set.
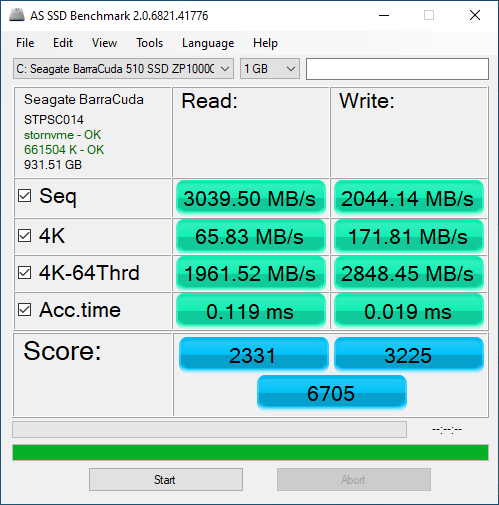
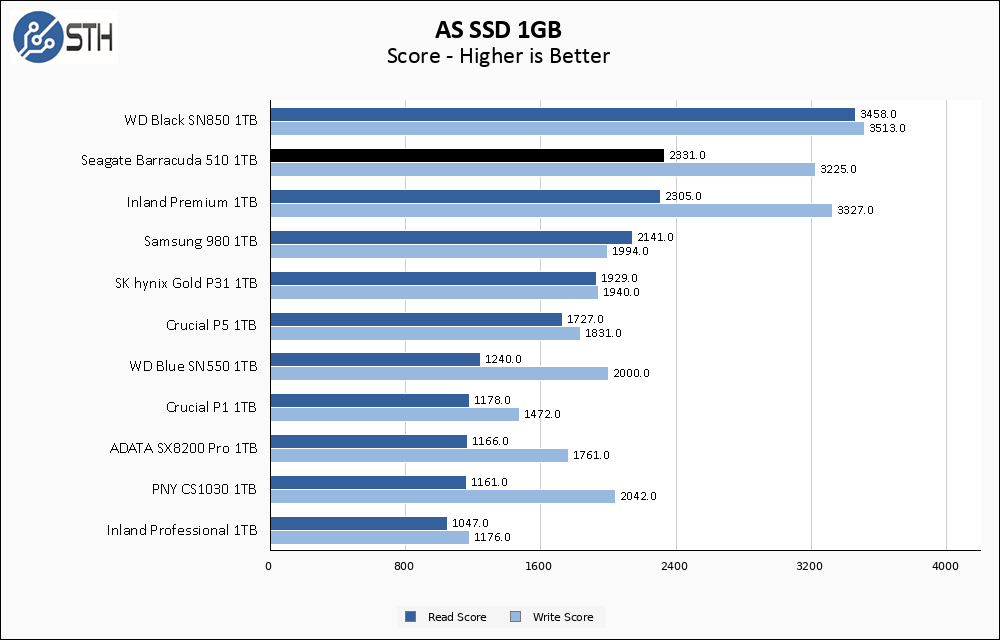
The Inland drive performed very well in AS SSD and the Seagate drive puts in just as good a show. The two drives turn in results likely within the margin of error for this benchmark.
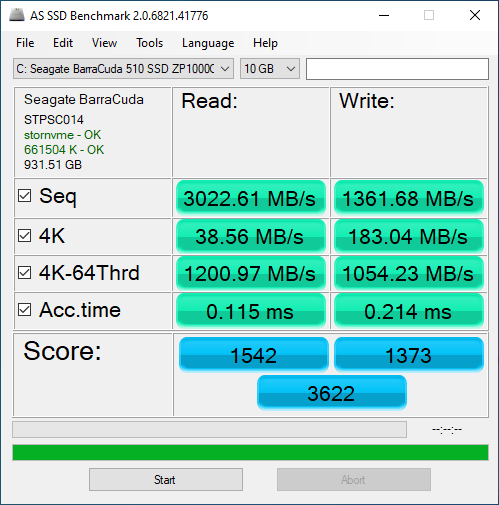
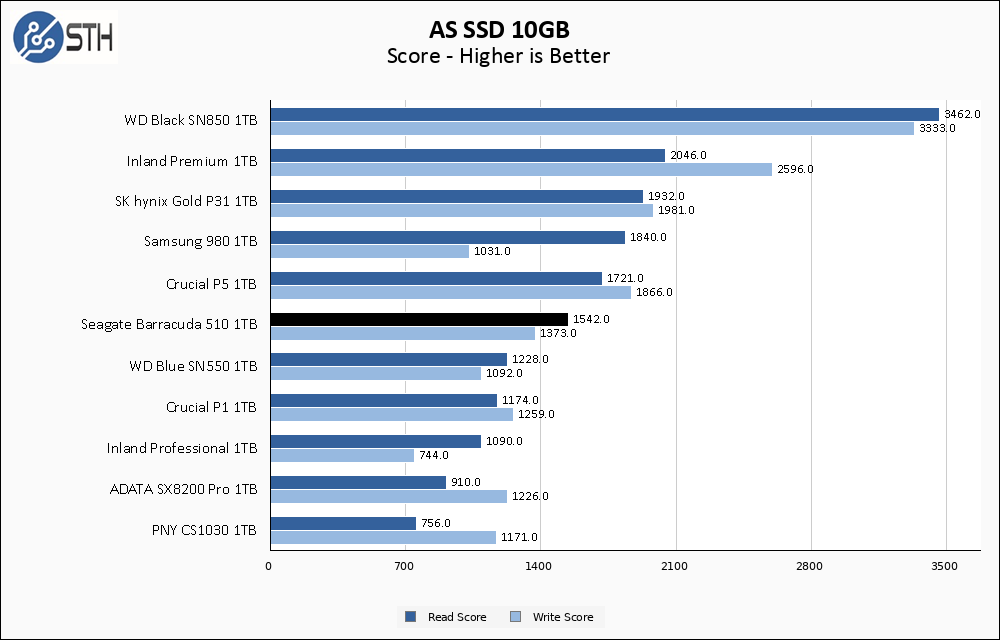
On the other hand, the Barracuda stumbles a bit compared to the Inland drive when it comes to the larger AS SSD test, suffering on both read and write scores. Performance is still fine, but this is the only test where the Seagate lost by a meaningful margin compared to the Inland drive.
SPECworkstation, thermals, and our conclusion are up next.


