
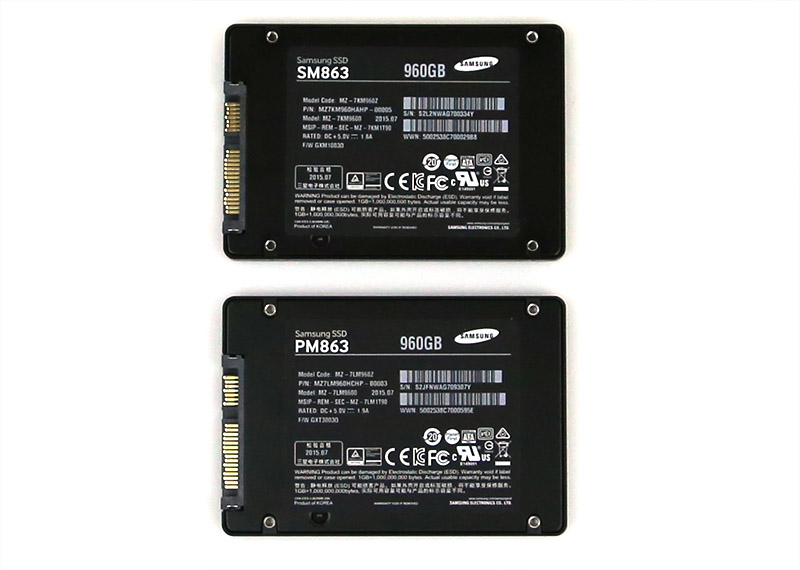
Recently we covered the launch of the Samsung SM863 and PM863 SSDs. These SATA III 6.0gbps SSDs are perhaps best known for their 1.9TB and 3.8TB maximum capacities. Samsung sent us two 960GB drives, one SM863 and one PM863 for performance testing. Today we have those results. We even have the results compared to other 800GB-960GB Samsung, Intel and SanDisk that we actually use in our datacenters. It is certainly one thing to try a drive in a lab, and yet another to run them in production.
Test Configuration
We used our standard dual Xeon E5 test bed for benchmarking. STH is slightly different than most other sites as we test SATA SSDs on an Avato/ LSI SAS3008 controllers not onboard Intel controllers. We have seen that lead to different performance over time. Here are the specs of the server:
- Motherboard: Gigabyte GA-7PESH3
- Processors: Dual Intel Xeon E5-2690 (V2)
- SAS Controller: LSI SAS 3008
- RAM: 64GB DDR3L-1600MHz ECC RDIMMs
- OS SSD: Kingston V300 240GB
The test server will likely undergo a refresh with either the Xeon E5 V4 or V5 generation but for our purposes, testing SATA SSDs, this is a solid platform given we are using the Avago/ LSI controller. We now have in excess of 60 SSDs benchmarked with this configuration making it hard to change.
Samsung SM863 and PM863 Benchmarks
We also had 8 other drives from Samsung, Intel and SanDisk that we were able to add to our comparison set. We limited our comparison set to SATA SSDs and larger capacities. To make the graphs a bit easier to digest, we are going to show only 6 drives for the AS SSD, ATTO and CrytstalDiskMark benchmarks and all 10 for the IOmeter detail.
AS SSD Benchmark
AS SSD is a solid benchmark that does not write compressible data to drives. The result is perhaps one of the best workstation SSD benchmarks available today.

Overall the new PM863 and SM863 960GB drives easily outpace their older counterparts. We will see this trend quite a bit in these benchmarks, but it is clear SATA III is severely limiting the speed of these drives.
CrystalDiskMark
CrystalDiskMark is another benchmark which gives non-compressible read/write numbers. This is in contrast to the ATTO Benchmark used by LSI/ Sandforce and its partners when they market a given solid state drive.
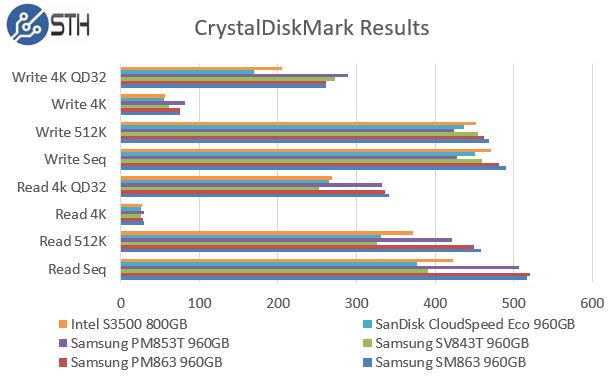
Here we can see some more separation between the new drives and older generations of drives like the SanDisk CloudSpeed Eco, Intel DC S3500 and Samsung SV843T.
ATTO Benchmark
The value of the ATTO benchmark is really to show the best-case scenario. ATTO is known to write highly compressible data to drives, which inflates speeds of controllers that compress data like LSI/ SandForce does prior to writing on a given solid state drive.
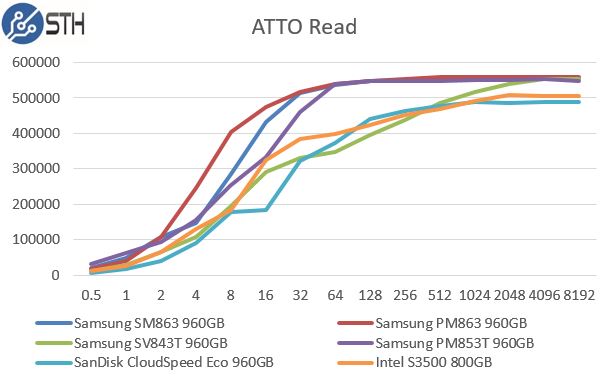
Here we can see the new Samsung PM863 and Samsung SM863 960 GB SSDs perform extremely well compared to the competition both at the top end but also at the lower end. As we look to write speeds:
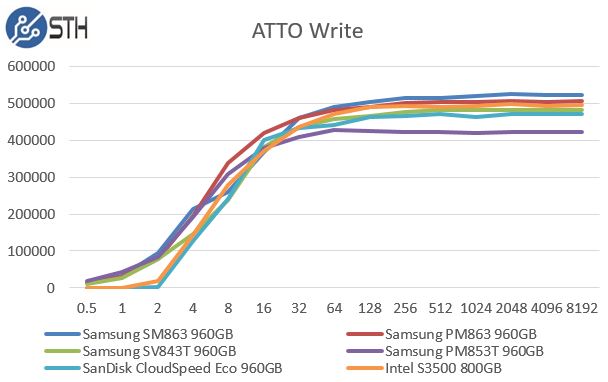
Here you can see Samsung’s continued dominance of the sub 4k space. Whereas we saw the Samsung PM853T plateau early, the new drives are capable of pushing the SATA III interface to the limit.
Iometer testing
We used our four standard profiles: database, web server, file server and workstation to test SSDs at queue depths of 4 t0 256. We do not test simple 4K write-only workloads because those workloads rarely, if ever, manifest themselves. Even a ZIL/ SLOG SSDs will experience reads as data is flushed to an array. We did make the lines for both the new Samsung drives easier to see by adding dashes and making them bold. It is a lot of data to consume.
Database profile
We love databases! We run a few databases for test results and running the site. Our database profile is 2/3 read, 1/3 write 8K transfers.

In raw IOPs the Samsung SM863 performs extremely well and the PM863 is vrey similar to the SV843. In two generations, the lower cost series of drives is catching up. When we pause and look at the impact from a MB/s perspective, we can see the read breakout having a very similar pattern. The QD8 to QD32 results for the SM863 are awesome.
We also broke out the write results and saw that the drives were roughly falling in the same magnitude of performance for write tests as well.
We were able to verify that the results we are seeing are not being overly skewed by excellent write or read performance. Instead, all of the drives in our 10 drive comparison fall roughly into the same pattern.
Web Server profile
We do build our own web servers and do extensively use Samsung SATA SSDs in the architecture. When looking at performance, we can see strong IOPS in this read test. Although 100% a read test, this test varies from 512B to 512KB transfer sizes.
This is an interesting pattern as in terms of write IOPS the Samsung SM863 and PM863 track relatively closely. We can see some of the older drives actually perform slightly better in this test.
Looking at the translation to the read MB/s we can see that no drive is hitting the ~550MB/s maximum of the SATA III interface, but the drives are not far off. This practically limits the amount of performance headroom engineers have on SATA III.
File Server profile
Swapping over to our File Server Iometer profile we can see the 80% read profile with varying transfer sizes (512B to 64KB) starts to show some separation.
Here we can see the SM863 continue to show extremely strong performance. At the QD4 and QD8 test sizes the two new Samsung drives perform exceptionally well. In most SMB servers hitting QD8 is hard let alone QD256 so that is the most relevant end of the spectrum to look at.
Workstation profile
In terms of workstation performance, we again see a pattern emerge.

The SM863 is an absolute monster for SATA III drives. We have seen the pattern in the past but the performance is very solid even at lower QD sizes.
Conclusion
Overall, both drives perform well. If one is looking for pure performance, today the option is NVMe. If you are looking for SATA SSDs, both the PM863 and SM863 provide solid options at larger capacities. For web hosting and big data clusters, the larger drives are going to be awesome from a cost/ capacity and storage density perspective. In terms of performance, the SM863 does perform much better than many of its competitors across workloads that one would expect to see these drives used for, especially at lower queue depths.


