
Recently we have been running a series on SAS SSDs we managed to purchase for $0.50 to $0.60/GB. We were able to snag four Samsung SM1625 SSDs for $100 each (and wish we bought the other four in stock) putting this unexpected purchase at $0.50/ GB, in line, or below most consumer drives. Today we are going to take one of the Samsung SM1625 200GB through our three quick benchmarks to get an initial view of performance. We will follow with RAID 0 results and more in-depth analysis in short order. Since this is now the 9th piece in this series, we are going to keep the amount of background information to a minimum. It should be noted that our test bed was setup for single-port operation. The Samsung SM1625’s boast up to 925MB/s sequential reads and 595MB/s sequential writes (see specs) when run in dual port configurations with supporting drivers, controllers and backplanes. We may publish dual port benchmarks with the mpio driver in the future but for now, we expect 550MB/s to be the maximum we can achieve with 6.0gbps single port configurations.
We are continually growing this data set but here are the benchmark runs thus far:
Single SAS SSD Benchmarks
- Pliant/ SanDisk Lightning 206s 200GB SLC SAS SSD benchmarks
- Seagate Pulsar.2 200GB MLC SAS SSD benchmarks
- Pliant/ SanDisk Lightning 406s 400GB SLC SAS SSD benchmarks
- Smart Storage System/ SanDisk Optimus 400GB MLC SAS SSD benchmarks
2 Drive RAID 0 Benchmarks
- 2x SanDisk Lightning 206s 200GB SAS SSD benchmarks
- 2x Seagate Pulsar.2 200GB SAS SSD benchmarks
- 2x Smart Storage System/ SanDisk Optimus 400GB MLC SAS SSD benchmarks
- 2x SanDisk Lightning 406s 400GB SAS SSD benchmarks
Our goal is to continue posting one more per week in-between other articles. We are also working on being able to add NVMe based SSDs to this as a comparison to state-of-the-art NAND storage. More on that shortly.
Test Configuration
Since we are going to assume the use of already released hardware, we are using a legacy system for testing across the test suite:
- Motherboard: Gigabyte GA-7PESH3
- Processors: Dual Intel Xeon E5-2690 (V2)
- SAS Controller: (onboard LSI SAS2008 in IR mode)
- RAM: 64GB DDR3L-1600MHz ECC RDIMMs
- OS SSD: Kingston V300 240GB
We did not use our Intel Xeon E5-2600 V3 platforms because this series started prior to the embargo being lifted on that platform. The Gigabyte’s LSI controller found onboard is the same as can be found in countless platforms and cards such as the IBM ServeRAID M1015 and LSI 9211-8i. We decided to use this controller since it is an extremely popular first-generation 6gbps SAS II controller. A major point here is that we are using a SAS controller. This means that one cannot compare results directly to consumer-driven setups where a SATA SSD is connected to an Intel PCH port. There is a latency penalty for going over the PCIe bus to a controller to SAS. It also is a reason NVMe is going to be a game changer in the enterprise storage space.
Samsung SM1625 200GB SSD Quick Benchmarks
For our quick tests during this part of the series we will just provide the quick benchmarks with only a bit of commentary. The results should be fairly straightforward and the index of previous articles in this series (linked above) is a good resource to compare against.
AS SSD Benchmark
AS SSD is a solid benchmark that does not write compressible data to drives. The result is perhaps one of the best workstation SSD benchmarks available today.
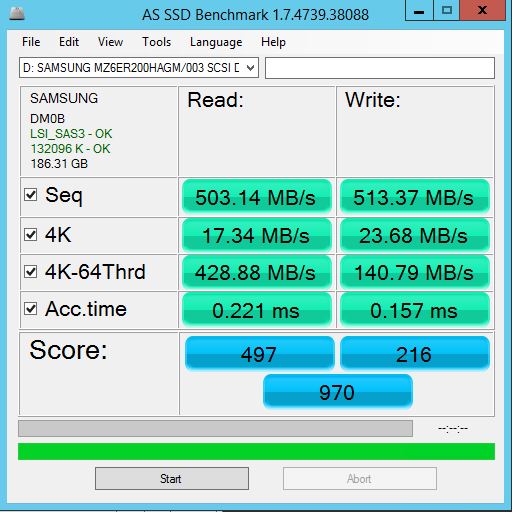
Here we see 500MB/s+ sequential read/ write speeds combined with solid 4K numbers. The sequential and 4K-64Thrd figures are anywhere from 50% to 100%+ higher than the Pliant/ SanDisk Lightning 200GB SLC drive and the Seagate Pulsar.2 200GB MLC drive. Moving to 4K, read speeds are similar to the other two drives but the 4K write speed of over 23MB/s compares to 19MB/s for the SanDisk offering and just under 2 MB/s for the Seagate offering.
CrystalDiskMark
CrystalDiskMark is another benchmark which gives non-compressible read/write numbers. This is in contrast to the ATTO Benchmark used by LSI/ Sandforce and its partners when they market a given solid state drive.
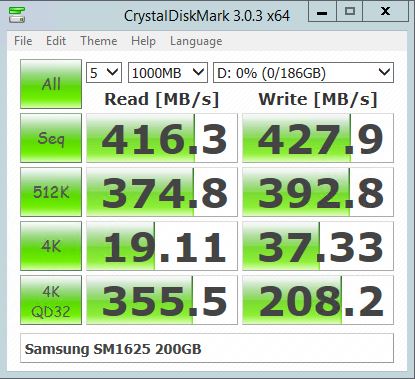
Likewise, CrystalDiskMark shows solid sequential figures. Neither the Seagate or SanDisk 200GB offerings hit 200MB/s on either the read or write tests. At 4K 32QD the Samsung unit has higher write speeds than the Seagate Pulsar.2 200GB.
ATTO Benchmark
The value of the ATTO benchmark is really to show the best-case scenario. ATTO is known to write highly compressible data to drives, which inflates speeds of controllers that compress data like LSI/ SandForce does prior to writing on a given solid state drive.
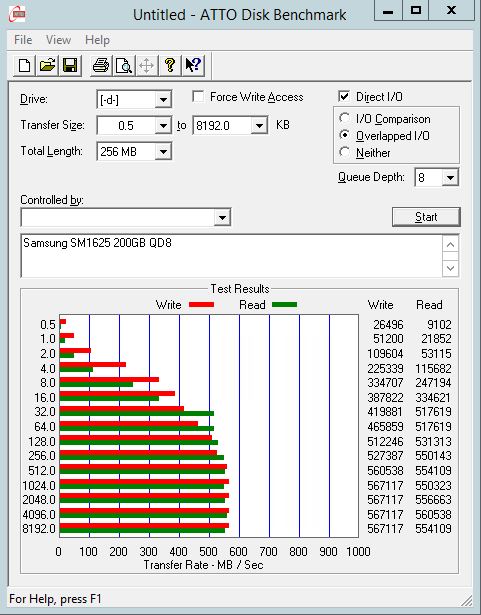
Here we see solid figures for the Samsung drive as we would expect. Samsung does have a capacitor backed write cache on the drive so it is able to essentially handle full 6.0gbps speeds. This is certainly a test where we want to see what a dual port connection to the drive could do, potentially increasing read speeds past 900MB/s per specs.
Conclusion
Performance thus far from the Samsung SM1625 200GB drive is excellent. The MLC NAND onboard has plenty of over provisioned space which helps the 20nm MLC drive hit write endurance of 10 full disk writes per day for five years. The drives are a thicker form factor, much like the SanDisk Lightning drives. For extremely dense backplanes (e.g. 6-in-1 5.25″ bay mobile racks) these Samsung drives will not fit. Other than that enclosure situation, they are certainly performing extremely well. Hopefully we will have the opportunity to try dual-port configurations soon. These drives were announced almost exactly two years ago, but they seem to be a great value in the $0.50 to $0.60 space.


 in a single-port configuration with our quick benchmarks. This is the 9th piece in our SAS SSD series)