Samsung 980 Pro 1TB Performance Testing
We test using both the default smaller test size as well as larger test sets on our benchmarks. This allows us to see the difference between lighter and heavier workloads.
CrystalDiskMark x64
CrystalDiskMark is used as a basic starting point for benchmarks as it is something commonly run by end-users as a sanity check.
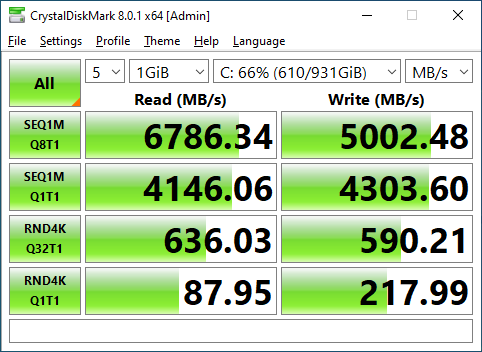
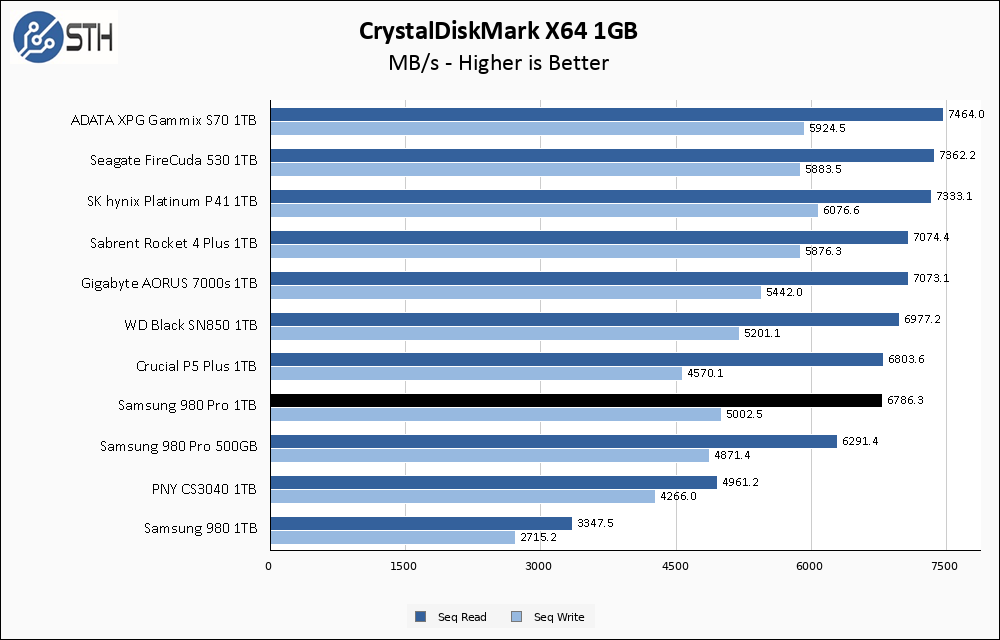
The Samsung 980 Pro 1TB comes in pretty close to its rated speeds. Read speeds are slightly under the rated line, but writes hit the mark almost exactly. Compared to other high-end drives the 980 Pro is a bit slower, but not to a large enough degree that it would bother most users.
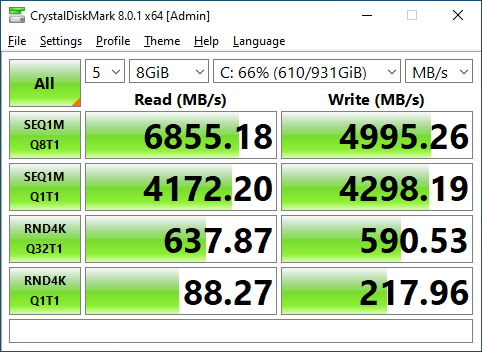
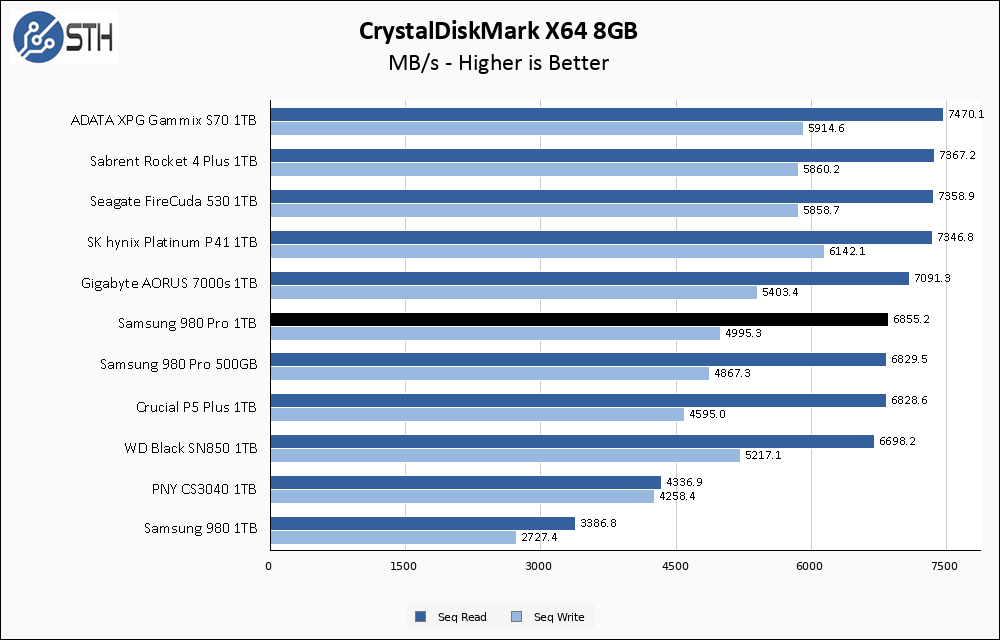
Performance improves slightly on the larger CrystalDiskMark test, and the 980 Pro is very close to its rated specs here. Relatively speaking this drive is mostly keeping up with the rest of the high-end Gen 4 crowd.
ATTO Disk Benchmark
The ATTO Disk Benchmark has been a staple of drive sequential performance testing for years. ATTO was tested at both 256MB and 8GB file sizes.
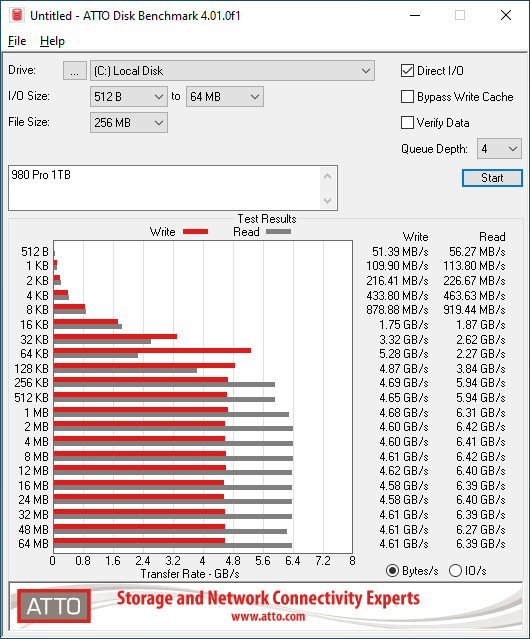
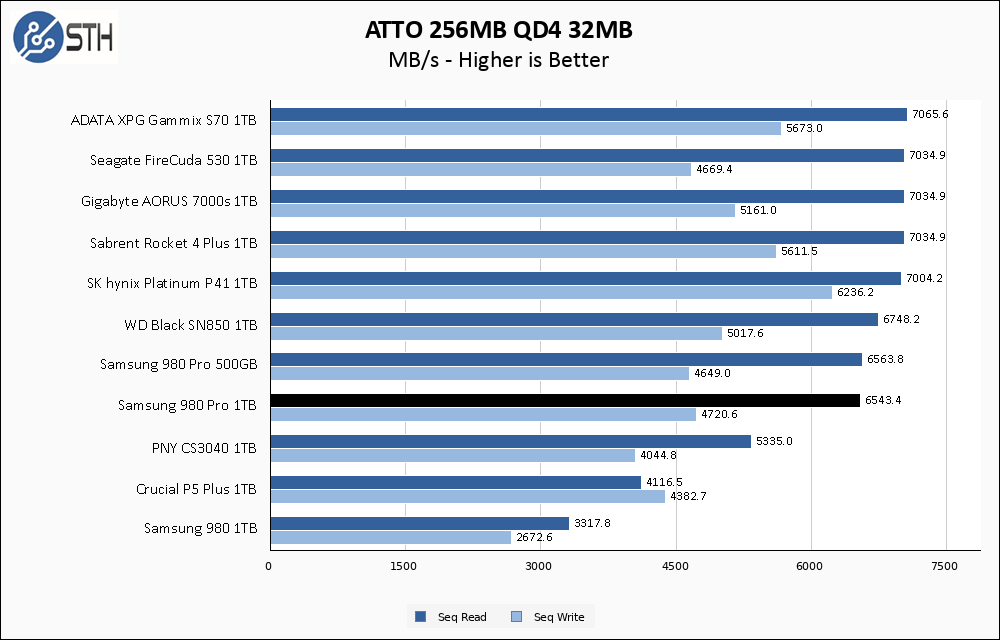
In ATTO once again the Samsung 980 Pro does pretty good, but seems to be a half step behind the other high-end drives.
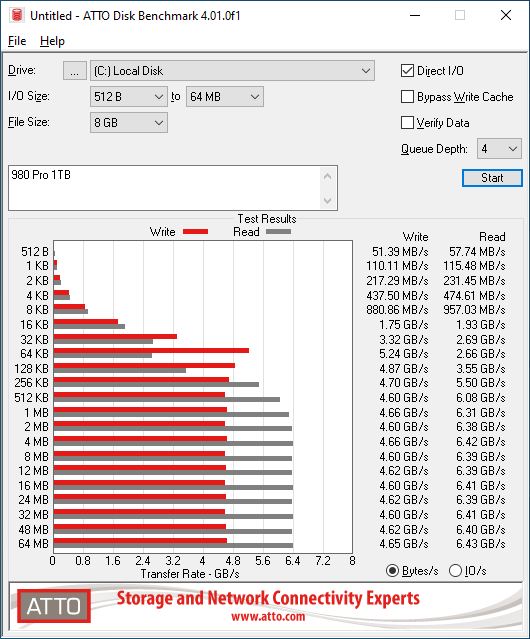
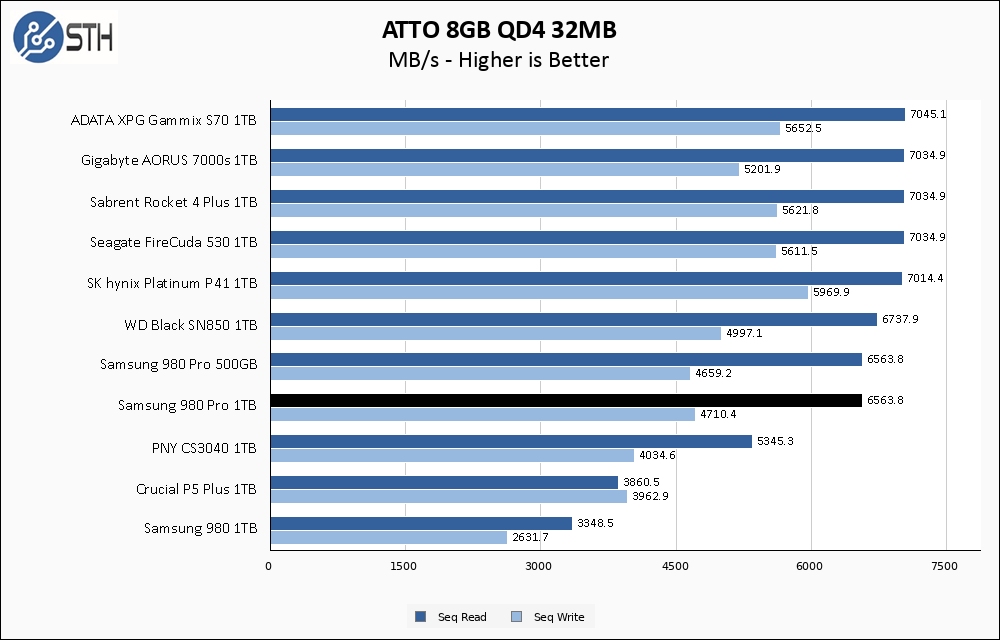
This pattern of keeping one step behind the leading pack holds for the larger ATTO test.
Anvil’s Storage Utilities
Anvil’s Storage Utilities is a comprehensive benchmark that gives us a very in-depth look at the performance of drives tested. This benchmark was run with both a 1GB and 8GB test size.

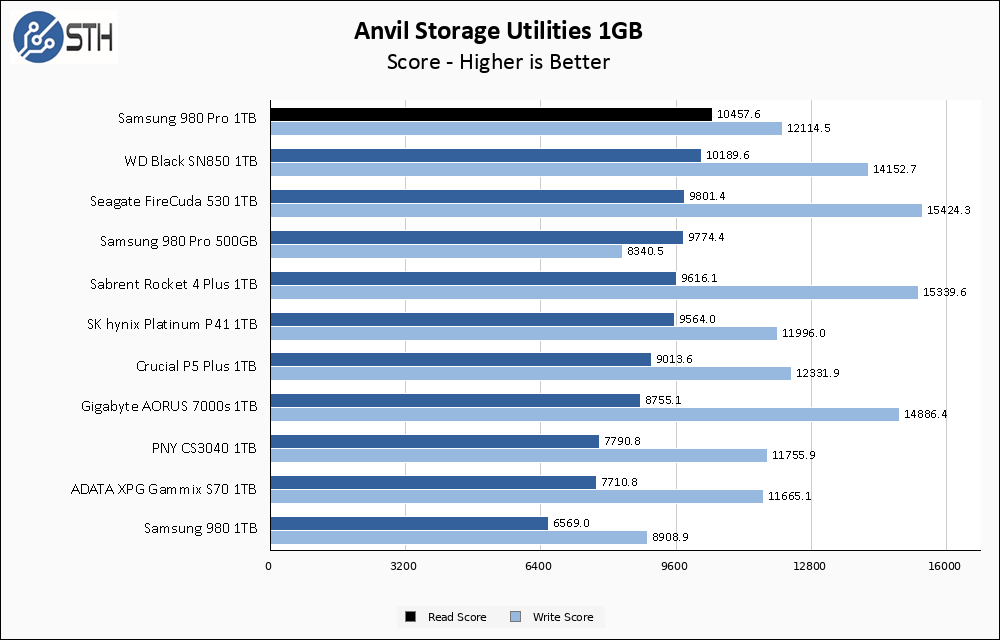
In Anvil, the Samsung 980 Pro 1TB finally has a moment to shine. Read score tops our chart, and write score is pretty good as well and manages to edge out the SK hynix Platinum P41.
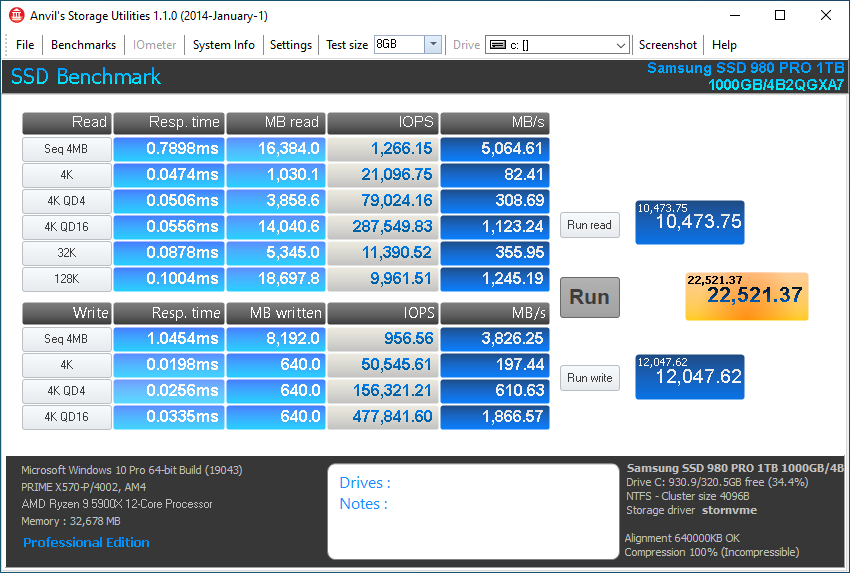
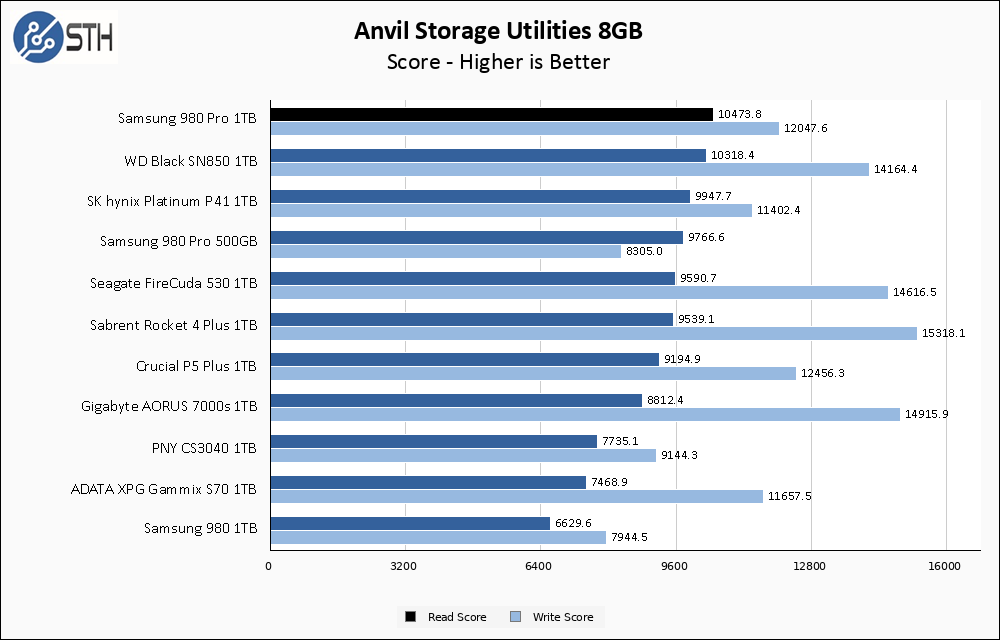
The good news in Anvil continues for the Samsung 980 Pro, which once again finds itself atop the chart. Read scores trail the Phison drives, but still manage to outpace the P41.
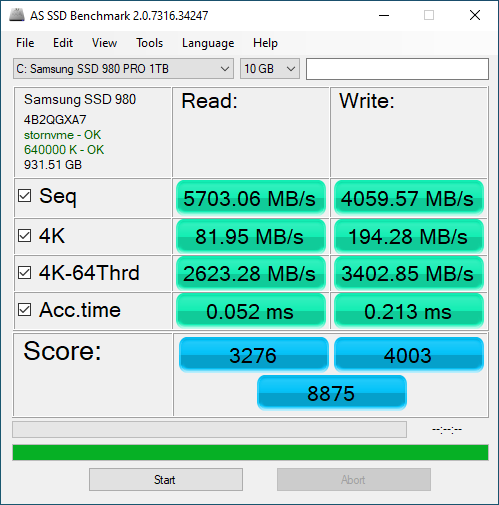
AS SSD Benchmark
AS SSD Benchmark is another good benchmark for testing SSDs. We run all three tests for our series. Like other utilities, it was run with both the default 1GB as well as a larger 10GB test set.

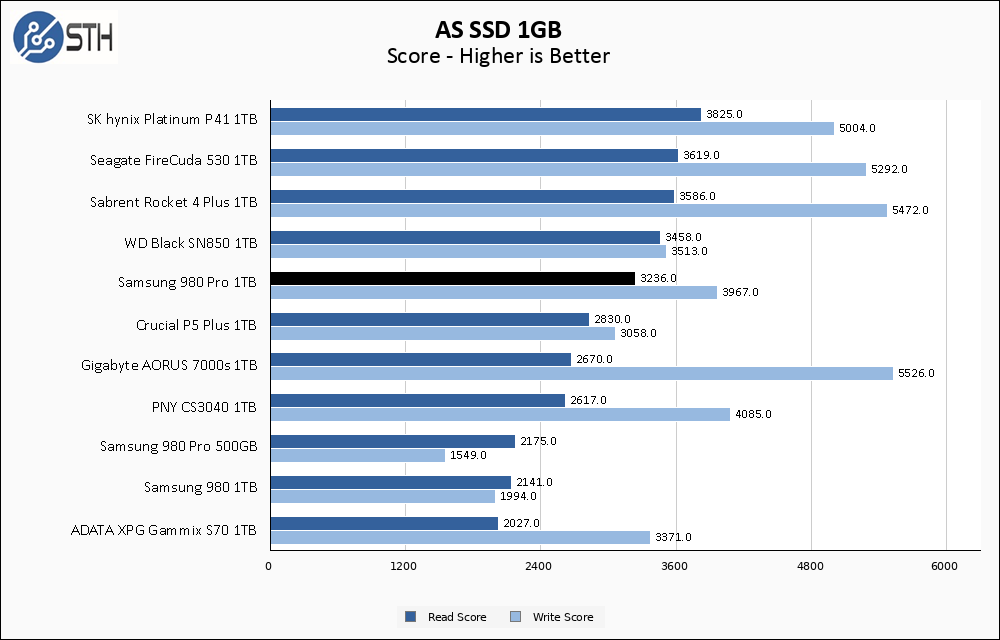
AS SSD is not quite as kind to the Samsung 980 Pro, and it turns in middle-of-the-pack results. Read score slightly trails the WD SN850, while slightly outpacing that drive in write performance. The P41 manages a commanding lead over the 980 Pro in this test.
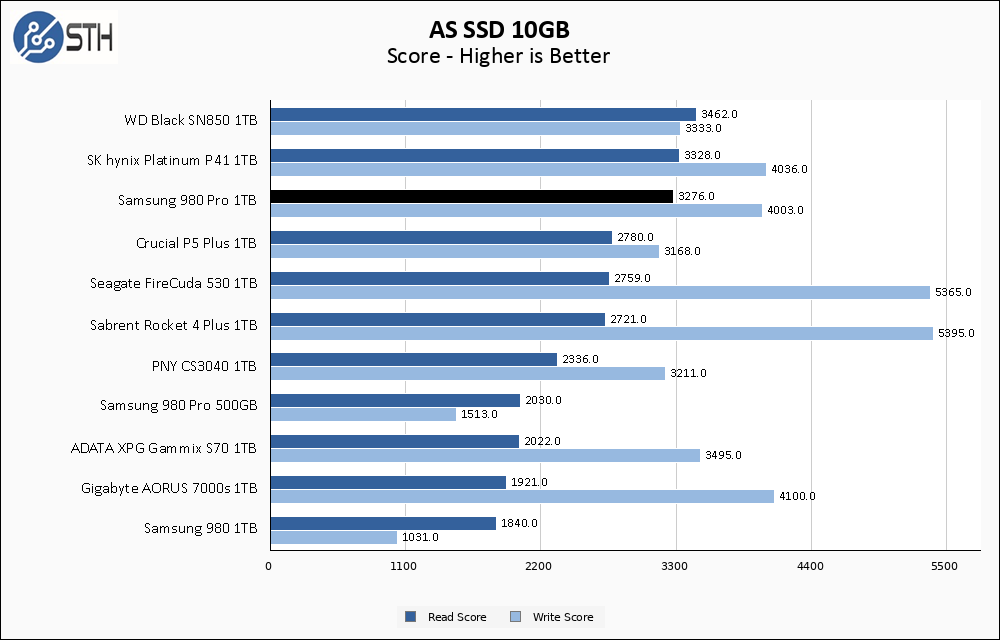
The Samsung 980 Pro performs a minor miracle and manages to improve its scores versus the smaller test. Almost every drive I test slips at least a small amount, and as a result, the 980 Pro moves up several positions on the chart.
SPECworkstation, thermals, and our conclusion are up next.


3bit MLC is TLC. samsung is trying to mask that they greatly reduced the endurance compared to 970 pro.
with that change there’s less reason to buy 980 pro compared to 980 evo plus
altmind: there is nothing like “980 evo plus”. Only “980pro”, or “980”. They might have the same cells (TBW is the same), but I guess there must be different controller (maybe more channels?), as 980pro has about twice higher iops and r/w…
I’ve noticed the white gloves in many of these SSD reviews.
Are the gloves to prevent scraping biometric fingerprint data from a close-up photo?
Do the gloves have antistatic properties?
Are the gloves intended to prevent the electrical contacts on the SSD from getting dirty?
Thanks for all the work. I’ve found these reviewers useful when making purchasing decisions.
Thanks for an interesting review. I was long wondering why samsung drives are missing on the graphs.
Eric,
The white gloves have a much more mundane explanation: my fingers always seem to be cut up or injured from one thing or another, so gloved white fingers look better than a bloody mess. When I bought my open-frame test bench it came with some white gloves, presumably because part of it is lexan and to prevent fingerprints, and at some point I was racking my brain on something different to use for a drive picture and decided just put on the gloves and hold the dang thing. That’s all :)
As a relatively new reader I am wondering why all the focus in these SSD reviews is on sequential read and write results? My understanding is that random read and access time is crucial to how fast a drive will perform and feel in daily use, so it would be nice to see those numbers compared in a graph. The instances where you’d be writing to the drive at 7+GBps in every day use would be small, while you will always be doing random reads and writes for booting, opening apps, saving documents, etc.
Great reviews, Will, thank you!
Interesting are the “post cache” writes, maybe you are able to plot those from the beginning of a test upto the point where the cache is full and the speeds do not change anymore, to determine cache size?
Also – how fast would the cache empty, e.g. you write 10 GB and wait 5 sec, then dump another few GB into the SSD.
JJ,
The ‘focus’ as you put it is on sequential numbers because they are the statistic most commonly cited by manufacturers as a performance metric; the front of the box on the SSD will say “7000 MB/s” on it, not quote a 4K random read number. I provide some focus here because I like to ensure manufacturers ‘do what they say’ and actually hold up their end of the bargain. In addition, random performance is harder to directly quantify because there are a bunch more factors that play in that are workload specific. With that said, 3 of my tests (Anvil, ASSSD, and SPEC) are all heavily influenced by non-sequential performance, so I don’t feel like I ignore that aspect of the performance.
Jay,
There are benchmark utilities that can track write speed across an entire disk like that, but the method I use to perform this test does not have that capability. I use multiple instances of a utility for creating randomized data – not a benchmark utility – and then just measure disk performance ‘from the side’ by looking at task manager. I will eventually run into performance problems with this method; my ability to generate random data is CPU limited and tops out at around 5 GB/s, so when SSDs can sustain write speeds at 5 GB/s or greater I’ll have to change methodologies or get a faster CPU.
As for how fast the cache will empty, that depends on a bunch of factors. If the drive is at a reasonable percentage of use – like 60-80% full – and TRIM has been run somewhat recently (Windows runs it weekly by default) then if you write out 10 GB of data it should get ‘unspooled’ from the cache relatively quickly. This behavior is somewhat unofficially tested as part of my benchmarks – after filling the drive and then reducing to the testing capacity (between 60% and 70% full) I very rapidly run all the benchmarks back-to-back, not allowing the drive time to idle. Some drives with poor cache handling do not respond well to this and it shows up in their results.
Will, Appreciate your thoughtful testing procedures. As I deal with upgrades frequently for older systems I run into RAM maxed out and SSDs needed for swapping/paging, where any Cache helps.
I would certainly go for the SK Hynix P41 over this Samsung 980 Pro, as of which you can’t call the endurance pro. Samsung is preferring price/volume over quality/endurance.
Works great on Windows 7 with a Microsoft hot fix then the nvme driver installed I get over 6, 000 mb read and writes Dell 5570 i7
Users should update firmware
Samsung recommends users to upgrade to the current version 5B2QGXA7. The firmware update is possible via Samsung’s Magician SSD tool (download at the end of the message). The user data is actually retained, but a backup is always recommended before a firmware update, just in case.
According to the investigations by Puget Systems, 980 Pro with the firmware versions 4B2QGXA7 and the said 5B2QGXA7 should not be affected.
It’s too late for those affected
However, if the SSD has already failed, which is usually reflected in the fact that the 980 Pro (test) is suddenly in read-only mode, this solution comes too late. The firmware update can prevent the problem from occurring, but cannot reverse it if a drive has already failed.
I had one of these. It was great at first but then it wouldn’t boot correctly. Read another article about issues with dependability
Comments are closed.