Micron 65000 ION 30.72TB Basic Performance
For this, we are going to run through a number of workloads just to see how the SSD performs. We also like to provide some easy desktop tool screenshots so you can see the results compared to other drives quickly and easily.
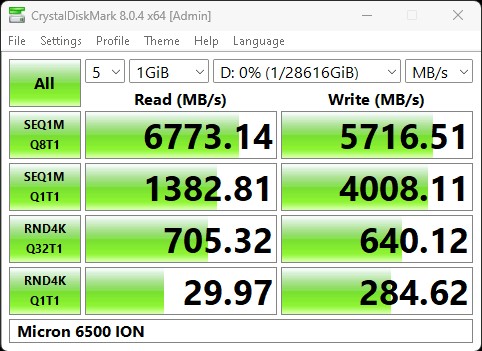
CrystalDiskMark 8.0.4 x64
CrystalDiskMark is used as a basic starting point for benchmarks as it is something commonly run by end-users as a sanity check. Here is the smaller 1GB test size:
Here is the larger 8GB test size:
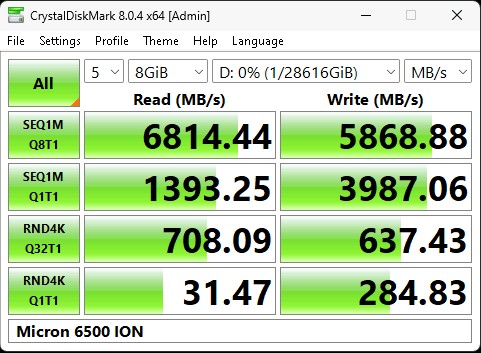
This may seem trivial to some, but if you saw our recent Solidigm D5-P5430 15.36TB SSD PCIe Gen4 NVMe SSD review, the Solidigm drive did much better on the 8GB than the 1GB test size. For Micron, one can point to differences, but these two screenshots are great examples of how there was not a huge change in a result between runs.
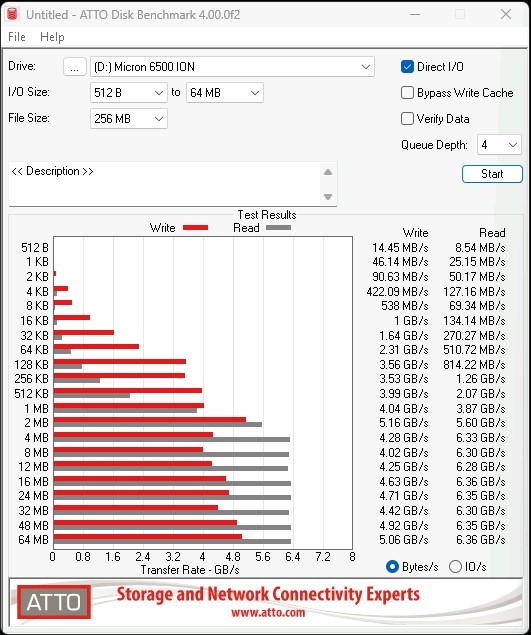
ATTO Disk Benchmark
The ATTO Disk Benchmark has been a staple of drive sequential performance testing for years. ATTO was tested at both 256MB and 8GB file sizes.
Here is the larger 8GB file size, which seems very small for a 30.72TB SSD.
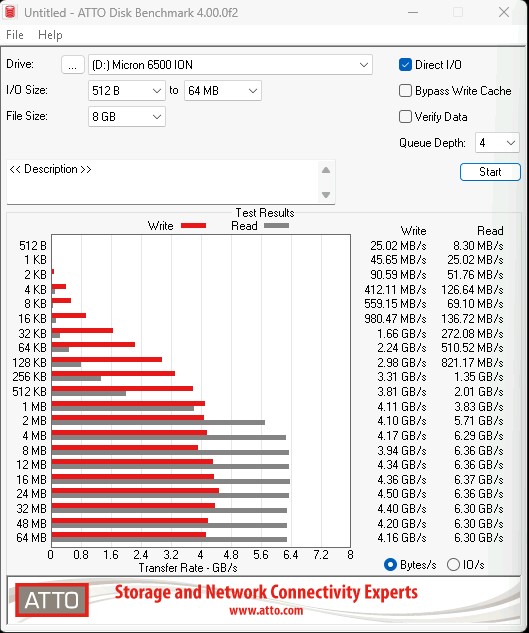
Here perhaps the biggest points are that reads are much faster than writes, as we would expect. Also, the write speed varies a lot between the 1MB and 64MB test sizes. Many SSDs we see are flat in this range.
AS SSD Benchmark
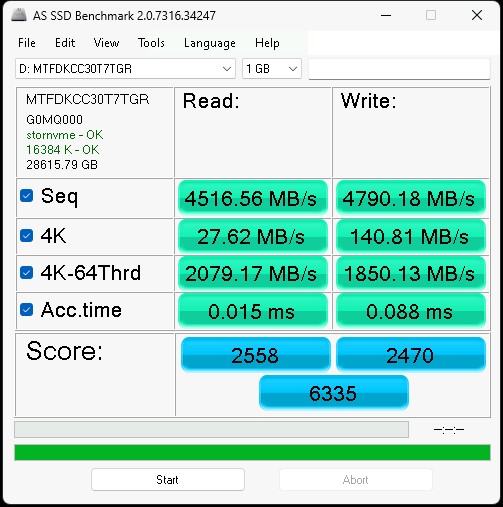
AS SSD Benchmark is another good benchmark for testing SSDs. We run all three tests for our series. Like other utilities, it was run with both the default 1GB as well as a larger 10GB test set.
Here is the 10GB result:
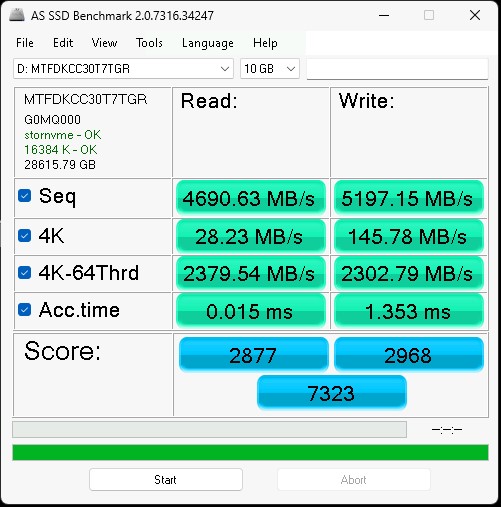
Here the Micron drive puts in a decent performance, but we did not learn much with these runs.
Next, let us get to some higher-level performance figures.
Micron 6500 ION 15.36TB Performance
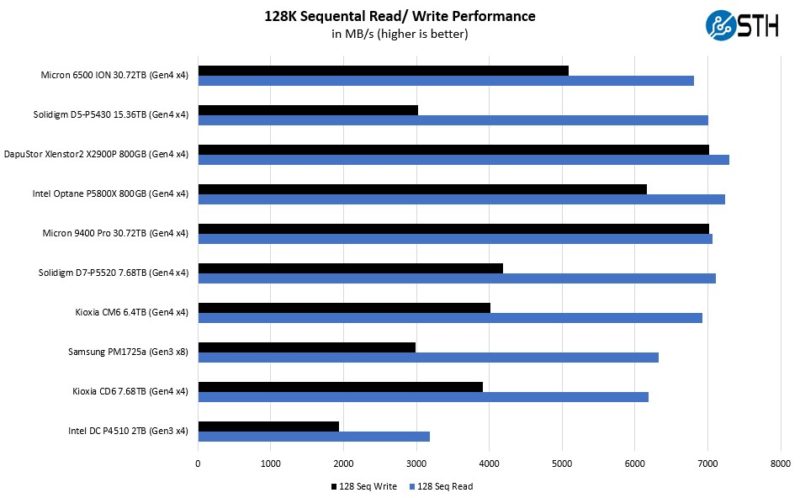
Our first test was to see sequential transfer rates and 4K random IOPS performance for the Micron 6500 ION. Please excuse the smaller-than-normal comparison set. In the next section, you will see why we have a reduced set. The main reason is that we swapped to a multi-architectural test lab. We actually tested these in 20 different processor architectures spanning PCIe Gen4 and Gen5. Still, we wanted to take a look at the performance of the drives.
Here is the 4K random IOPS chart:
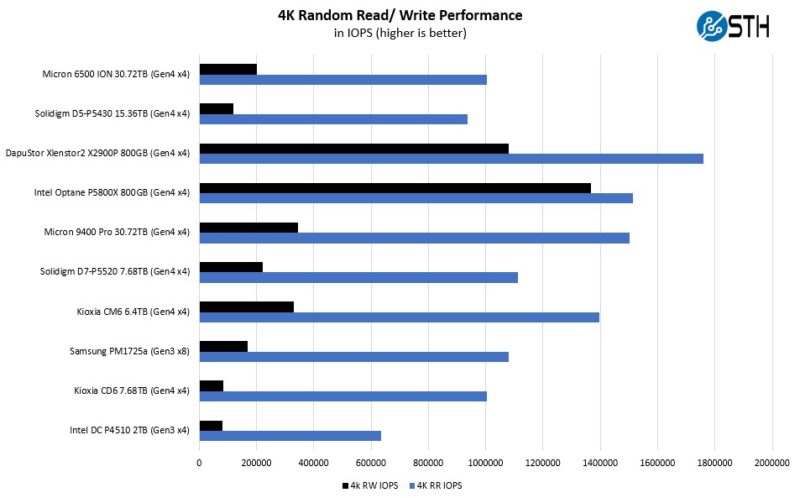
The big takeaway here is that the Micron 6500 ION feels like an in-between drive. It is not the mega write endurance drive like Optane or the DapuStor. It is also notably slower than the Micron 9400 Pro that we reviewed.
At the same time, it is faster than many of the slower QLC drives that are solely focused on capacity. Usually, the in-between drives tend to sell well, and so the Micron 6500 ION makes a lot of sense.
Micron 6500 ION 30.72TB Application Performance Comparison
For our application testing performance, we are still using AMD EPYC. We have all of these working on x86 but we do not have all working on Arm and POWER9 yet so this is still an x86 workload.
As you can see, there are a lot of variabilities here in terms of how much impact the Micron has on application performance. Let us go through and discuss the performance drivers.
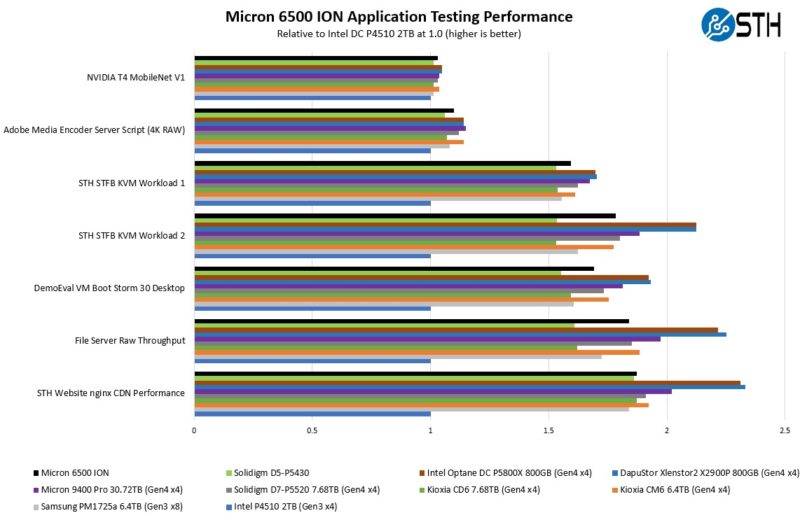
On the NVIDIA T4 MobileNet V1 script, we see very little performance impact on the AI workload, but we see some. The key here is that the performance of the NVIDIA T4 mostly limits us, and storage is not the bottleneck. We have a NVIDIA L4 that we are going to use with an updated model in the future. Here we can see a benefit to the newer drives in terms of performance, but it is not huge. That is part of the overall story. Most reviews of storage products are focused mostly on lines, and it may be exciting to see sequential throughput double in PCIe Gen3 to PCIe Gen4, but in many real workloads, the stress of a system is not solely in the storage.
Likewise, our Adobe Media Encoder script is timing copy to the drive, then the transcoding of the video file, followed by the transfer off of the drive. Here, we have a bigger impact because we have some larger sequential reads/ writes involved, the primary performance driver is the encoding speed. The key takeaway from these tests is that if you are mostly compute-limited but still need to go to storage for some parts of a workflow, the SSD can make a difference in the end-to-end workflow.
On the KVM virtualization testing, we see heavier reliance upon storage. The first KVM virtualization Workload 1 is more CPU limited than Workload 2 or the VM Boot Storm workload, so we see strong performance, albeit not as much as the other two. These are KVM virtualization-based workloads where our client is testing how many VMs it can have online at a given time while completing work under the target SLA. Each VM is a self-contained worker. We know, based on our performance profiling, that Workload 2, due to the databases being used, actually scales better with fast storage and Optane PMem. At the same time, if the dataset is larger, PMem does not have the capacity to scale, and it is being discontinued as a technology. This profiling is also why we use Workload 1 in our CPU reviews. Micron’s blistering random IOPS performance is really helping here. On Workload 2, and the VM Boot Storm, we see the performance of the new drives really shine. These drives are very fast.
Moving to the file server and nginx CDN, we see much better QoS and throughput from the Micron 6500 ION than the Solidigm D5-P5430. On the nginx CDN test, we are using an old snapshot and access patterns from the STH website, with caching disabled, to show what the performance looks like in that case. Here is a quick look at the distribution:
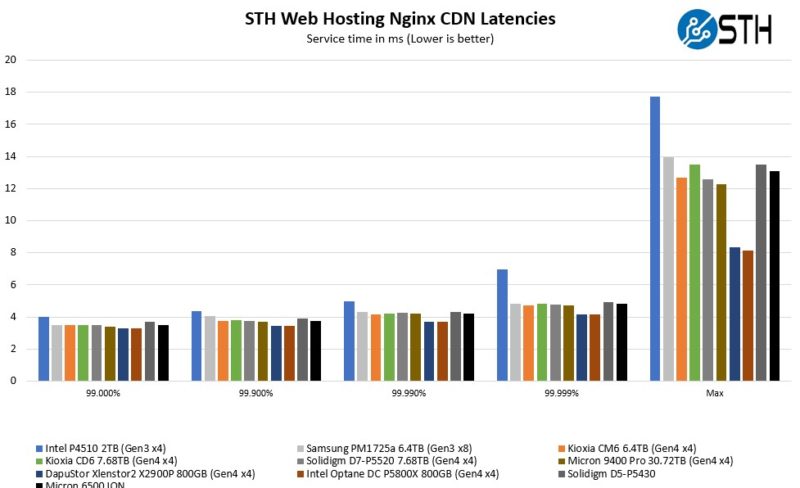
Here we can see the Micron drive did better than the Soldigim throughout the range, but the Micron 9400 Pro was faster. Again, for the absolute lowest latency, we would suggest looking at some of the more exotic, but smaller drives.,
Now, for the big project: we tested these drives using every PCIe Gen4 architecture and all the new PCIe Gen5 architectures we could find, and not just x86, nor even just servers that are available in the US.


Does page 2 contain a left-over cloned heading from an earlier review?
Solidigm D5-P5430 15.36TB Performance
Yeah, the E1.S and U.3 have a slight speed and throughput benefit over m.2 NVMe, but the fact that QLC is advertised for servers is abominable. I wouldn’t even put TLC in one. I don’t know, can’t people do simple math anymore?
My first experience with QLC was with a pair of Solidigm P41 Plus drives. I figured the heritage of the parentage would count for something. It did not. Drives were returned. So inconsistent they might as well have been faulty.
@namer
As a server admin I would happily use these as the capacity drives in a vSAN array. TLC are just fine as well. In fact aot of the top drives in servers are TCL. You just have to look at use case and go from there.
Na
Ok tcl
Ummm
Comments are closed.