Memblaze 7940 30.72TB PCIe Gen5 NVMe Performance
For this, we are going to run through a number of workloads just to see how the drive performs. We would also like to provide some easy screenshots of the desktop tool so you can see the results quickly and easily compared to other drives you may have.
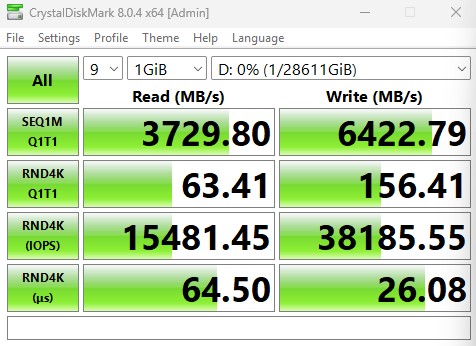
CrystalDiskMark 8.0.4 x64
CrystalDiskMark is used as a basic starting point for benchmarks as it is something commonly run by end-users as a sanity check. Here is the smaller 1GB test size:
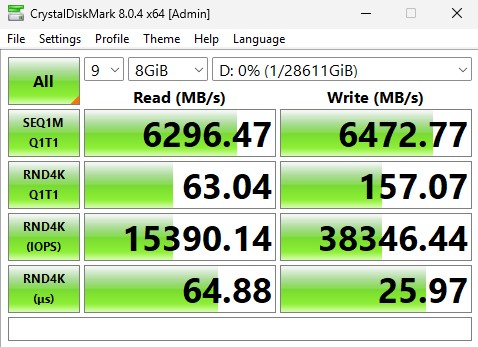
Here is the larger 8GB test size:
In the event you want to see a side-by-side, here they are:
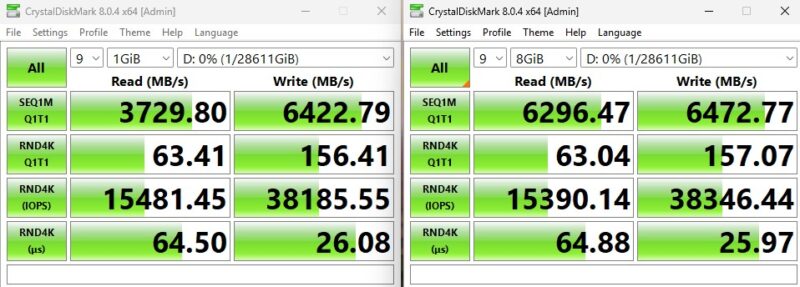
Soemthing worth noting here is that this is an example where the simple desktop benchmarking tools are not putting sufficient load on a drive. We show these solely so folks can do quidk comparisons, but as you will see, these figures are substantially below what we got in other benchmarks.
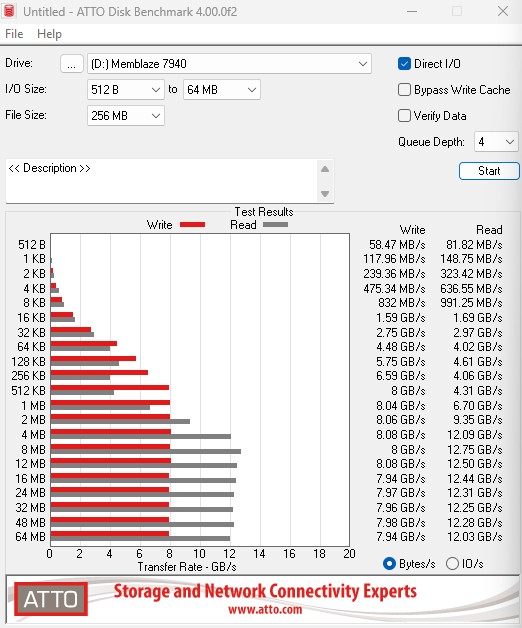
ATTO Disk Benchmark
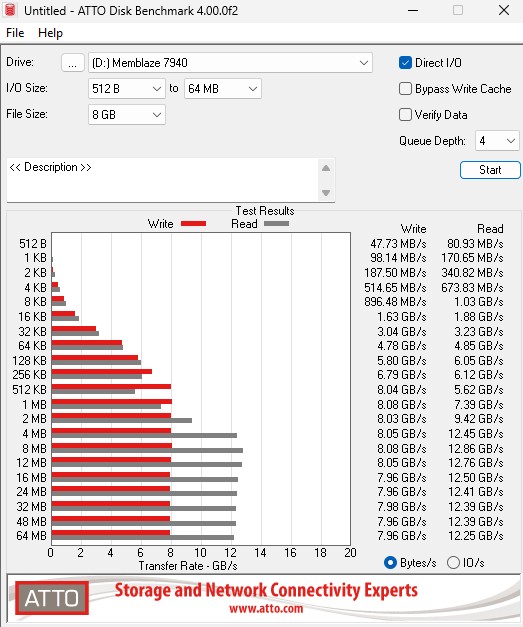
The ATTO Disk Benchmark has been a staple of drive sequential performance testing for years. ATTO was tested at both 256MB and 8GB file sizes.
Here is the 8GB result:
For those who want to see the results compared side-by-side:
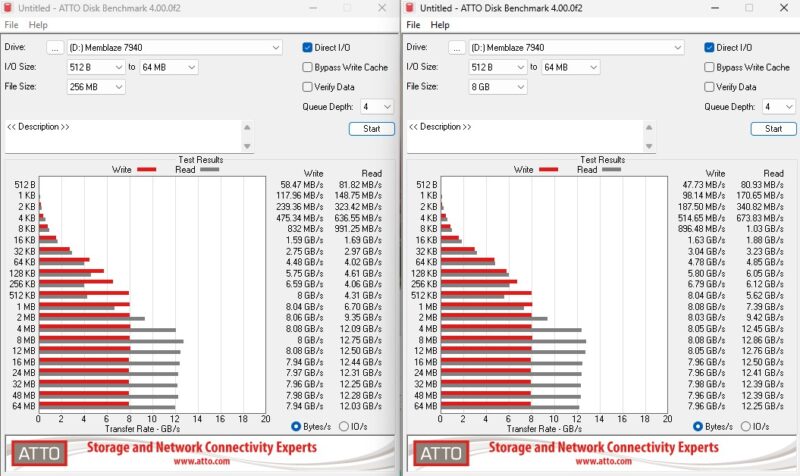
In ATTO, something to note is that the performance was actually better on the “larger” test size. 8GB is small on a 30.72TB drive, but we can see the sequential figures notably increase. The sequential reads here are twice what they were on CrystalDiskMark as an example.
AS SSD Benchmark
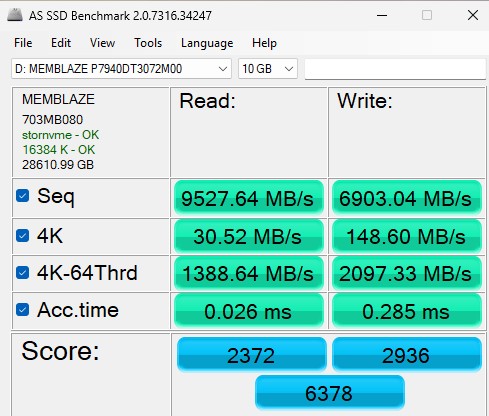
AS SSD Benchmark is another good benchmark for testing SSDs. We run all three tests for our series. Like other utilities, it was run with both the default 1GB as well as a larger 10GB test set.

Here is the 10GB test size:
Again, here is the side-by-side.
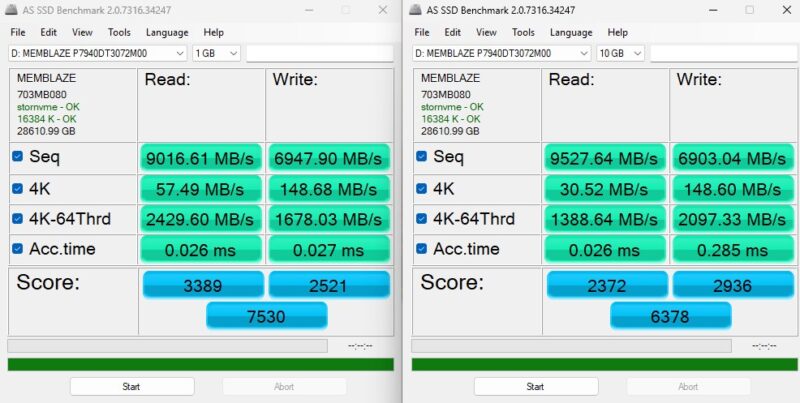
Here we can see results somewhere between CrystalDiskMark and ATTO. Again, we are just showing these for a quick comparison, but let us now get to Linux where we will really start to push the drives with fio and real-world applications.
Next, let us get into some of our Linux-based benchmarking.
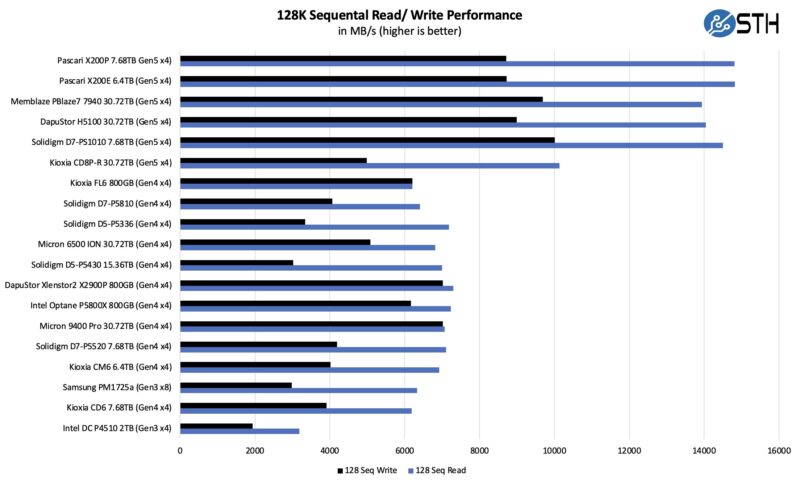
Memblaze 7940 30.72TB Four Corners Performance
Our first test was to see sequential transfer rates and 4K random IOPS performance for the Memblaze. Please excuse the smaller-than-normal comparison set. In the next section, you will see why we have a reduced set. The main reason is that we swapped to a multi-architectural test lab. We test these in 17 different PCIe Gen5 processor architectures. Still, we wanted to take a look at the performance of the drives.
Here is the 4K random read-and-write performance:
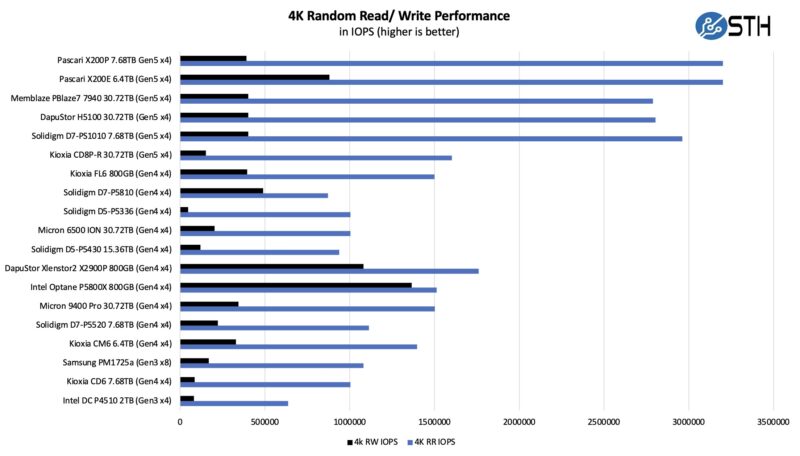
Once we started getting into the more common performance evaluation metrics, we started to see performance very close to the spec sheet. This is what we would expect given that these drives are meant for heavier sustained workloads than desktop tools generate.
Memblaze 7940 30.72TB Application Performance Comparison
For our application testing performance, we are still using AMD EPYC.
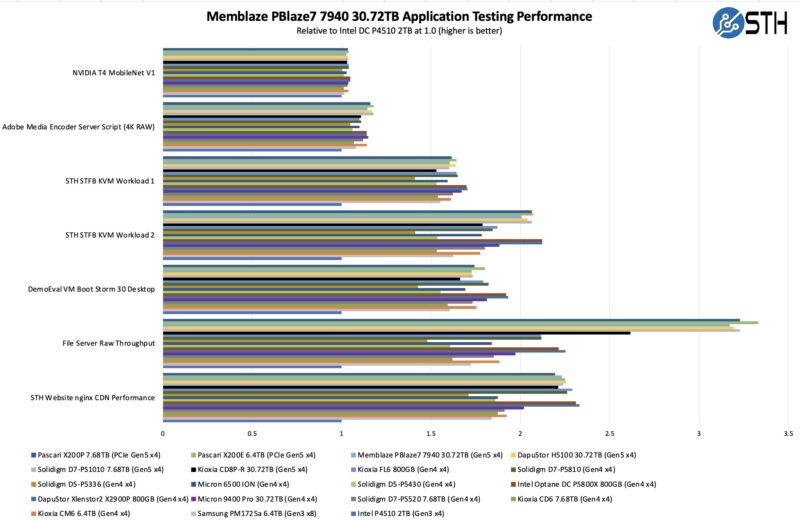
As you can see, there are a lot of variabilities here in terms of how much impact the SSD has on application performance. Let us go through and discuss the performance drivers.
On the NVIDIA T4 MobileNet V1 script, we see very little performance impact on the AI workload, but we see some. The key here is that the performance of the NVIDIA T4 mostly limits us, and storage is not the bottleneck. We need to update the GPU on this one, but perhaps that happens in the PCIe Gen6 generation at this point. Here we can see a benefit to the newer drives in terms of performance, but it is not huge. That is part of the overall story. Most reviews of storage products are focused mostly on lines, and it may be exciting to see sequential throughput double in PCIe Gen3 to PCIe Gen4, and double again from Gen4 to Gen5, but in many real workloads, the stress of a system is not solely in the storage.
Likewise, our Adobe Media Encoder script is timing copy to the drive, then the transcoding of the video file, followed by the transfer off of the drive. Here, we have a bigger impact because we have some larger sequential reads/ writes involved, the primary performance driver is the encoding speed. The key takeaway from these tests is that if you are mostly compute-limited but still need to go to storage for some parts of a workflow, the SSD can make a difference in the end-to-end workflow.
On the KVM virtualization testing, we see heavier reliance upon storage. The first KVM virtualization, Workload 1, is more CPU-limited than Workload 2 or the VM Boot Storm workload, so we see strong performance, albeit not as much as the other two. These are KVM virtualization-based workloads where our client is testing how many VMs it can have online at a given time while completing work under the target SLA. Each VM is a self-contained worker. Here, the random write performance causes a bit lower of a result than we might see otherwise, but the sequential figures are good and the random read is decent so overall the drive ends up performing fairly well here.
Moving to the file server and nginx CDN, we see much solid QoS and throughput from the Memblaze SSD. The drive pulls ahead on the file server due to its faster sequential speeds. On the nginx CDN test, we are using an old snapshot and access patterns from the STH website, with caching disabled, to show what the performance looks like in that case. Here is a quick look at the distribution:
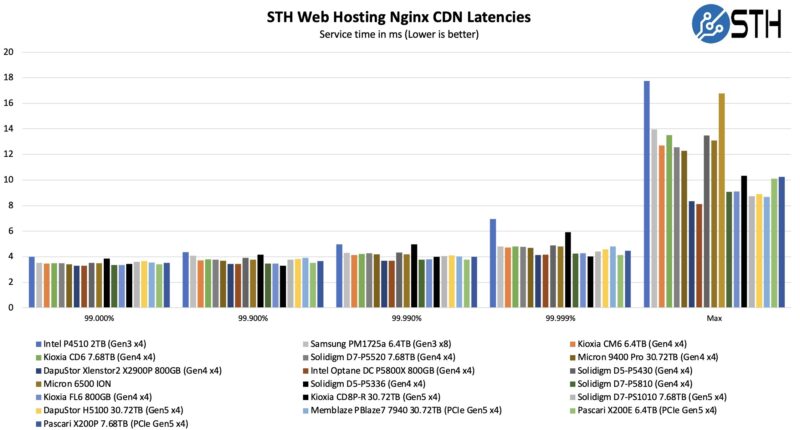
Again, these are not the fastest drives by any means, but they are quite fast for the capacity that they offer.
Now, for the big project: we tested these drives using every PCIe Gen5 architecture we could find, and not just x86.


Yeah I don’t think I can afford this in my home lab.
How do I buy one?