
Today we are looking at two processors which carry a similar model name but span two generations of processor technology. The Intel Xeon E5-2620 V2 is an Ivy Bridge-EP generation processor and the Xeon E5-2620 V3 is a newer Haswell-EP variant. The generational differences end up being quite substantial from a performance standpoint so we are taking a look at that today.
A quick comparison Intel Xeon E5-2620 V2 v. Xeon E5-2620 V3 directly from ARK@Intel:
| Processor Number | E5-2620V3 | E5-2620V2 |
| # of Cores | 6 | 6 |
| # of Threads | 12 | 12 |
| Clock Speed | 2.4 GHz | 2.1 GHz |
| Max Turbo Frequency | 3.2 GHz | 2.6 GHz |
| Cache | 15MB | 15MB |
| System Bus | 8 GT/s | 7.2 GT/s |
| AVX | AVX 2.0 | AVX |
| Max TDP | 85 W | 80 W |
| Box MSRP | $422 | $410 |
| Memory Types | DDR4-1600/1866 | DDR3-800/1066/1333/1600 |
| Max Memory Bandwidth | 59 GB/s | 51.2 GB/s |
As one can see, we get about 0.3GHz base clock and 0.6GHz Turbo with the new version along with AVX 2.0 and a transition to DDR4. Other key specs such as 6C/ 12T with 15MB LLC are similar, as is pricing (on a 2P server, $12 per chip looks more like a price increase for inflation.)
The main summary is that we have a new architecture (Haswell) and a slight boost in clocks. We will now take a look at how this translates into Linux-Bench performance.
Test Configurations
For these tests we used very similar platforms. We tried to keep the test platforms as similar as possible, however the two generations necessarily require different platforms to run.
E5-2620 V2 Test Configuration
- Motherboard: Gigabyte GA-7PESH3
- Processors: Dual Intel Xeon E5-2620 (V2)
- RAM: 64GB 8x8GB DDR3L 1600MHz ECC RDIMMs
E5-2620 V3 Test Configuration
- Motherboard: Gigabyte MD70-HB0
- Processors: Dual Intel Xeon E5-2620 (V3)
- RAM: 64GB 8x8GB DDR4 2133MHz ECC RDIMMs (in 1866 mode)
Overall fairly similar configurations.
Intel Xeon E5-2620 V2 v. Xeon E5-2620 V3 Benchmark Results
For our testing today we are using the Linux-Bench test suite. The Linux-Bench suite is a freely available Linux Benchmarking script that takes one command to run on many systems. We used a Ubuntu 14.04 LTS LiveCD which is our standard method to test. You can go here for the Linux-Bench instructions including a video. You can find more information about each test at Linux-Bench.com.
We are going to try something a bit different. Linux-Bench generates an absolutely huge number of results so we are presenting things slightly differently today: In percentage terms.
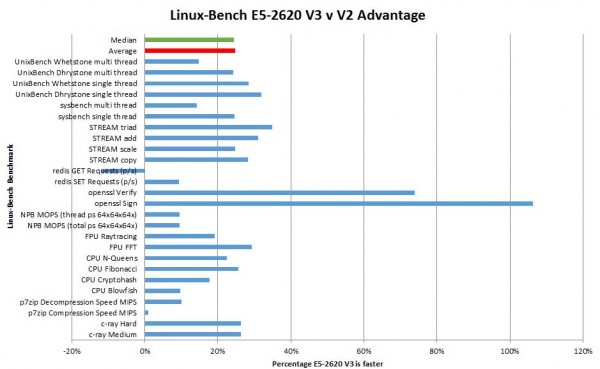
First the summary, we had an average improvement of 25% and a median improvement of 24%. Take either number as you will but the trend was fairly consistent.
Here are a few quick highlights from the results:
UnixBench results
Probably the two most consistent UnixBench CPU benchmarks are the Dhrystone and Whetstone benchmarks. We see both single-threaded and multithreaded performance increases in-line with the general trend.
sysbench results
sysbench is a heavily compute intensive application. We can see the impact of clock speed and IPC improvements with Haswell-EP fairly strongly with a 15-25% improvement in performance over the Ivy Bridge-EP platform.
STREAM results
Haswell-EP platforms have access to DDR4 which provides more bandwidth than DDR3. As a result, we do see some solid performance gains here which we would expect given the newer technology.
Redis results
Redis was a mixed set of performance figures. On the redis SET results we saw solid performance gains with the Intel Xeon E5-2620 V3. On the other hand GET results were consistently worse.
OpenSSL results
OpenSSL is becoming an extraordinarily important application. We can see performance increase by the largest amounts. We saw a very large increase in the Haswell-EP piece at Tom’s Hardware using the E5-2690 V2 and E5-2690 V3 comparison points. These do appear to be consistent outliers throughout the 10 runs we did of Linux-Bench.
NPB results
Our NPB results are showing a 10-11% improvement in performance between generations. This is solid and in-line with what we are seeing in hardinfo and 7-zip.
hardinfo results
As Ubuntu’s “built-in” benchmark this is often a quick and dirty benchmark we use to test processors under Linux. Luckily, with only 24 threads per machine, hardinfo does scale here. Overall the results are shocking in favor of the E5-2620 V3. Certainly more than we have seen in other tests. hardinfo can be finicky so seeing across the range of test gains gives a good sense that we have a significant improvement.
7-zip results
Servers commonly compress and decompress data. 7-zip is a popular compression tool and has a built-in benchmark that we are using today. Here we see a 1% compression speed bump and a 10% decompression speed bump with the newer chip. While this may be nothing to get overly excited about it is helping to establish a trend. The 1% bump is certainly at the lower end of what we would expect.
c-ray 1.1 results
Our c-ray 1.1 tests are similar to the old STHbench tests, however we have added a new “hard” test due to the newer architectures with even more cores.
Overall the performance improvement is solid. Both the medium and hard test show a 26% improvement in performance with only a 12.5% base clock and 18.75% maximum turbo difference. c-ray tends to be a good proxy for overall threaded performance as it was very similar to our average/ median results.
A word on power consumption
This was not a great review for power consumption purposes. The motherboards were too different as there was a 10GbE controller on the Haswell-EP platform. Although we will not be publishing formal figures, the informal figures would be a 22-24w at idle decrease in power consumption (81-86w) range for the Haswell-EP version with the Ivy Bridge-EP platform running in the 103- 108w range. Similarly, under CPU load we saw Ivy Bridge-EP pull ahead by about 15-18w total.
Certainly those are not highly scientific numbers, but should provide at least “ballpark” guidance on how to size these servers.
Conclusion
Overall, the Intel Xeon E5-2620 V3 is certainly worth the $12 premium (V3 over V2) once DDR4 comes down in price (significantly.) The additional clock speed does help the processor quite a bit. In fact, for many users, the E5-2620 V3 may make more sense as getting two of these chips can make a system capable of utilizing up to 80 PCIe 3.0 lanes and 16 or 24 DIMM slots. If we take away the OpenSSL and Redis benchmarks as outliers, the average sinks to 21% performance gain and the median stays at 24%. Either way, there is a significant performance bump with The Intel Xeon E5-2620 V3 over the V2 part.
One ask – let us know what you think about this style of performance comparison. We have a thread on the forums dedicated to it. We are trying to avoid the difficult to read (too much data) tables found in previous generation reviews.

