
At STH, we have the largest collection of Intel Xeon D benchmarks on the Internet yet we have a few chips that we have not yet published benchmarks on. One of those chips is the Intel Xeon D-1537. The final “7” digit tells us that it is a storage-focused chip. In our case, the test unit we are using with this is a 120TB 1U cold storage machine from Supermciro using 10TB HGST hard drives. We will have a bigger review of that platform shortly, but we did want to publish initial benchmarks of the Intel Xeon D-1537 which is an 8 core 12MB L3 cache chip. It sacrifices 400MHz versus the Intel Xeon D-1541 but that clock speed sacrifice yields a 10w TDP savings making the D-1537 a 35W part.
Test Configuration
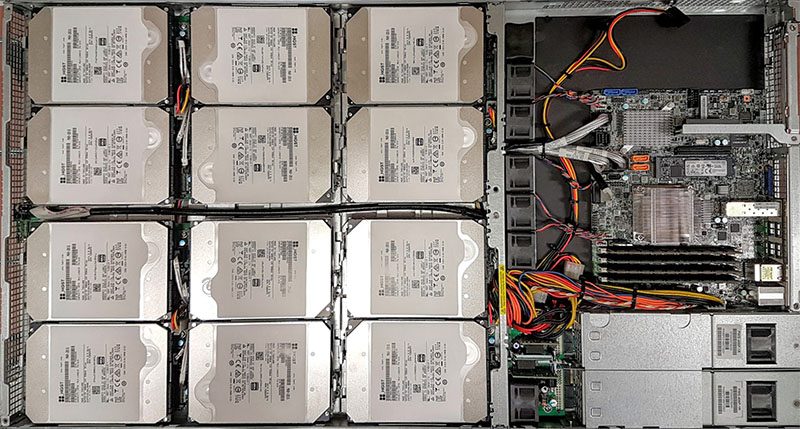
Our test platform was not our standard platform. We did these benchmarks on a system we had in the DemoEval lab.
- CPU: Intel Xeon D-1537
- Platform: SuperServer 5018D8-AR12L
- Memory: 64GB – 4x Samsung 16GB DDR4 2133MHz ECC RDIMM
- OS SSD: 2x 32GB SATA DOMs
- Hard Drives: 12x 10TB HGST HE10
- Caching SSD: 1x Toshiba 256GB NVMe
- Operating System: Ubuntu 14.04.4 LTS
Perhaps the most interesting note on this platform is that even with 8 cores/ 16 threads and 120TB in a 1U chassis the system was still utilizing less than 300w which is extremely impressive.
Intel Xeon D-1537 Benchmarks
For our testing we are using Linux-Bench scripts which help us see cross platform “least common denominator” results. We are using gcc due to its ubiquity as a default compiler. One can see details of each benchmark here. We are likely going to update the Linux-Bench in the near future with a few new tests as well as an even simpler to use/ faster revision, but for now, we are using our old Ubuntu 14.04.4 version. If you want to see example results, here is one run on Linux-Bench.
Python Linux 4.4.2 Kernel Compile Benchmark
This is one of the most requested benchmarks for STH over the past few years. We (finally) have a Linux kernel compile benchmark script that is consistent. Expect to see this functionality migrate into Linux-Bench soon (we are just awaiting the parser work on it.) The task was simple, we have a standard configuration file, the Linux 4.4.2 kernel from kernel.org, and “make” with every thread in the system. We are expressing results in terms of complies per hour to make the results easier to read.
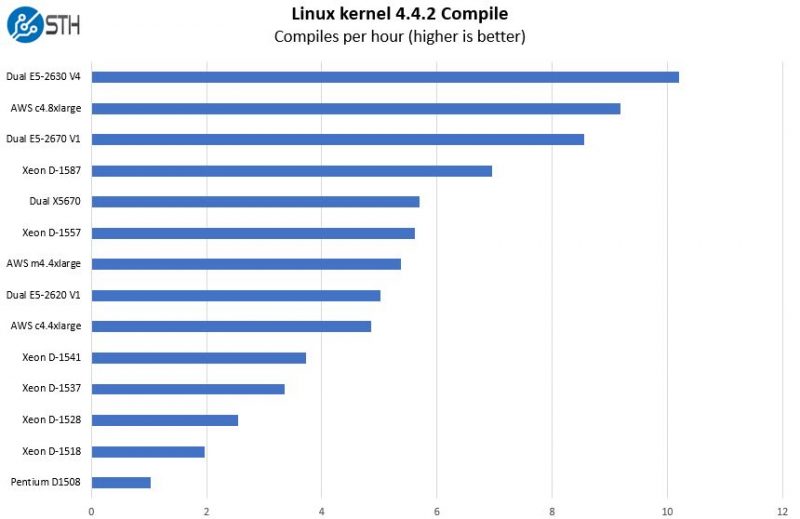
Here you can see that the overall performance of the Intel Xeon D-1537 is about what we would expect from a raw CPU horsepower perspective. For a 35w TDP CPU that is a very solid result.
c-ray 1.1 Performance
We have been using c-ray for our performance testing for years now. It is a ray tracing benchmark that is extremely popular to show differences in processors under multi-threaded workloads.
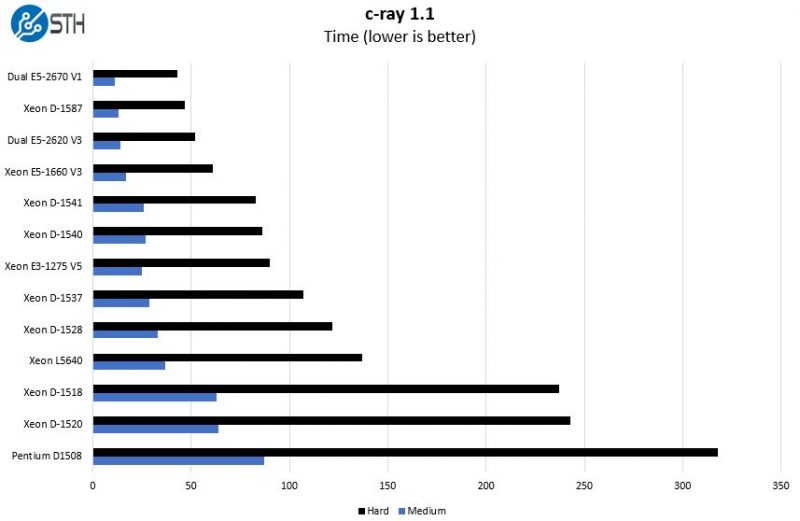
This is another benchmark that performs well on multi-threaded CPUs. While the Intel Xeon D-1537 performs well in this comparison group, we do have a system in the DemoEval lab that is running the “hard” test in 6-7 seconds. When comparing the D-1537 to older system, you can see that it easily outpaces a single Xeon L5640 from the Westmere-EP generation and the system will fit into less than half the power envelope.
7-zip Performance
7-zip is a widely used compression/ decompression program that works cross platform. We started using the program during our early days with Windows testing. It is now part of Linux-Bench.
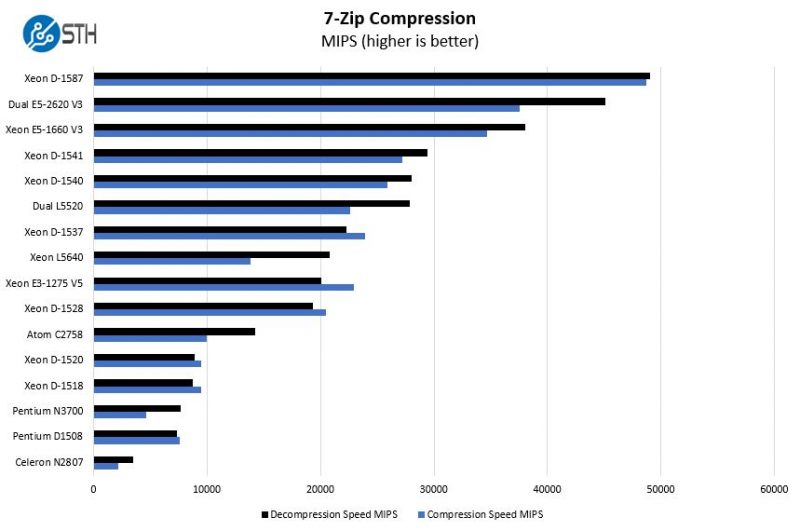
We are using a fairly wide comparison set here to show where the Intel Xeon D-1537 falls. The bottom line is that if you are using heavy compression on your storage you can probably replace a dual Intel Xeon L5520 server with a single Intel Xeon D-1537. In our test system with 120TB of raw storage this is likely a 4x power consumption improvement versus a Nahelem-EP series array and 1/10th the rack space required.
NAMD Performance
NAMD is a molecular modeling benchmark developed by the Theoretical and Computational Biophysics Group at the Beckman Institute for Advanced Science and Technology at the University of Illinois at Urbana-Champaign. More information on the benchmark can be found here.
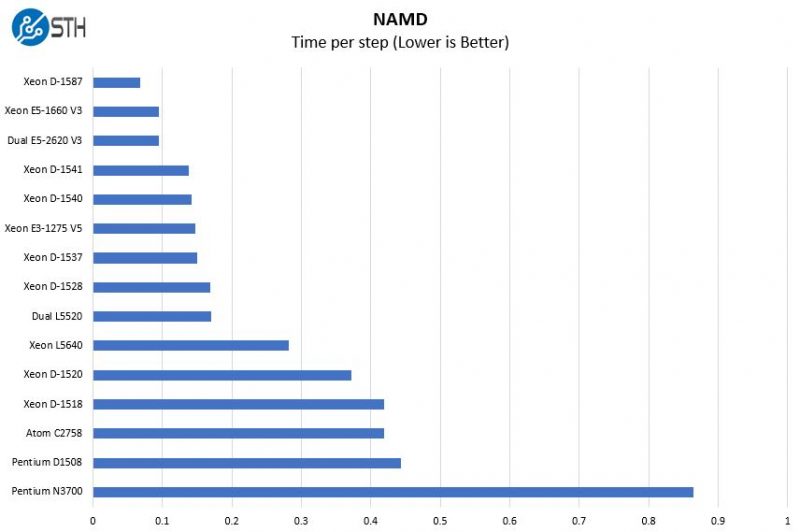
Scientific computing is likely not where the Intel Xeon D-1537 is best suited however we can see that even with the lower clocks it is providing more performance than the Intel Xeon D-1528.
Sysbench CPU test
Sysbench is another one of those widely used Linux benchmarks. We specifically are using the CPU test, not the OLTP test that we use for some storage testing.
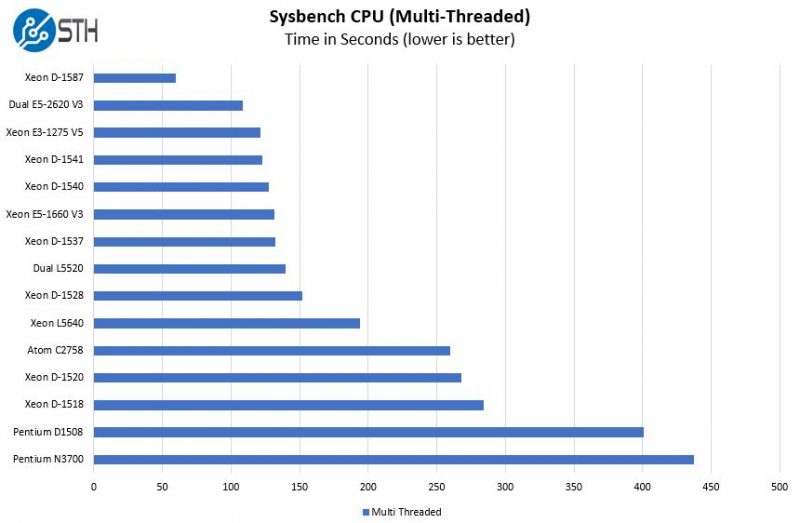
Here we can see some benchmark limitations being hit as the scaling between the Intel Xeon D-1537 and the D-1540 / D-1541 is less than we would expect. On the other hand, there are plenty of workloads that are not fully multi-core optimized so this is not uncommon to see.
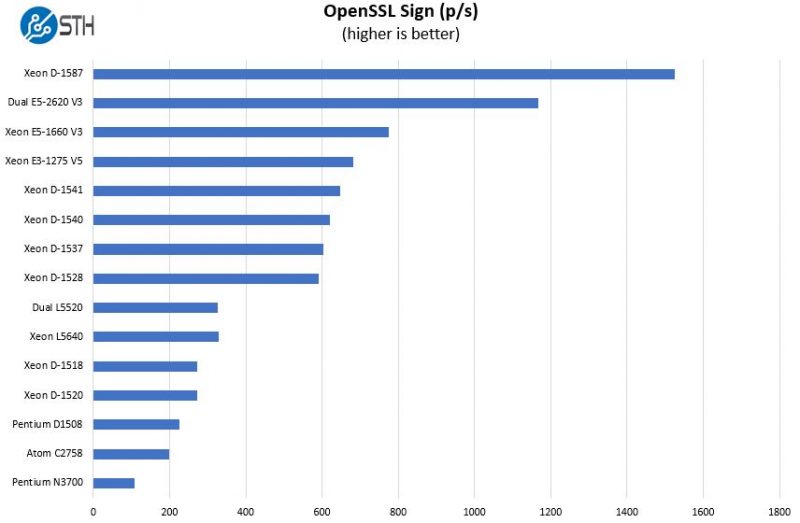
OpenSSL Performance
OpenSSL is widely used to secure communications between servers. This is an important protocol in many server stacks. We first look at our sign tests:
Moving to the verify results:
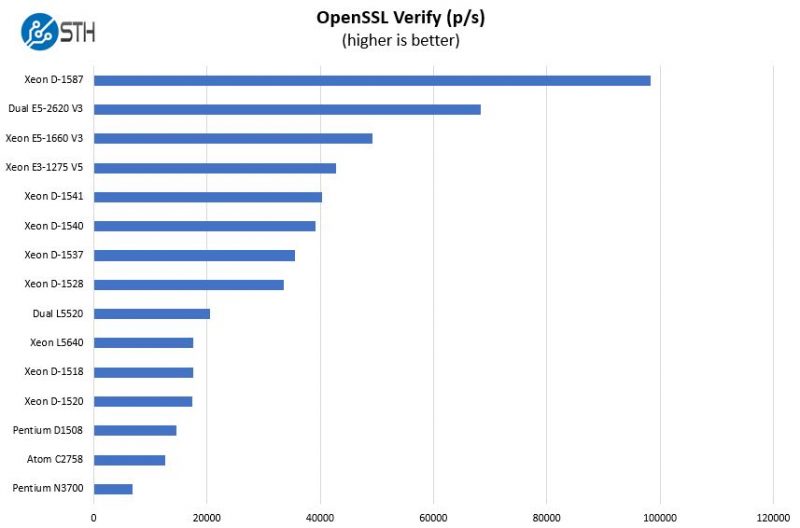
If you read our piece on Intel QuickAssist OpenSSL acceleration, you will likely get the impression that much of the OpenSSL work will move to hardware accelerators. Still, OpenSSL is a popular foundational element in many of today’s server applications.
UnixBench Dhrystone 2 and Whetstone Benchmarks
Of course, these chips are not meant for heavy compute but we pick out the UnixBench 5.1.3 Dhrystone 2 and Whetstone results to show some of the raw performance they are capable of. UnixBench is widely used so it is a good comparison point. Keen eyes may also note that there are a few results in the above charts that we have not previously published on STH.
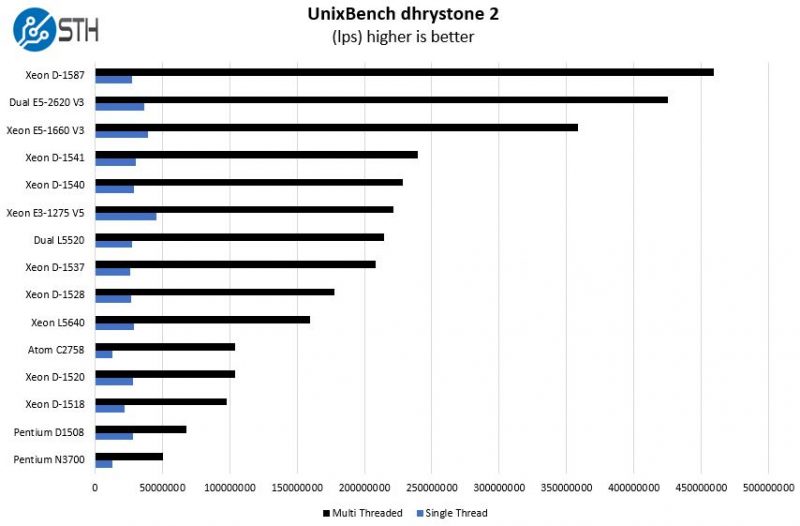
As we increase the core counts the multi-threaded performance dominates the chart scale. We see the D-1537 is behind the D-1541 in both single and multi-threaded workloads.
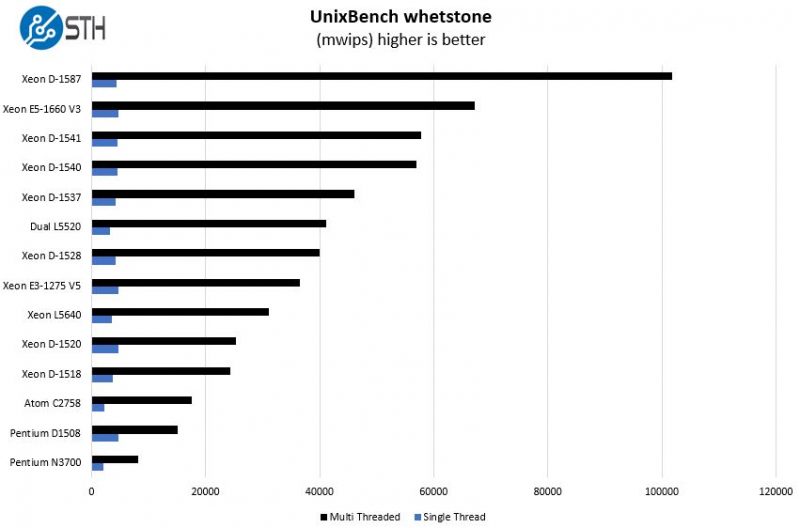
The key takeaway here is that there is a solid benefit to moving towards a lower-power and newer storage platform.
Conclusion
Part of STH’s hosting cluster is actually a number of 1U Intel Xeon D servers. We do not have an Intel Xeon D-1537 in the hosting cluster but it seems well suited to a storage server and we may end up getting one of these for off-site backup duties. If you were building a 10GbE capable ZFS storage server, this may be one of the platforms to look at strongly in the near future.


OpenSSL sign… what? RSA? Which size? ECDSA? ECDH? Which curve?
They use rsa4096 for these articles.
Sorry, who is ‘they’? I’ve read some articles here, but it’s not been immediately clear to me what the test setup is. For example, is this OpenSSL 1.1 or 1.0.1? With or without patches from Intel? What randomness source has been used (openssl engine -tt)? HT on/off? Frequency agent powersafe/performance/intel? Turbo on/off?
Point is, a test setup has to be properly described.
For comparison, my single Xeon E5-2676 v3 (12c Haswell, 2.4GHz) with HT and Turbo on (all 2.7GHz), intel p-state, Ubuntu 16.04, engine is RDRAND (available and on!), OpenSSL 1.0.1j with patches from Intel:
“`bash
openssl speed -engine rdrand -multi $(nproc) rsa4096
sign verify sign/s verify/s
rsa 4096 bits 0.000696s 0.000010s 1677.9 101621.4
“`
The D-1537 in its unknown setup from above comes close! Which is impressive, given that its TDP is 45W and the E5-2676v3 120W. But, performance increase for workloads using AVX{1,2} and BMI{1,2} is impressive on all Broadwell and Skylake.
I’d bench rsa2048 and ecdhp256, ecdhp384, ecdhp521, though. That’s the setup that comes close to what is actually used in the wild. Another benchmark which covers AVX and BMI, as well as memory speed/latency effects and other advanced instruction sets, is encoding to x265.
*1587 and 65W. Why can’t I edit the comment. :-(
Comments are closed.