HP FX900 Pro 2TB Performance Testing
We test using both the default smaller test size as well as larger test sets on our benchmarks. This allows us to see the difference between lighter and heavier workloads.
CrystalDiskMark x64
CrystalDiskMark is used as a basic starting point for benchmarks as it is something commonly run by end-users as a sanity check.
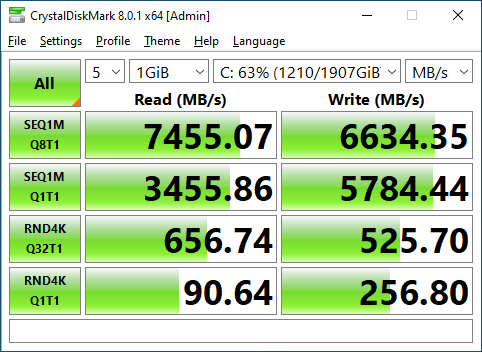
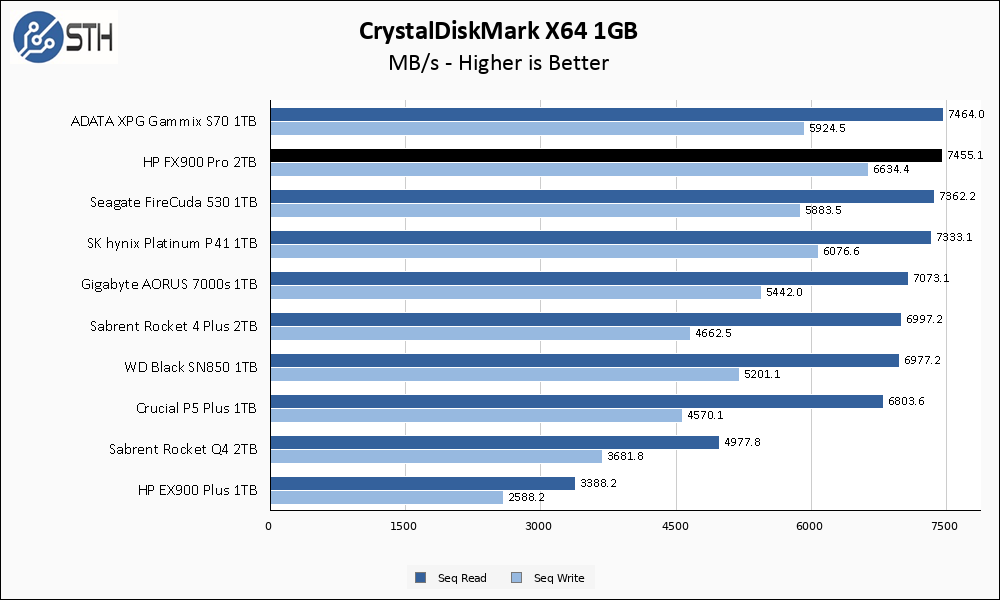
The FX900 Pro lands close enough to its rated performance numbers that I am giving it a thumbs up here. In addition to that, it lands at the very top of our performance chart, with a tie for sequential reads and an overall victory for writes. Keep in mind that this is a 2TB drive mostly competing with 1TB drives, with the exception of the Sabrent Rocket 4 Plus and Rocket Q4; this size difference gives the FX900 Pro a performance advantage over the 1TB drives.
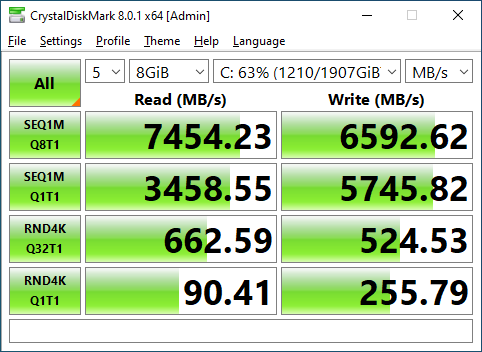
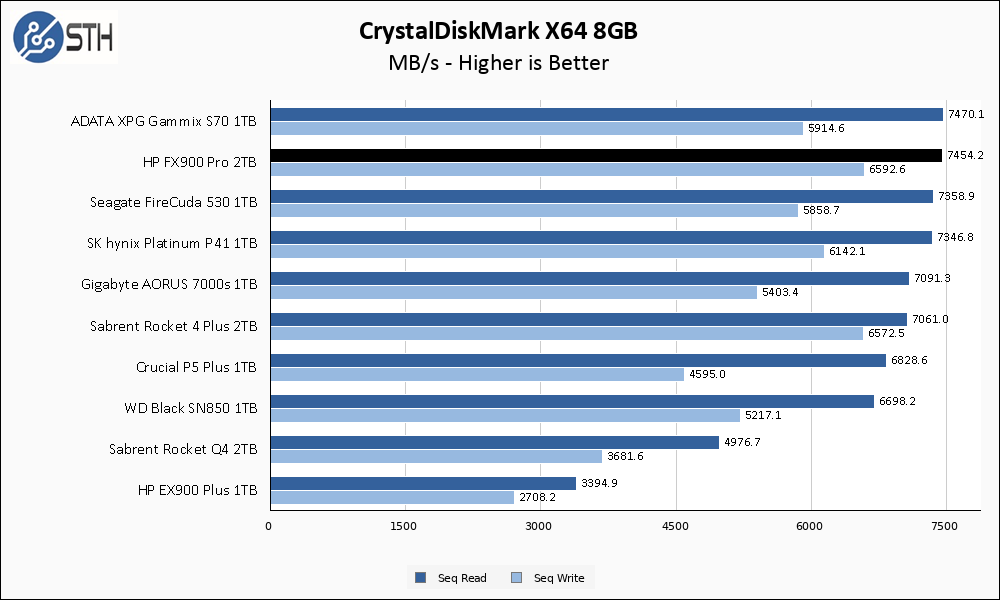
Things hold up well on the larger CrystalDiskMark test; the FX900 Pro barely budges and once again is essentially tops on my chart.
ATTO Disk Benchmark
The ATTO Disk Benchmark has been a staple of drive sequential performance testing for years. ATTO was tested at both 256MB and 8GB file sizes.
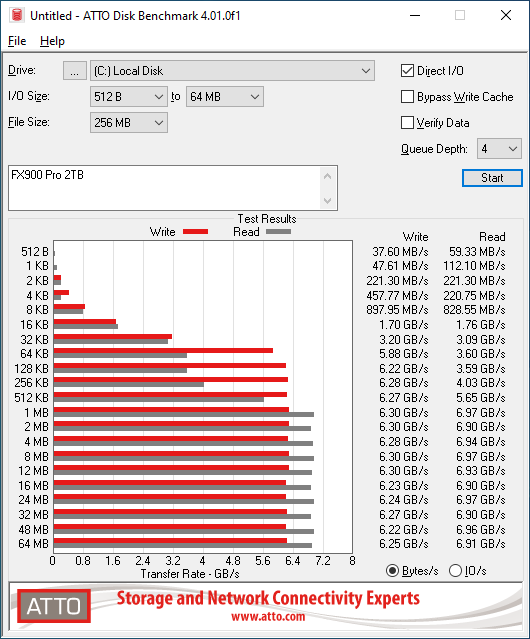
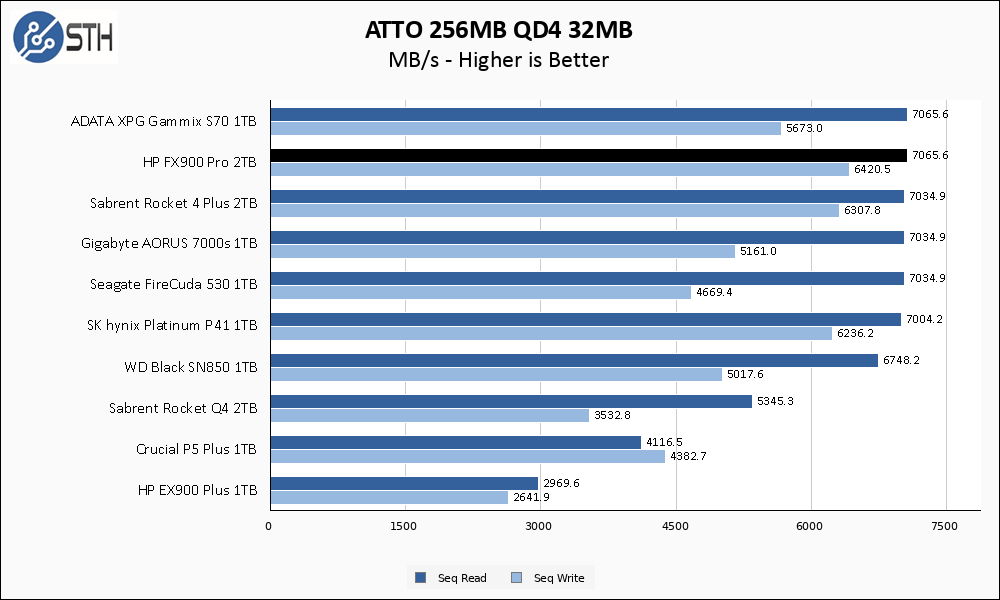
Similar to CrystalDiskMark, ATTO results place the FX900 Pro at the top of my chart. The Sabrent Rocket 4 Plus is much closer here and is almost tied with the FX900 Pro.
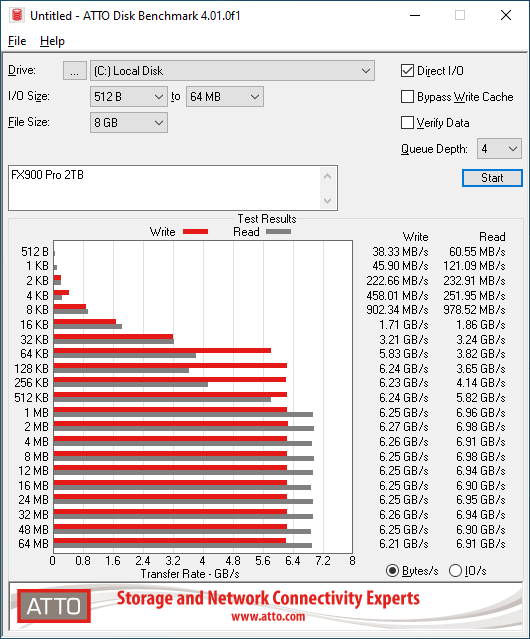
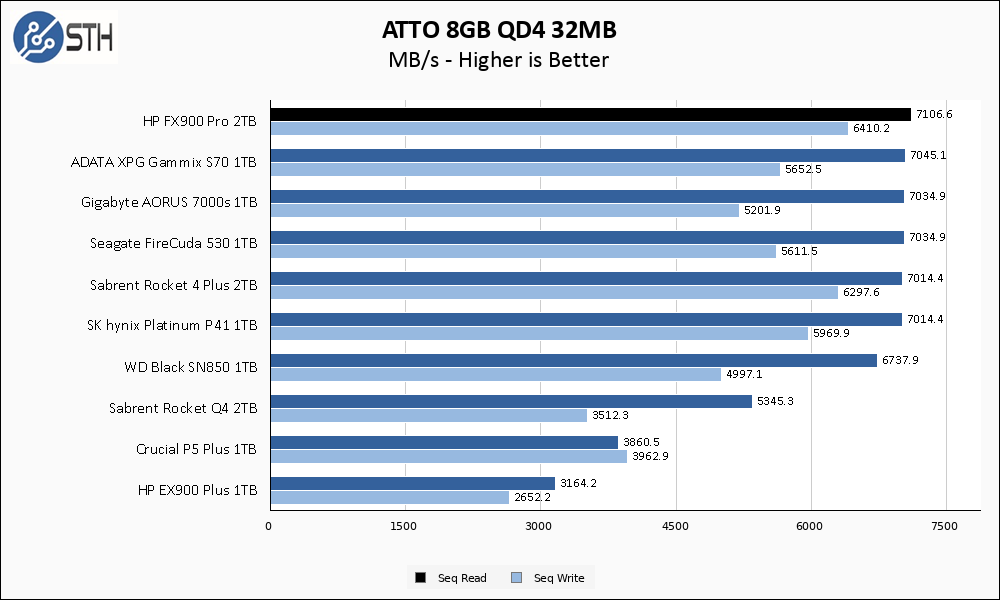
The FX900 Pro manages to edge everything else out and take the top spot in our chart on the larger ATTO test. With that said, it is a close race and the Rocket 4 Plus is nipping the heels of the FX900 Pro.
Anvil’s Storage Utilities
Anvil’s Storage Utilities is a comprehensive benchmark that gives us a very in-depth look at the performance of drives tested. This benchmark was run with both a 1GB and 8GB test size.
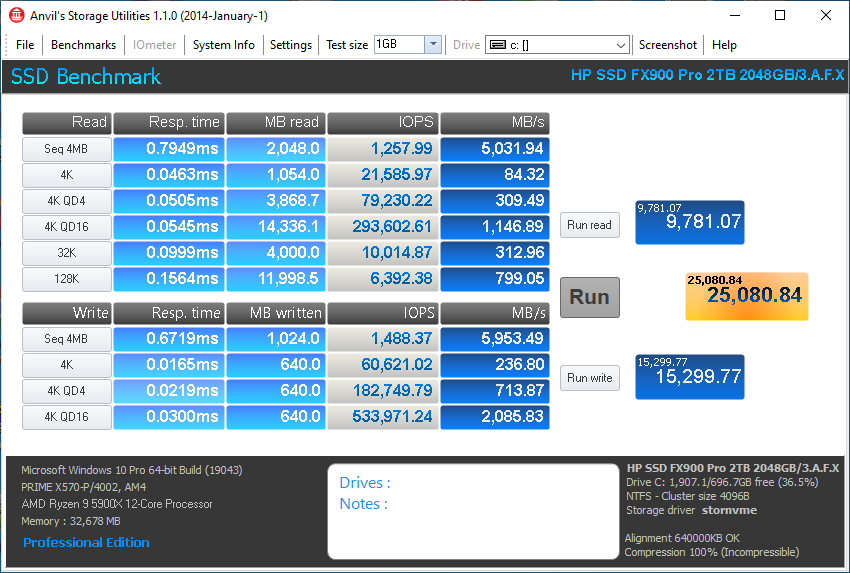
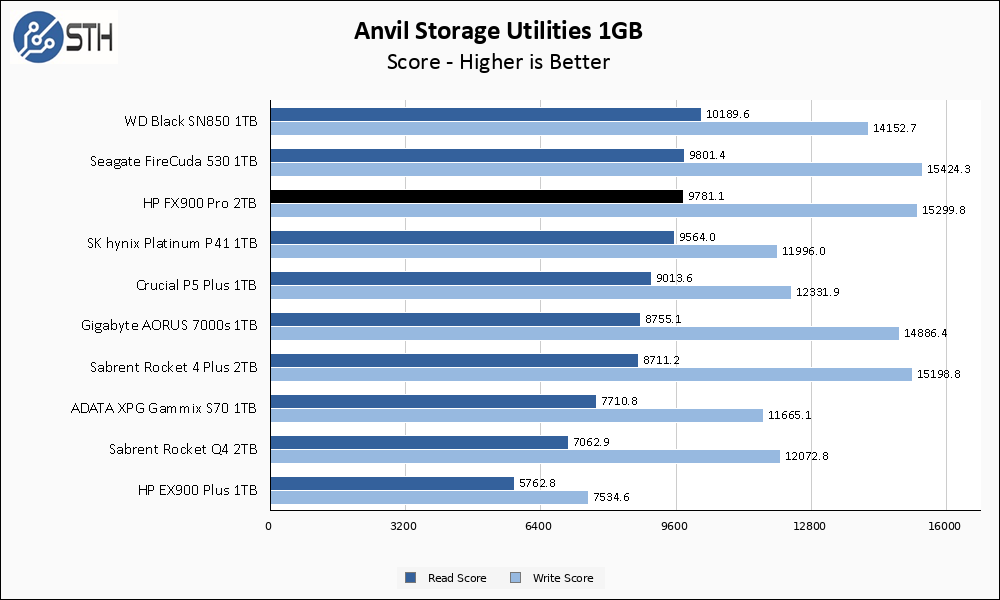
Performance in Anvil is interesting on the FX900 Pro, specifically when compared to the XPG Gammix S70. Those drives share a controller, though their capacities and NAND differ, and in the purely sequential tests the S70 and FX900 Pro were very close in performance. Here in Anvil, where random traffic pattern tests are included in the score, the FX900 Pro manages to separate itself from the S70. Relative to the rest of the pack, the FX900 Pro performs well and is nearly the chart-topper for both read and write scores.
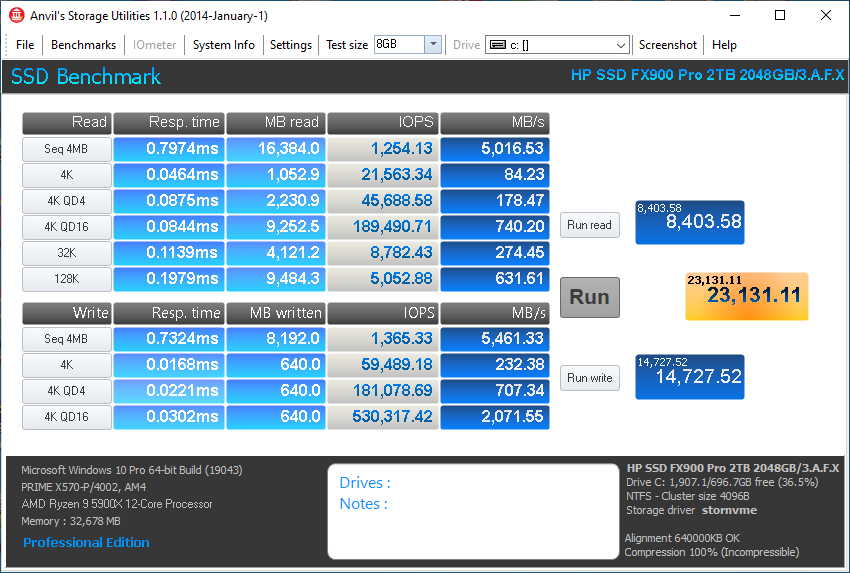
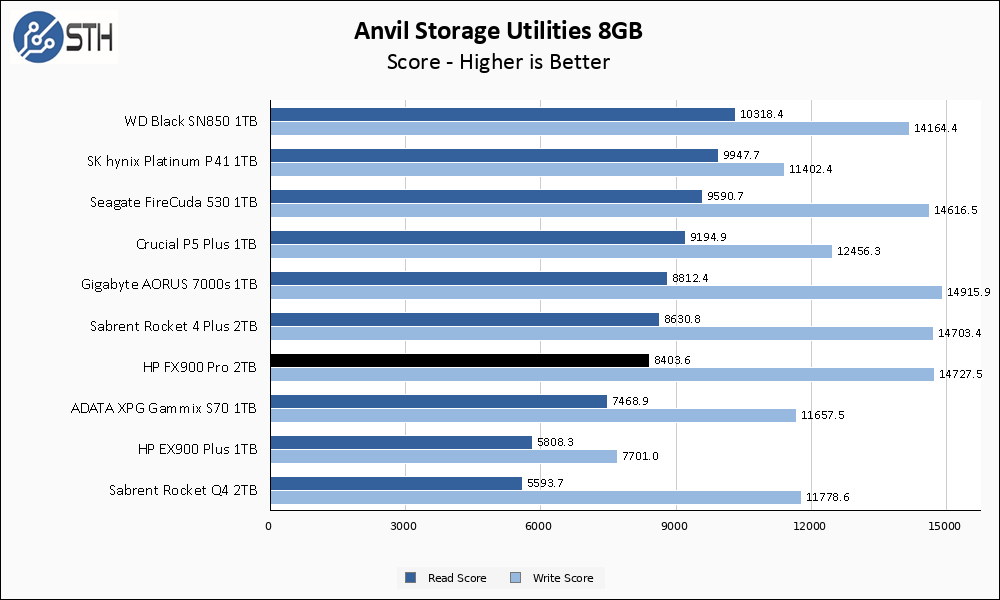
The FX900 Pro stumbles a bit on the larger Anvil test, at least as far as read performance goes. Write score remains very strong, but the read score drops this drive several pegs down on the chart.
AS SSD Benchmark
AS SSD Benchmark is another good benchmark for testing SSDs. We run all three tests for our series. Like other utilities, it was run with both the default 1GB as well as a larger 10GB test set.
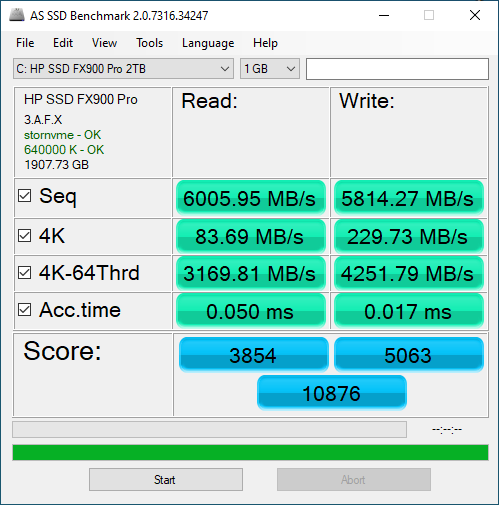
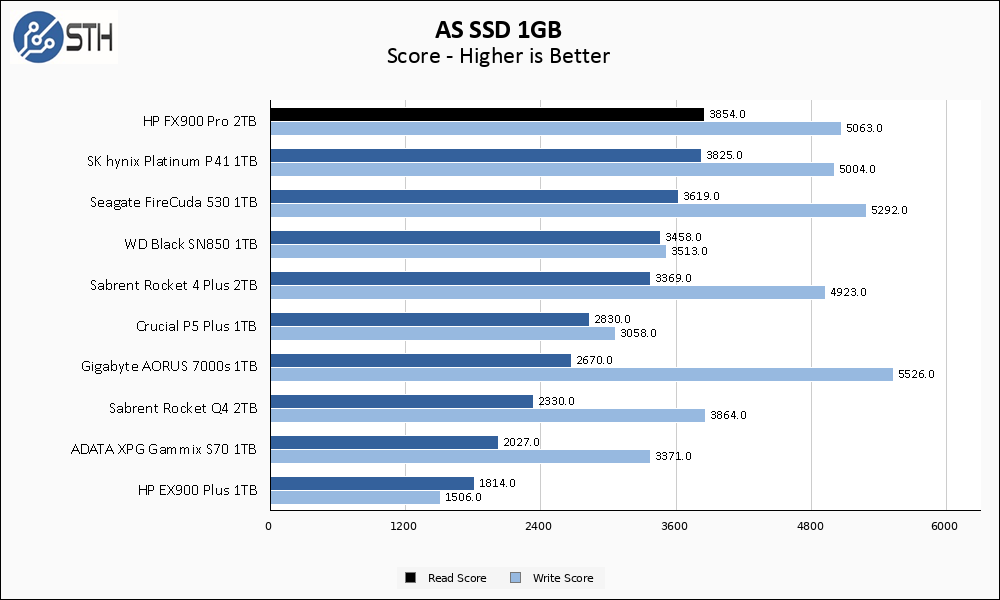
The HP FX900 Pro returns to form in AS SSD, topping the chart with read score and turning in very respectable numbers for write score. This is a test where the S70 performed poorly, so it is interesting to see the FX900 Pro do so well here.
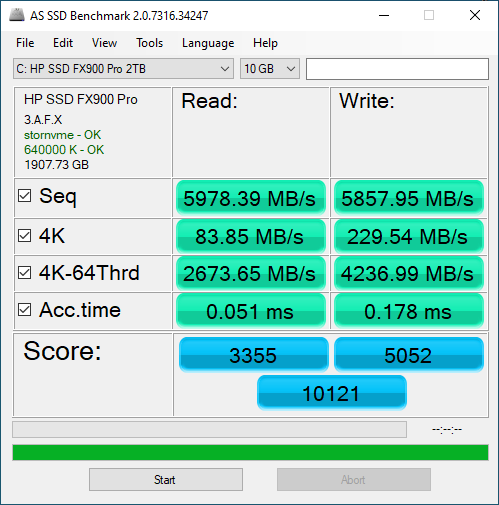
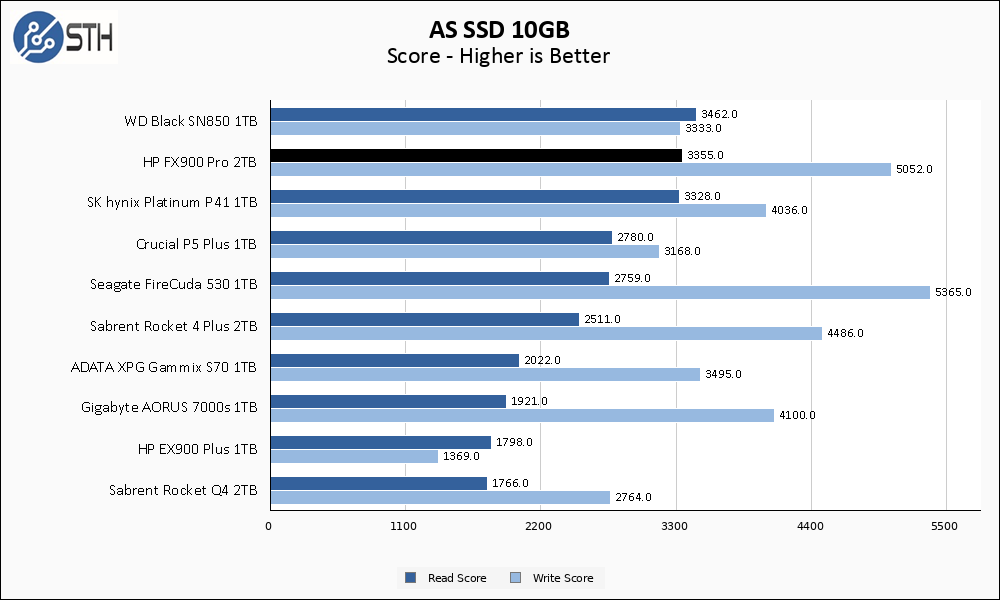
Similar to what happened to the SK hynix Platinum P41, performance in the larger AS SSD test slips a tiny amount and allows the SN850 to squeak out a read score win. The write score is still stronger on the FX900 Pro than either of those drives, though the FireCuda 530 is still the reigning champion in the write department.
SPECworkstation, thermals, and our conclusion are up next.


Who is the component supplier for this HP product?
If the drive hits 82C it is definitely thermal throttling. Not sure if your test bench varies during the tests for speed vs thermals but you can’t compare the speed of if it’s thermal throttling and the other drives aren’t. For thermal tests sure, but if that same setup is used for transfer rate tests you have a bad system. Throw a little water loop with one of the Corsair m.2 water blocks on it so you can get good comparisons on all your drive speed tests.
Any drive that hits thermal limits during testing gets active cooling so that benchmarks are not affected by thermals.
SEQUENTIAL READ MEANS NOTHING FOR NVME.
Strongly disagree Wildcard. When you have 25GbE 40GbE or faster, it is easy to need NVMe sequential read speed limits. That’s easy.
Headbrother: Designed, built & sold under HP Official License by BIWIN.
It seems some of these drives have a high failure rate. The amazon comments hint at this, and I just experienced it myself. Have you seen anything similar reported?
Comments are closed.