Fanxiang S880 2TB Performance Testing
We test using both the default smaller test size as well as larger test sets on our benchmarks. This allows us to see the difference between lighter and heavier workloads.
CrystalDiskMark x64
CrystalDiskMark is used as a basic starting point for benchmarks as it is something commonly run by end-users as a sanity check.
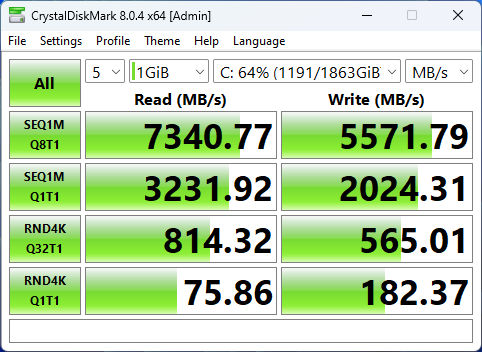
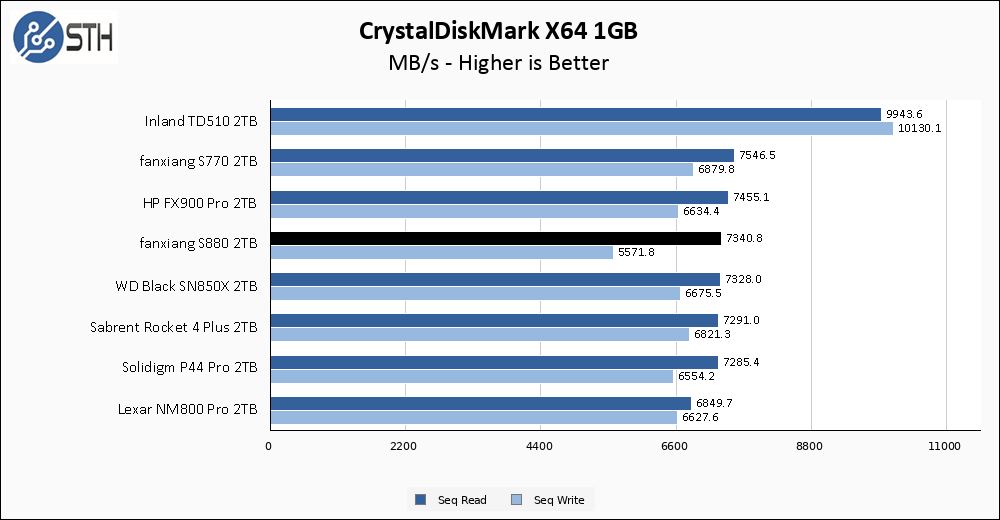
Good news first; the Fanxiang S880 2TB nails its rated read speed in CrystalDiskMark. Bad news next, it gets nowhere near its rated write speed. Since CrystalDiskMark is generally the easiest test in my benchmark suite, this does not particularly bode well.
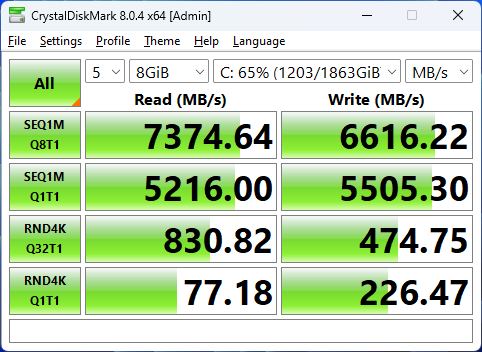
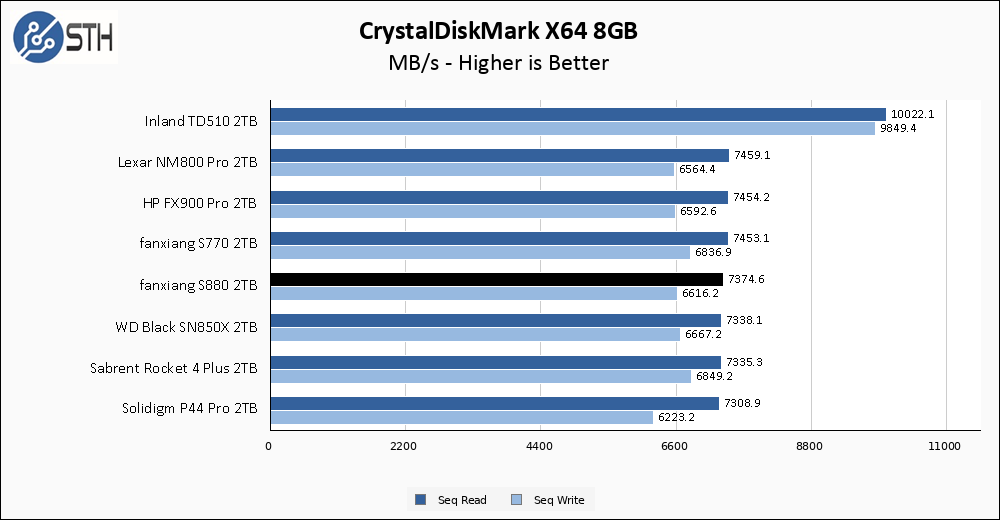
The larger CrystalDiskMark test allows the Fanxiang S880 to improve dramatically on its write speed, to the point where it is now passing this test.
ATTO Disk Benchmark
The ATTO Disk Benchmark has been a staple of drive sequential performance testing for years. ATTO was tested at both 256MB and 8GB file sizes.
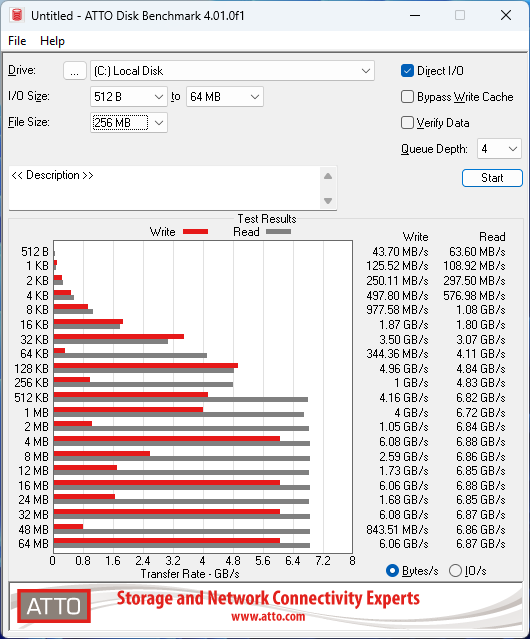
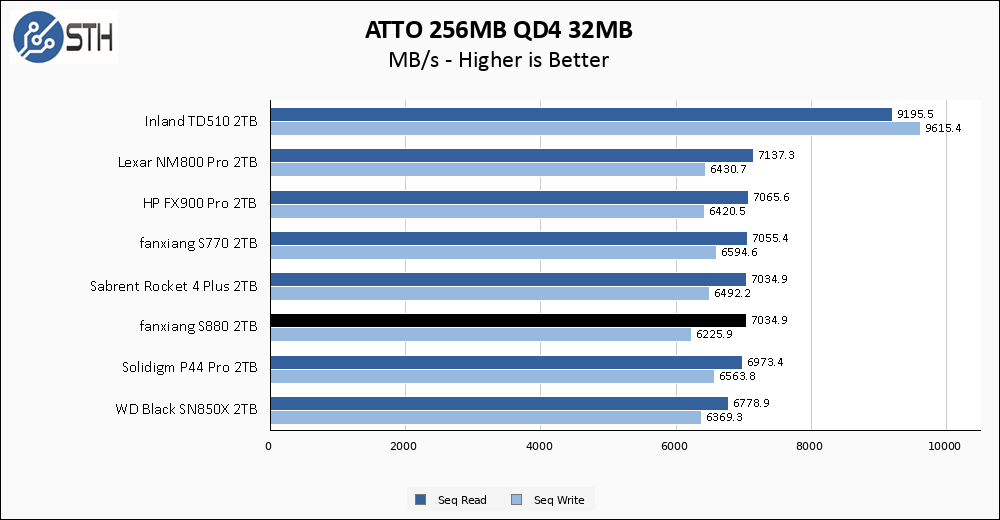
Similar to the S770, in ATTO the results for the S880 across the benchmark demonstrate a large variance in performance across the different chunk sizes. With our results taken from the 32 MB chunk size data point, the chart has the S880 looking absolutely fine, but the rest of the benchmark result is something to consider.
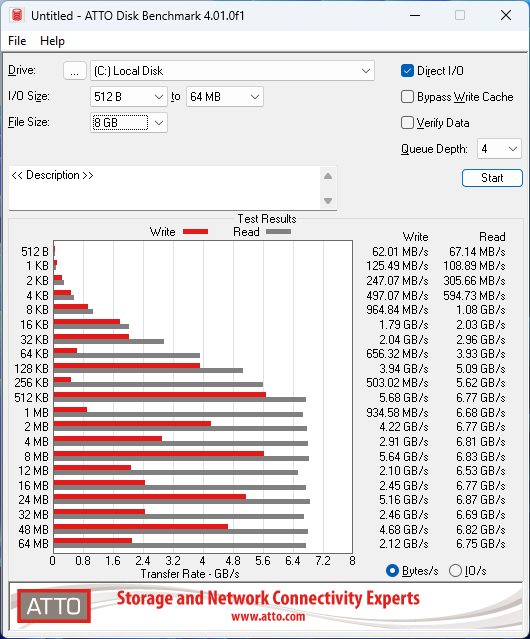
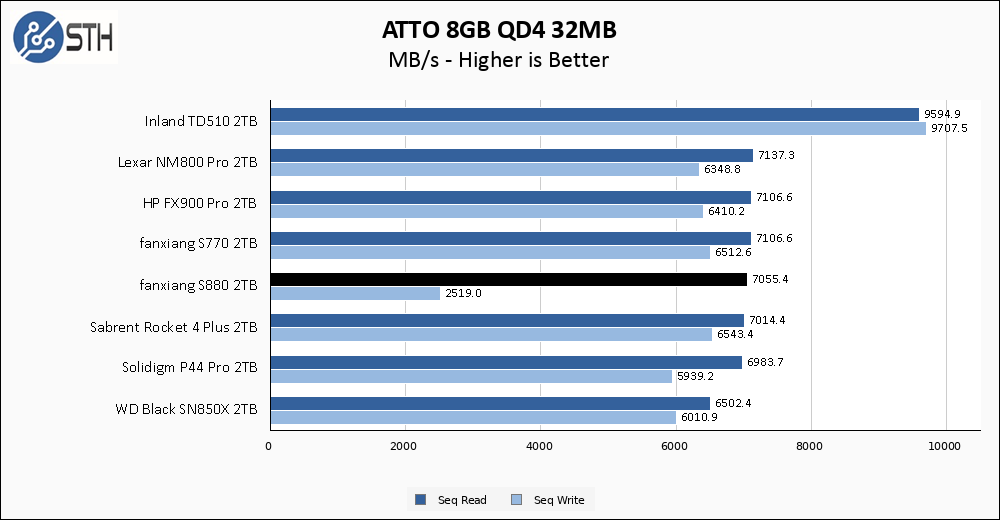
The larger ATTO test brings out more performance variability, and this time the S880 was not as lucky at the 32MB point we use for charting. Write speed suffered mightily and is a clear anomaly on the above chart. Note that there is some definite run-to-run variance; the point is the inconsistency more so than any specific result.
Anvil’s Storage Utilities
Anvil’s Storage Utilities is a comprehensive benchmark that gives us a very in-depth look at the performance of the drives tested. This benchmark was run with both a 1GB and 8GB test size.
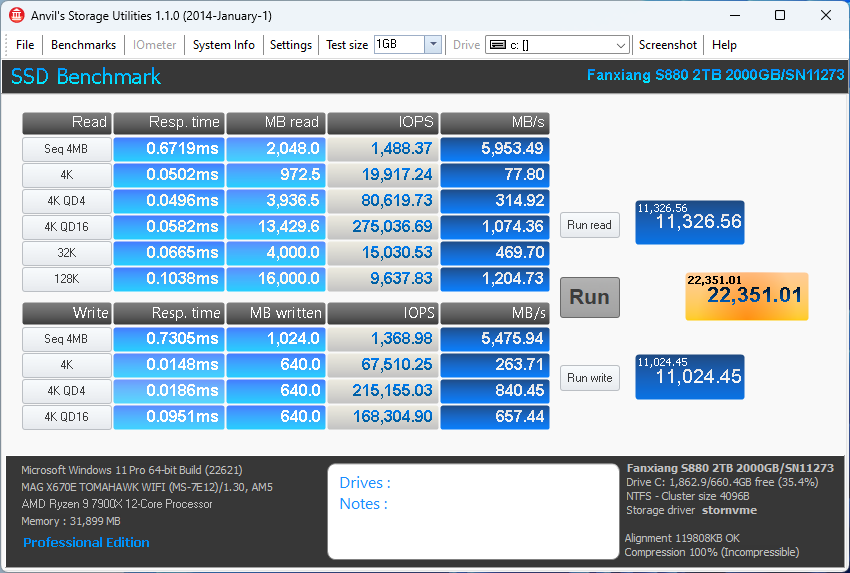
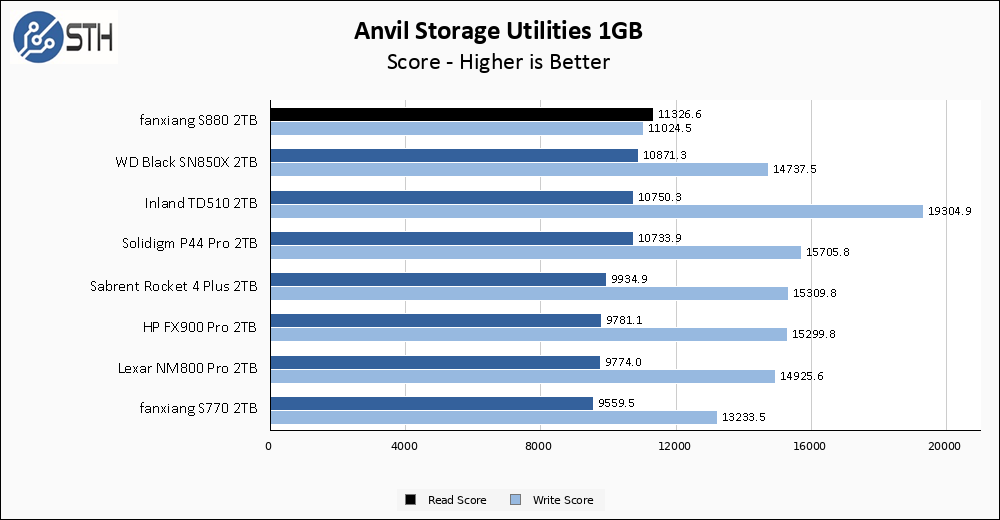
Well, would you look at that! The read score for this drive in Anvil is simply stellar. Write performance is more tepid and would have the S880 at the bottom of the chart, but read performance is great.
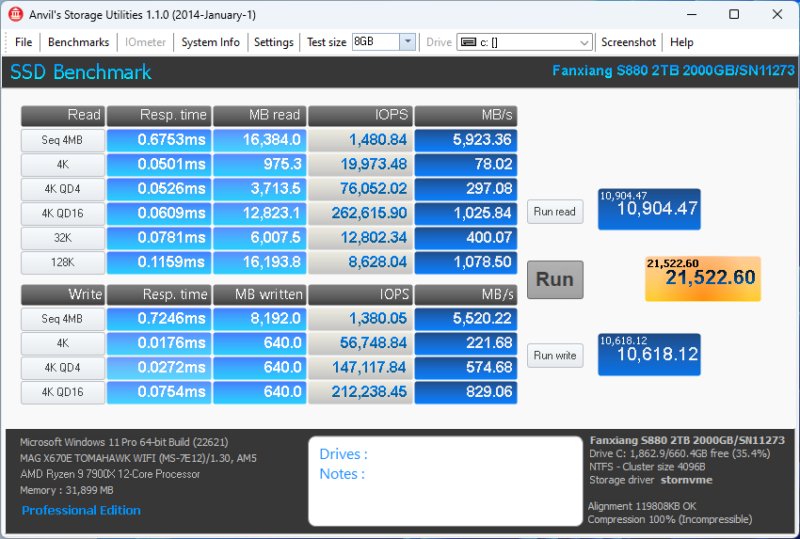
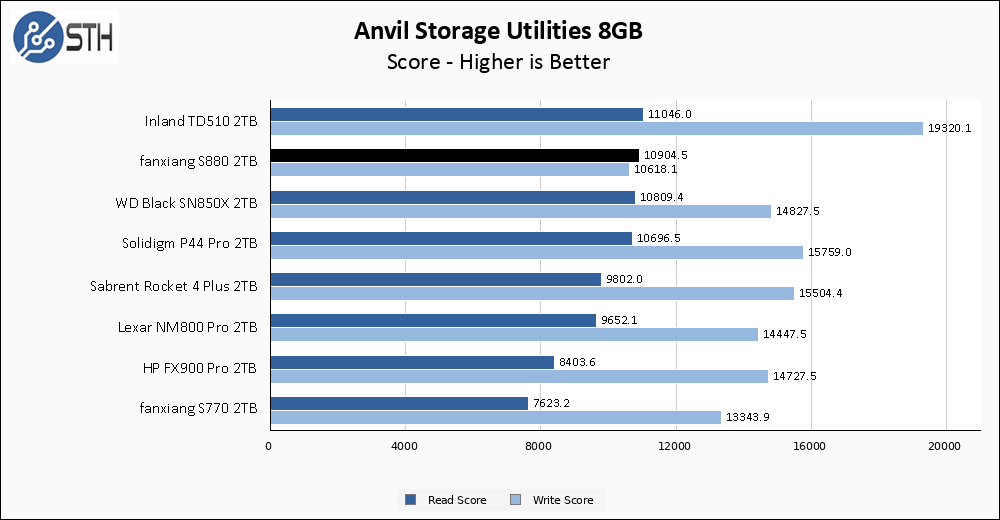
The larger Anvil test has the Fanxiang S880 continuing to excel in read score, narrowly edging out all except our Gen5 drive in the TD510.
AS SSD Benchmark
AS SSD Benchmark is another good benchmark for testing SSDs. We run all three tests for our series. Like other utilities, it was run with both the default 1GB as well as a larger 10GB test set.
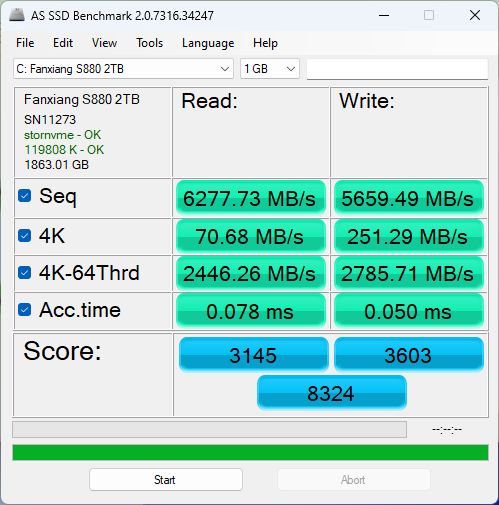
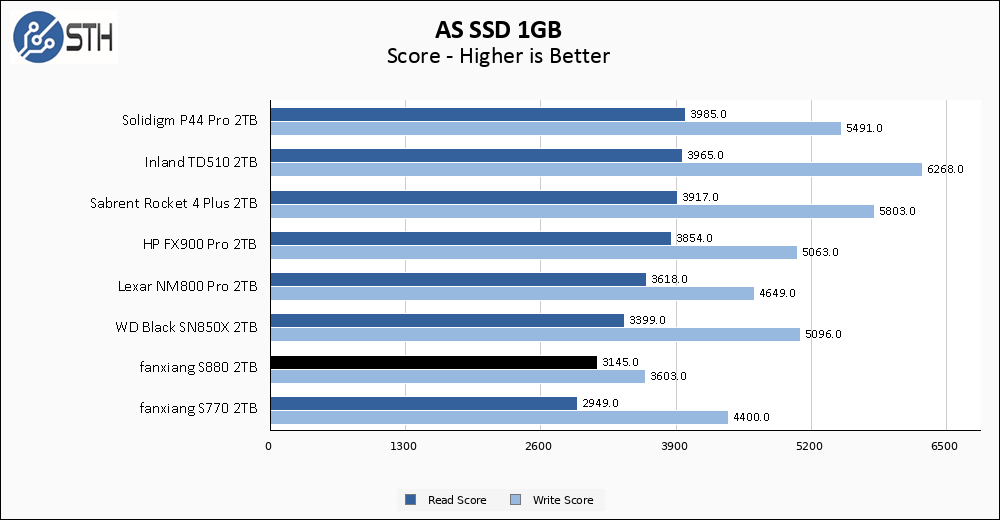
AS SSD results for the S880 take a relative nosedive compared to Anvil. The only drive on this chart that the S880 manages to outpace is the S770, and only in read score where the S770 has a solid leg up.
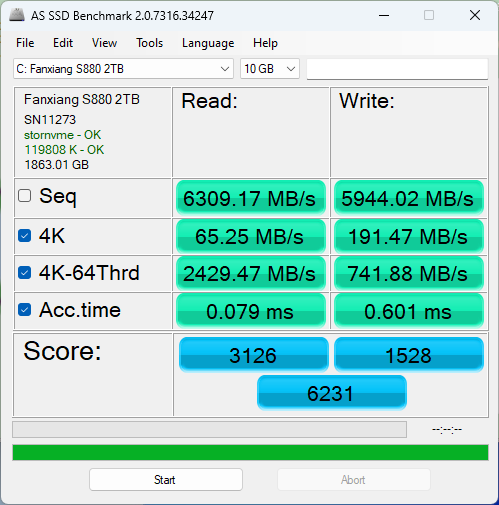

The larger AS SSD gives the Fanxiang S880 a thorough beating in terms of write score, with the S880 a clear last place compared to the other drives on the chart. Still, read score continues to be very respectable.
SPECworkstation, thermals, and our conclusion are up next.


The Lexar NM790 1/2/4TB uses the same exact NAND and controller as this does
It appears I can’t find S880 in china either. I assume it has become the S790
Somehow I couldn’t find a link to the Fanxiang S770 review in the article. Google found it.
I’m struck by the poor performance on SPECworkstation for a the drive that performs at par on CrystalDiskMark. Is it possible the firmware might have been tuned to a common synthetic benchmark? If so, it would appear application workloads are not amenable to such tuning.
When the review concludes, “If you are in the market for fast and cheap, buy an S770. If it is out of stock, you can buy the S880!” If I have a $90 budget and look at other drives in that price range in the US, I see PCIe 3 drives from Intel and Samsung as well as PCIe 4 drives branded Western Digital, Crucial Micron, PNY, MSI, Kingston and Team Group. Many of these drives are actually less than $80. How do they compare?
Comments are closed.