Discussing WD NAS Hard Drive Low Endurance Ratings
Before we get too far in this, we need to address the expansive WD Red lines. Here is the quick chart:
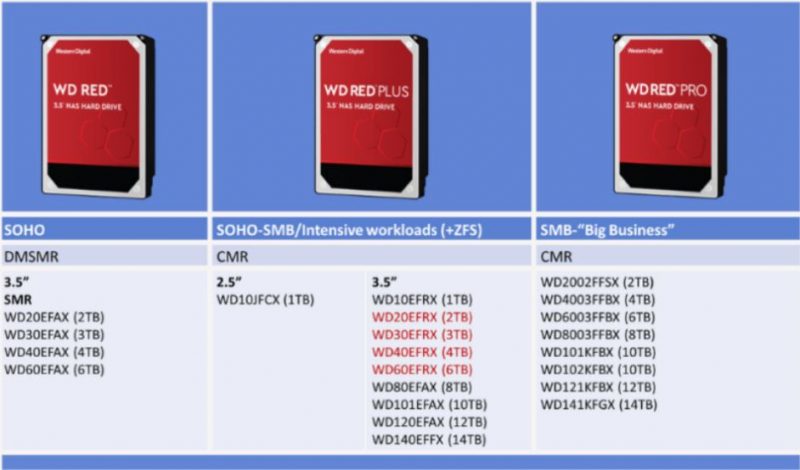
That chart was focused mostly on SMR v. CMR as a response to our 2020 series. In the series, focusing on the then WD Red SMR line, we found horrid performance in several use cases such as the ZFS that is used in QNAP QuTS Hero, TrueNAS, TrueNAS Scale, Ubuntu, Proxmox VE, and others. When we did that series, many others realized how bad SMR was for consumer NAS devices. Our recommendation is simply to not buy the WD Red line of drives. WD tarnished that brand.
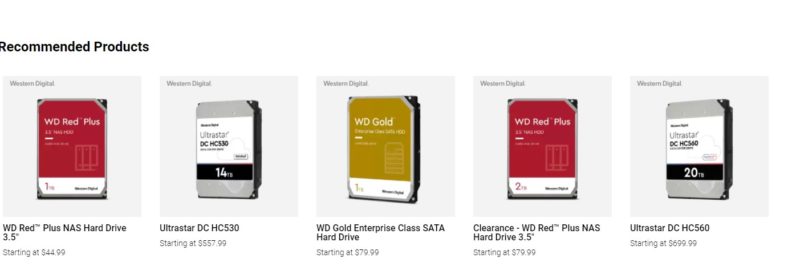
As a response to our series and input around that era, we got the WD Plus line that carried CMR like the previous generation WD Red, before WD surreptitiously switch the WD Red from CMR to SMR. At the time we found the poor WD Red SMR drives, and just before these Red Plus drives came out, we suggested that WD could do a short-term fix until the whole SMR thing blew over, then just move on. Interestingly enough, the WD Red Plus line topped out at 14TB and has not ascended past that point. Indeed, the WD Plus line is now listed as being on Clearance on WD’s website.
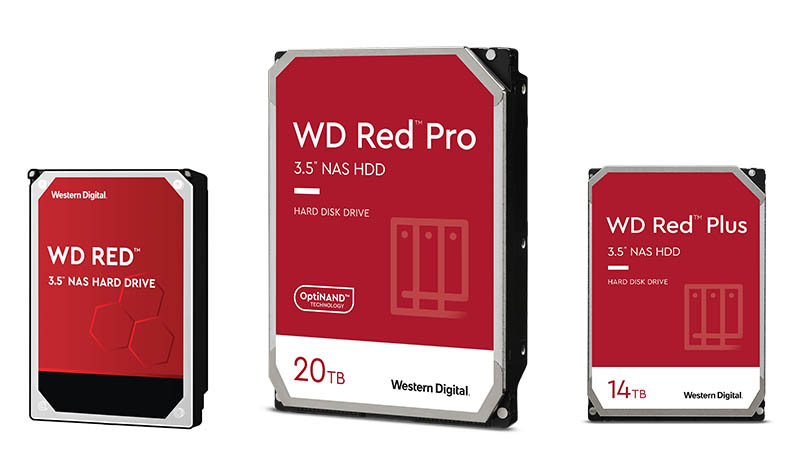
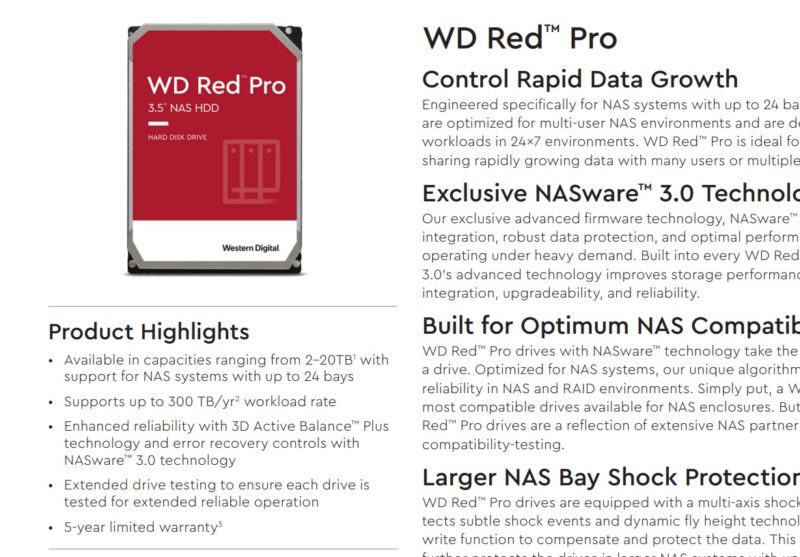
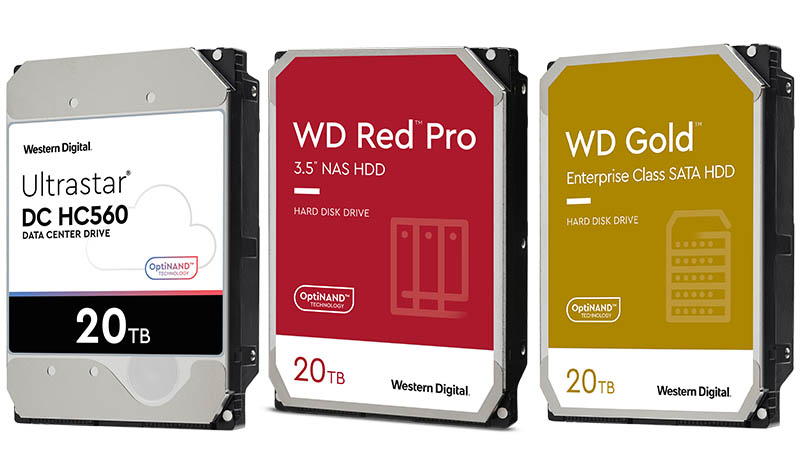
Finally, the higher-end 7200 rpm line is the WD Red Pro. This is the high-end drive that you would reasonably think is the best drive on the market. This is not for low-end NAS-es. It is for higher-end NASes with up to 24 drives and that perhaps need higher performance.
That has been the general hierarchy but it feels quite a bit like as we move to new capacities, the Red and Red Plus are being left behind. One of the key reasons for this may be that drive manufacturing is a big volume game. It almost seems like WD is making models at a capacity point and branding them data center, Gold, and WD Red Pro with different price points.
So that is the basic layout of the line. We are not going to focus on capacity or CMR v. SMR here. Instead, let us look at workload ratings of the lines
- WD Red 6TB/ 14TB – 180TB/year
- WD Red Plus 14TB – 180TB/year
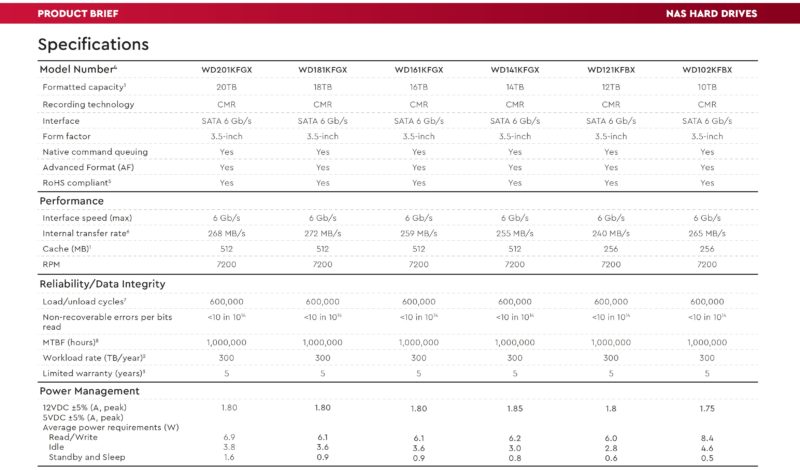
- WD Red Pro 20TB – 300TB/year
At first, you may see those and think, that is almost as much as a lifetime on a consumer SSD. That would be incorrect. The reason is how WD defines Workload.
Per WD: “Workload Rate is defined as the amount of user data transferred to or from the hard drive. Workload Rate is annualized (TB transferred x (8760 / recorded power-on hours)). Workload Rate will vary depending on your hardware and software components and configurations.” (Source: WD Red Pro 20TB datasheet)
You have to get into the footnotes to see that, but WD is very consistent on putting that definition in its spec sheets, usually as footnote 2.

A few points here.
- Whenever WD discusses workload rate, it is an “up to” spec. It is not this is the number. A SSD endurance rating usually uses 4K random writes so if you do larger sequential writes usually you get way more than the endurance rating on SSDs.
- Most SSD endurance ratings are actually 4K random write figures. Reads to not go through a program cycle on the cells, and so those are closer to unlimited. If you had a workload that was, say 1% larger sequential writes and 99% reads, even $100 1TB consumer SSDs with relatively low endurance ratings will do many PB of data transfer combining in/ out streams. This is fundamentally a different methodology than WD is using for its drives.
- In contrast, the WD ratings are actually total data transferred and WD combines writes and reads in that figure. A high-end 300TBW/year drive with a 5-year warranty is thusly designed for up to around 1.5PB of data transfer in and out of the drive combined.
- WD also uses these workload figures on a per series or line basis. For example, the 2TB WD Red Pro is 300TBW/year and that is the same as the 20TB WD Red Pro. So the 2TB drive is roughly 150 drive transfers per year while the 20TB model is only 15 drive transfers per year. Effectively you can only read/ write from the entire drive once every three and a half weeks on the 20TB model.
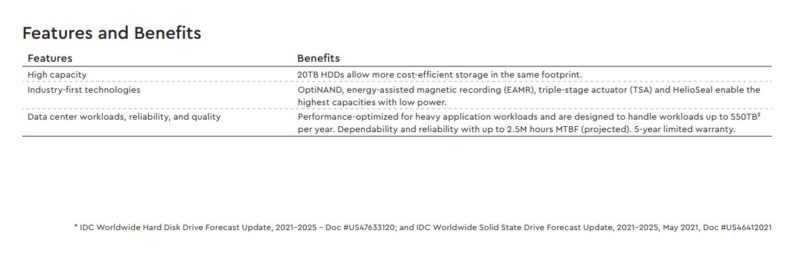
Looking up to the WD Gold and DC HC560 drives, those have up to 550TB/ year workload ratings on the 20TB drives that, let us face it, are very similar to the 20TB WD Red Pro in terms of overall features. They also greatly increase MTBF’s from 1M hours on the WD Red Pro 1TB drive to 2.5M hours on the Gold and HC560 drives.
How does that then translate to a workload figure? The maximum internal transfer rate of the drive is just over 260MB/s. Now, of course, drives do not sustain that because using a constant spin rate the outer edges of the drive are spinning faster than the inner tracks and so there is a big difference based on where the data is being written to or read from. Also, unless you are reading/ writing sequential data, it is very hard to get those figures from a hard drive. Assuming one could sustain that top speed figure, it would mean that it would take less than a day to go through 20TB. Likewise, it would take roughly two weeks to go through the 300TB workload rating at that top speed. Or you could, over the do 20TB once every 26 days or so.
Putting that into context, 14/365 = 3.8%. If someone told you that a 24-bay NAS was running at 3.8% of its capacity, then you would not be shocked. For many though, NAS units have low utilization. People may even think that the amount of data you write to the NAS is not going to be that much.
Still, there are other items at play here. If you are using mirroring or parity RAID, erasure coding, or just doing like Ceph replication, the number of writes is amplified by some factor to get redundancy. So 20TB written can mean say 22TB actually written to the RAID array or even 60TB if you are creating multiple copies. That is data transfer initiated by a client whether that is a person, a server, or some other process. There is more to it than that though.
Data transferred to and from storage media is not just what users initiate. For example, if you do a ZFS scrub on a pool for data integrity, then data is being read and transferred to the NAS’s host CPU, but it is not necessarily being transferred to a client device. The data never leaves the NAS. Likewise, rebuilding RAID arrays in the event of drive failures, a notable proposition on a 1M hour MTBF drive, can cause huge amounts of reads and writes on drives without users sending or receiving data. This may not seem like a big deal, but with the high UBER figures, orders of magnitude worse than modern server SSDs, there is a high likelihood that a full drive write will incur an error at some point, and so data integrity checking is becoming more important.
That 3.8% figure is low, largely because we are using the maximum transfer rate. Still, with user requests, VM requests, plus all of the background array operations, that is not an enormous figure.
Perspective on WD De-Rating Reliability of the Premium WD Red Pro 20TB Drives
To me, it seems like keeping workload ratings steady across lines is easy to understand, but it feels wrong, especially with a 10x capacity jump in the line. Realistically, the WD Red Pro seems to share the platform with the Gold and HC 560, including features like the OptiNAND. Those are up to 550TB /year platforms with 2.5M hour MTBF ratings.
While I understand the need to differentiate, these low workload figures are setting the stage for things like future warranty denials. If you do 330TB in a year, getting closer to 5% maximum utilization, then WD can say that you used the incorrect drive with the WD Red Pro even though it is the same platform as the 550TB/ year models.
Not scaling workload even with 10x the media to work with between the 2TB and 20TB drives seems counterintuitive. That combined with using a “workload rating” that is described as “up to” feels like many customers will get confused with SSD endurance ratings that we are accustomed to seeing. To WD’s credit, they do clearly define these terms but it takes some footnote hunting.
Final Words
The key takeaway though is that hard drives are going down a clear path. Hard drives have higher failure rates, higher UBERs, and lower endurance, especially for NAS workloads that are read-intensive. Of course, they come with lower costs which is great and the reason to keep using them. Still, what the WD Red Pro, a premium segment, of the premium Red series of NAS drives, shows us is that it is time to stop thinking of SSDs, even QLC SSDs, as lower endurance than their spinning counterparts.


Are the ratings about warranty or do the drives really fail that quickly? Since the 300TB limit takes a short time to write, it would be interesting to create an ZFS pool using around 8 drives and then alternatively delete files, write lots of data and then scrub to see whether errors are detected or a failure occurs. A parallel experiment with Toshiba drives would keep things interesting.
Looks like the same for Seagate’s IronWolf Pro line:
https://www.seagate.com/files/www-content/datasheets/pdfs/ironwolf-pro-20tb-DS1914-19-2112US-en_US.pdf
But in the Seagate data sheet it doesn’t specify if the “Workload Rate Limit” includes reads writes or just writes.
Eric – the big challenge with this, is that that is 8x $550 (after-tax) for the Red Pro alone, plus a test rig running for weeks. In the end, you only get a small sample size so even that is not overly useful.
Patrick — I think that for the sort of test Eric is thinking of, you don’t really need much sample size for it to be useful. Even 2 or 4 drives would probably tell you if the lowered endurance is real, and the host could be whatever you’ve got lying around.
The way I see it, there are two possibilities: newer HDD recording technologies like HAMR/MAMR really do decrease drive lifetime significantly and these lower limits reflect that, or WD artificially lowered that limit for market segmentation, and while they may be out of warranty when WD specifies, they’ll last as long as you’d expect from previous generations. Knowing which one it is would be useful, even if the sample size isn’t large enough to measure an actual endurance with any accuracy.
Nice article
Duplicate paragraph though
“Finally, the higher-end 7200 rpm line is the WD Red Pro. This is the high-end drive that you would reasonably think is the best drive on the market. This is not for low-end NAS-es. It is for higher-end NASes with up to 24 drives and that perhaps need higher performance.”
And this was the reason I absolutely refuse to buy Western Digital Drives at all now. At least Seagate is honest about the Endurance and it is only based on the Writes as like in an SSD, reads are practically free.
It is articles like these in-depth, brain-stretching analytical pieces where STH truly shines.
In cricket terms, I think this article has “hit for a six” in terms of quality reporting.
Seagate’s Ironwolf Pro series 12-20TB Helium CMR are all, also rated at 300 Worlkload Rate. See the current datasheet pdf. [1]
@Mike Sawyer
Seagate Workload rate is also read + write, see the following from seagate.com knowledge base:
“Current Seagate disk drives keep track of various drive usage such as power on hours, lifetime writes and lifetime reads from the host computer. With this data we can calculate an Annualized Workload Rate using this simple formula:
Annualized Workload Rate =
(Lifetime Writes + Lifetime Reads) * (8760 / Lifetime Power On Hours)” [2]
[1] https://www.seagate.com/files/www-content/datasheets/pdfs/ironwolf-pro-20tb-DS1914-19-2112US-en_US.pdf
[2] https://www.seagate.com/support/kb/annualized-workload-rate-005902en/
@Sleepy or in STHs ratings, a 6.4, 6.3, 6.2, 6.6
Ehhm, “<10 in 10^14" for errors they are writing in their datasheets? Thats super terrible as most consumer drives are <1 in 10^14 and datacenter drives usually are <1 in 10^15.
That would be translate in <1 in 10^13: factor 10 worse!
I notice that WD doesn’t even list a workload rating one way or another on their Blue and Black consumer hard drives.
For Red and Red Plus (which are the “regular” non-SMR Reds after SMRgate) WD is giving as mentioned 180TB/year.
I would say there is absolutely no data in this number, it’s just noise. It’s the same for drives from 1TB to 14TB, from 2011 until now, helium and air, low RPM and high(er) RPM drives, nonSMR and SMR drives, mostly 3.5″ but there’s even a 2.5″ (“LAPTOP” size) there! It’s all the types of drives that are vaguely common today!
This isn’t the result of any measurement, statistic or anything technical, it’s just something someone came up with and put there. We can only speculate WHY or WHO did that (I’d say the marketing department to push people that aren’t too technical or who aren’t spending their own money into buying a higher tier drive). But anyone who knows better should just ignore it, completely. That goes probably for the rest of the datasheets (at least from WD), unless of course it’s just to expose how laughable they are and be shocked “how they can say that with a straight face”.
You have repeated twice the paragraph that starts with:
Finally, the higher-end 7200 rpm…
I doubt the workload rating is actually meaningful, but it could be that the workload rating does not scale with capacity because it’s actually about the arm wearing out? That could possibly be universal across capacities.
I had also thought it might be about the heads, but then it should scale with the number of heads.
I sure hope this number was just pulled out of someone’s ass, or it really only includes reads.
After having two rebuild failures on homebuilt raid5 MD arrays in the past due to undetected bad blocks(yes, on tler capable drives!) I set up my Synology to do a full scrub of each of the arrays each week.
That alone would eat up almost all the life of the drives, if you believe their rating…
So can someone recommend a reliable 16tb drive for a RAID 6 Synology setup? Seams like every drive I look at has this doomed feeling to it.
Comments are closed.