Crucial P3 Plus 1TB Performance Testing
We test using both the default smaller test size as well as larger test sets on our benchmarks. This allows us to see the difference between lighter and heavier workloads.
CrystalDiskMark x64
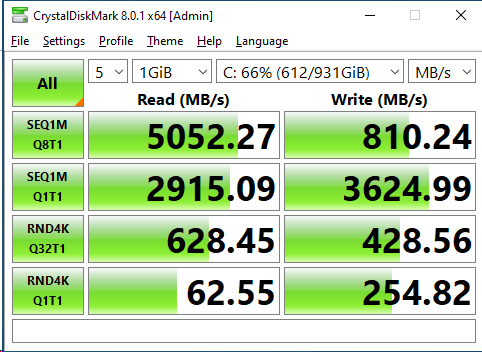
CrystalDiskMark is used as a basic starting point for benchmarks as it is something commonly run by end-users as a sanity check.
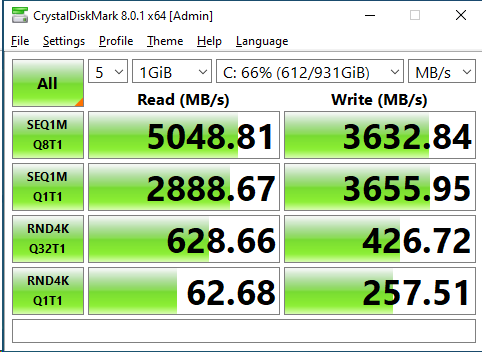
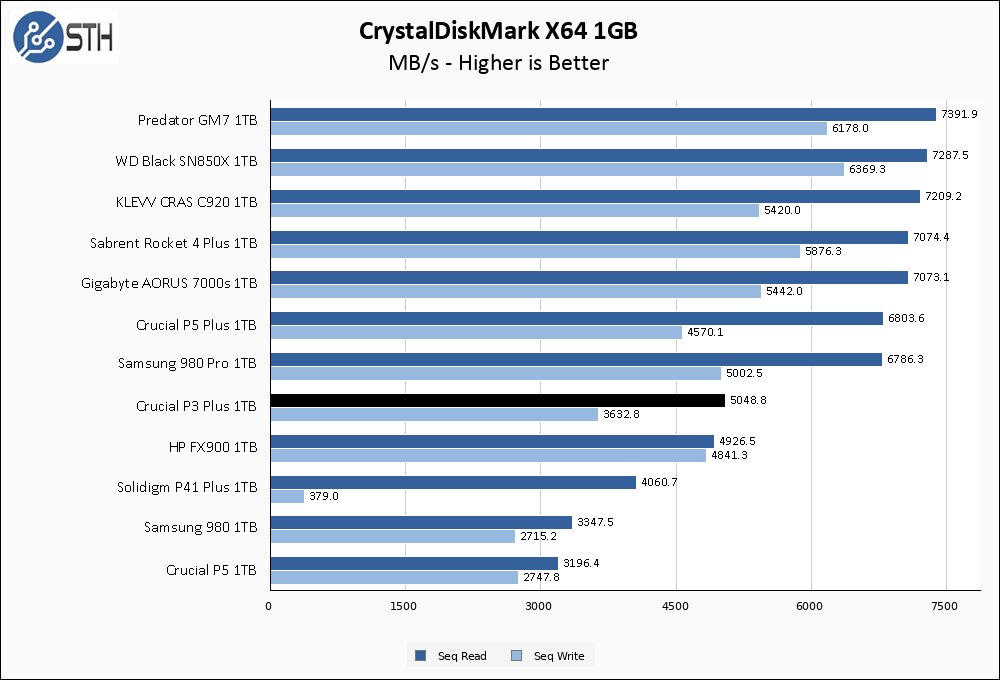
The Crucial P3 Plus 1TB nails its advertised specs in CrystalDiskMark. Both read and write speeds slightly exceed their rated sequential performance, which is good to see. In the context of other Gen 4 drives the performance of the P3 Plus is not much to look at, but it does exactly what it says it will do so I give it a pass.
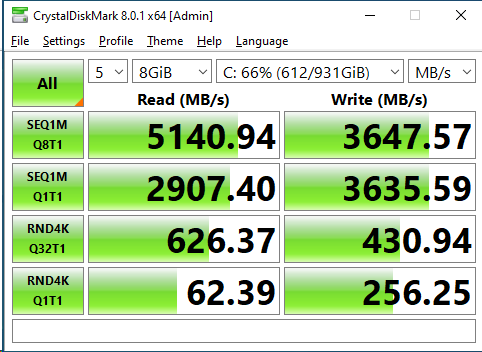
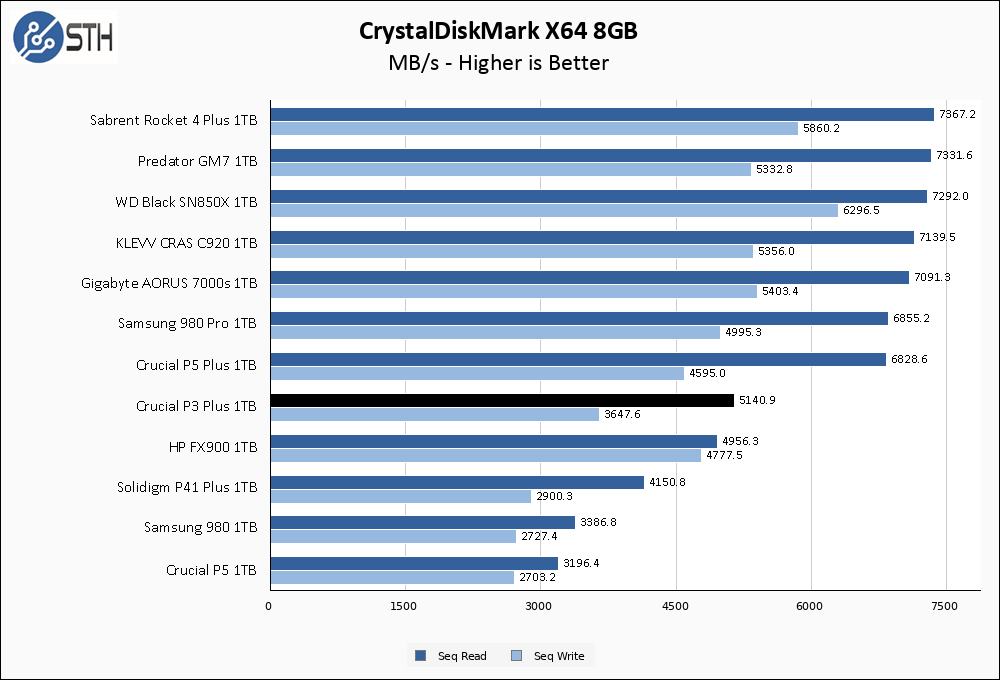
In the larger CrystalDiskMark test, performance remains essentially unchanged. At least, it does in this run of CrystalDiskMark. I am going to show you another result:
This is another run of the smaller CrystalDiskMark benchmark. As you can see, read speed is just fine but sequential write speed fell off a cliff. This is the behavior I was able to induce in the drive by re-running my benchmarks in rapid succession, which is something that I do while testing drives. The QLC nature of the P3 Plus means that when performance is good it will be good, but when pushed hard the drive can really suffer in write performance.
ATTO Disk Benchmark
The ATTO Disk Benchmark has been a staple of drive sequential performance testing for years. ATTO was tested at both 256MB and 8GB file sizes.
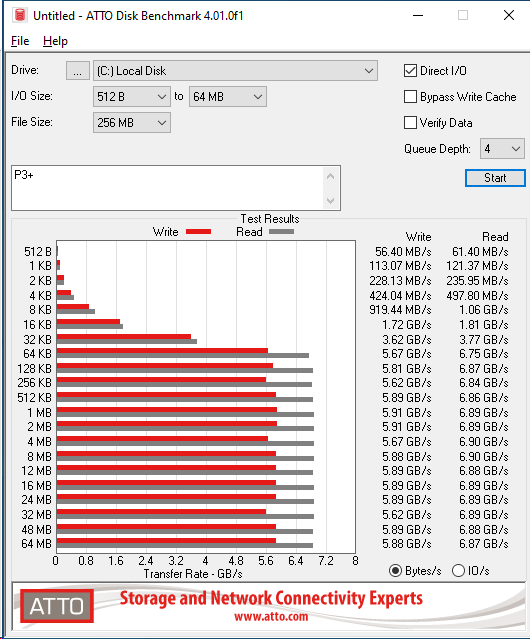
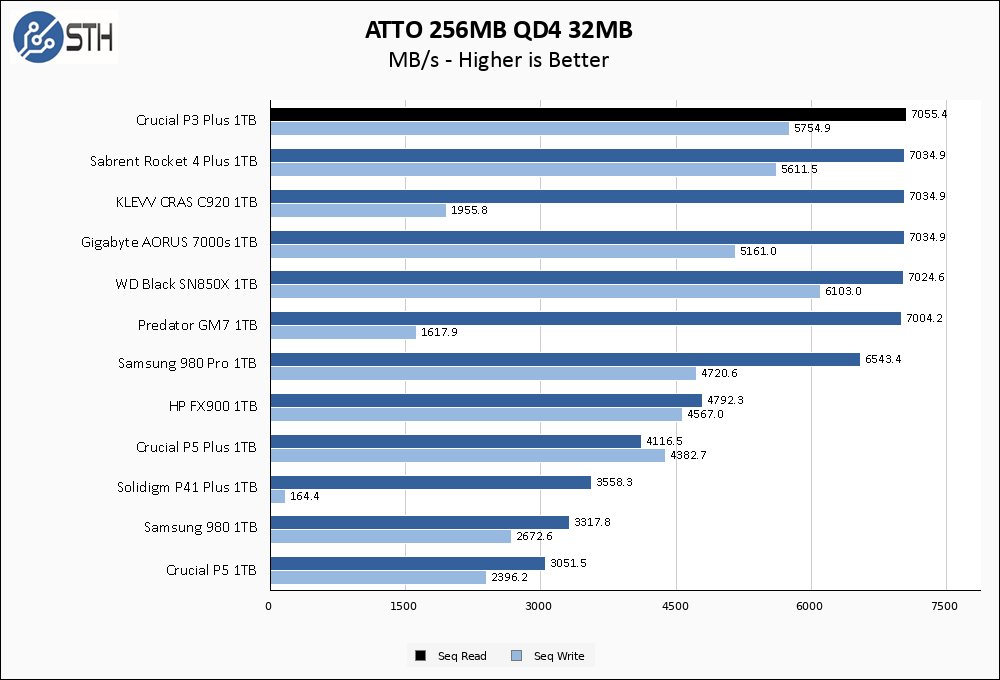
Quite frankly, I do not believe this benchmark for a second. The P3 Plus shows top-tier performance in ATTO, far exceeding the advertised performance of the drive. I am still going to show you the ATTO results, but I am essentially disregarding this benchmark as invalid.
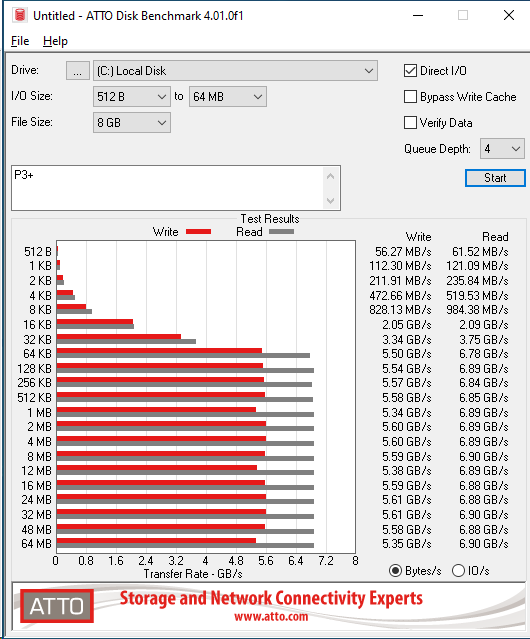
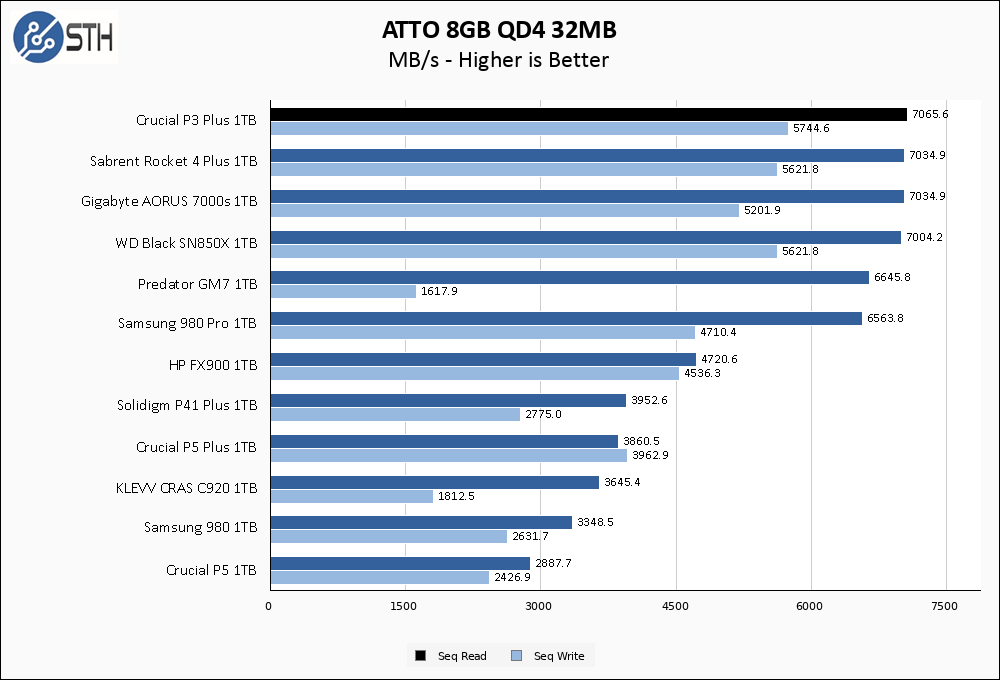
There is no way a drive rated for 5GB/s read and 3.6GB/s write pulls 7/5.7GB/s, so I am disregarding this result other than to show you what we saw. This was an anomaly.
Anvil’s Storage Utilities
Anvil’s Storage Utilities is a comprehensive benchmark that gives us a very in-depth look at the performance of the drives tested. This benchmark was run with both a 1GB and 8GB test size.
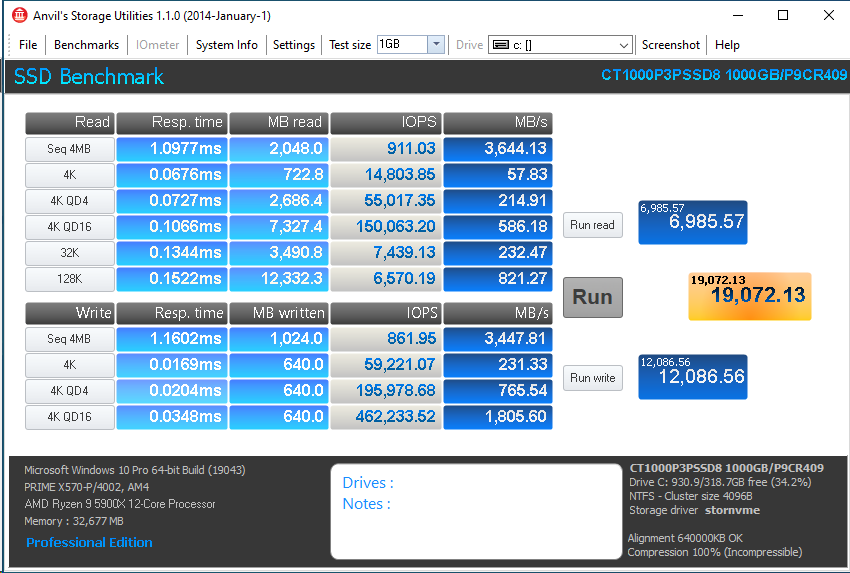
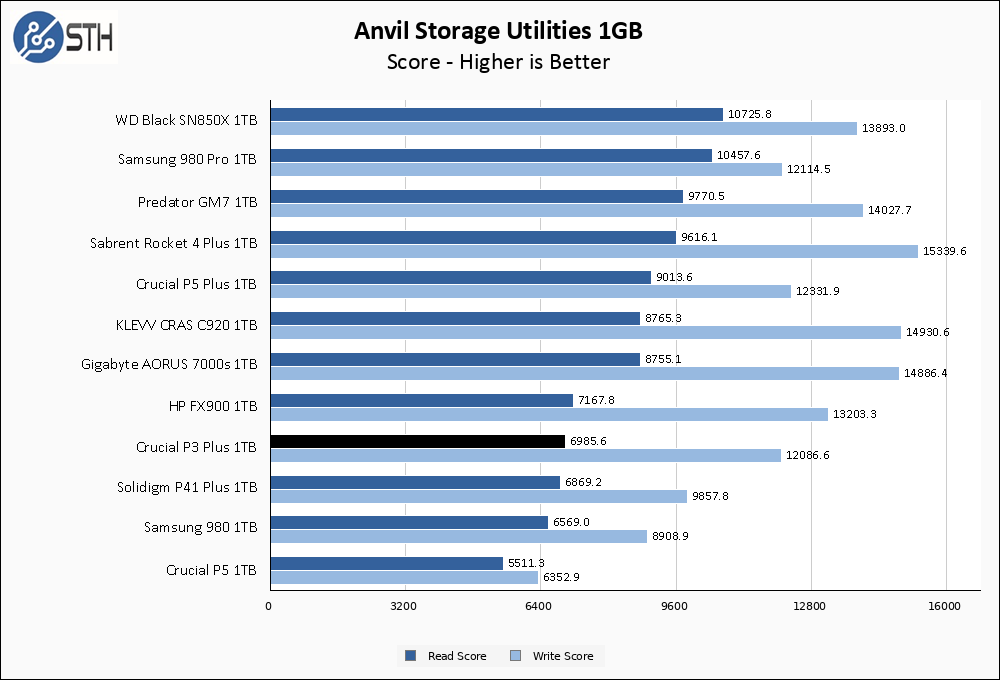
In Anvil, the P3 Plus performance has returned to planet sanity. Overall, I consider these results pretty good, with the P3 Plus clearly outpacing the Solidigm P41 Plus which is a drive with a roughly similar design.
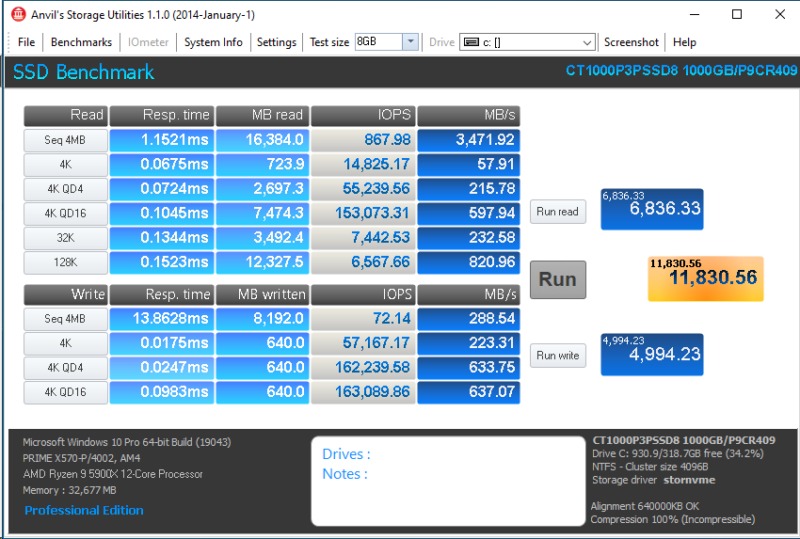
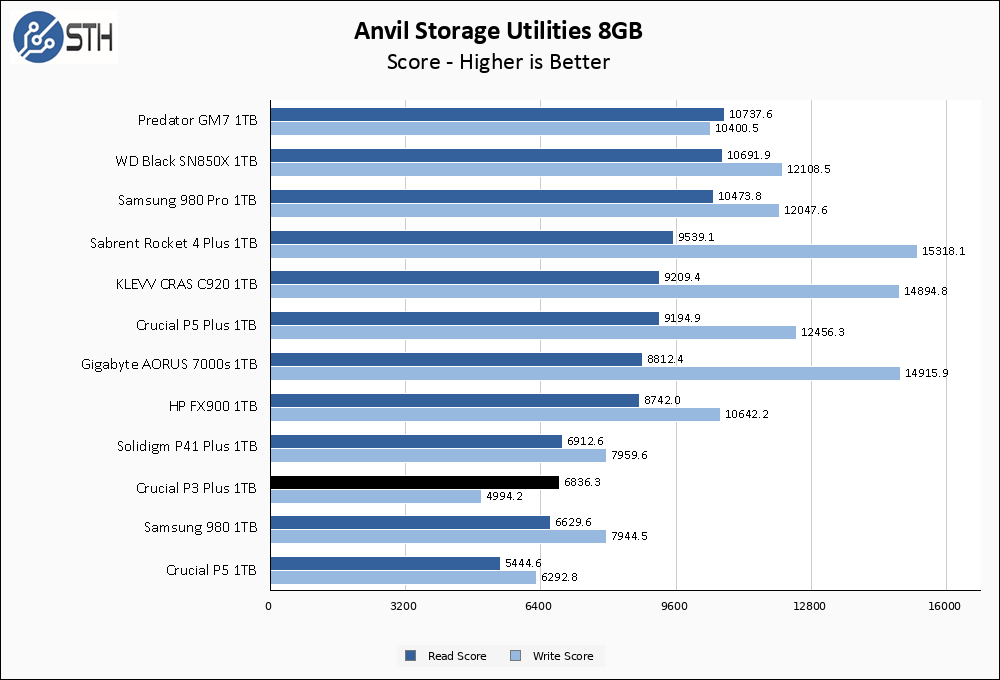
The larger Anvil test has the P3 Plus falling behind the P41 Plus this time, particularly in write performance. Intense write performance is never going to be the strong suit of a QLC drive, and it shows here.
AS SSD Benchmark
AS SSD Benchmark is another good benchmark for testing SSDs. We run all three tests for our series. Like other utilities, it was run with both the default 1GB as well as a larger 10GB test set.
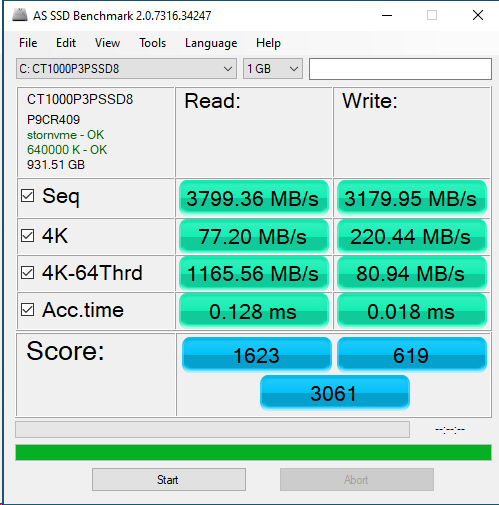
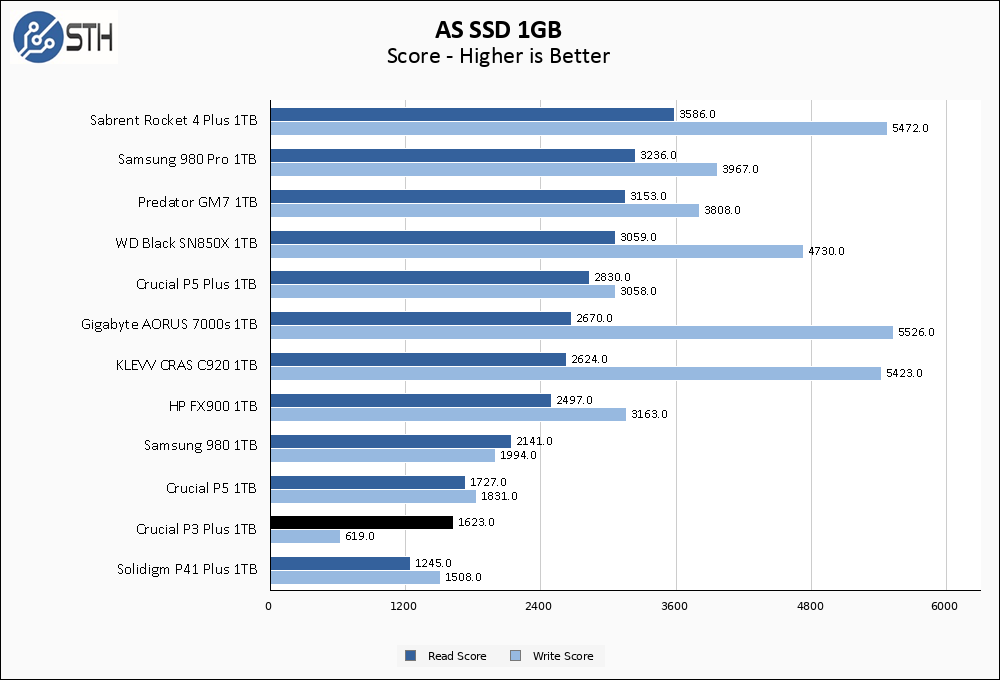
The Crucial P3 Plus turns in a poor result in AS SSD. While read performance still has the drive outpacing the P41 Plus, write performance is really holding this drive back with terrible highly threaded write performance.
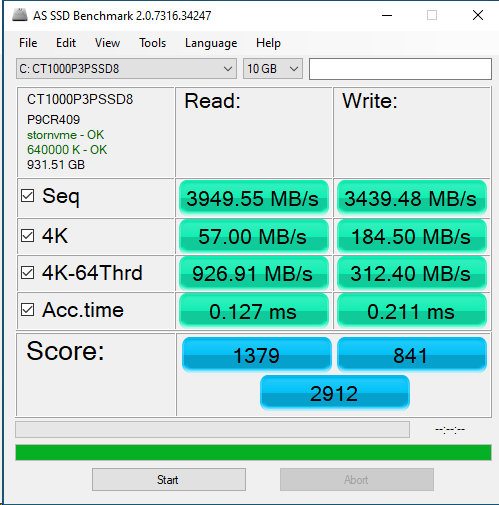
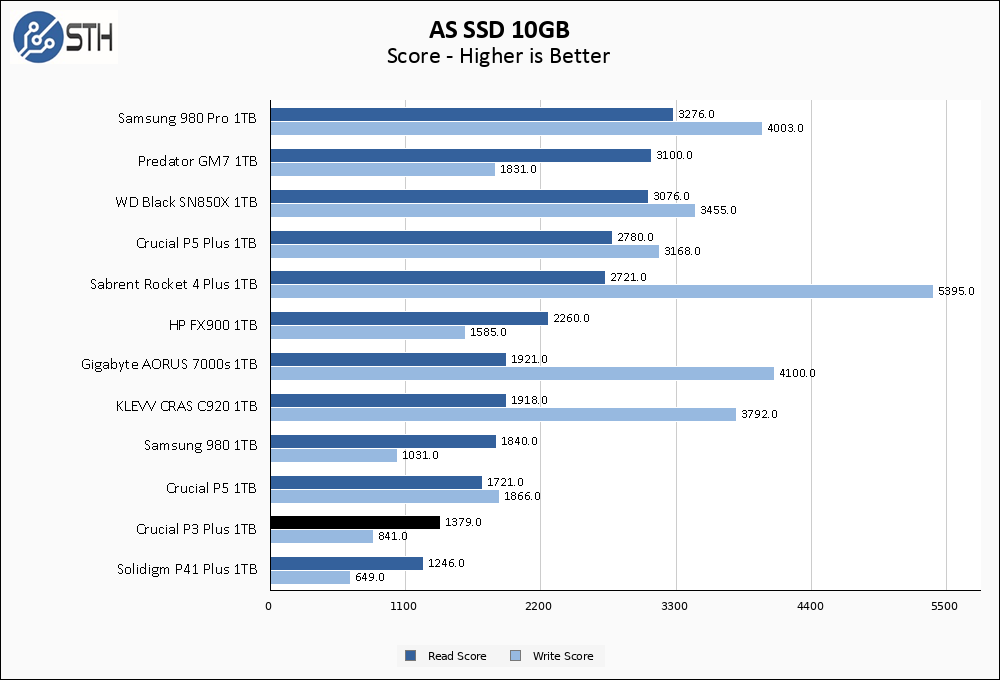
The larger AS SSD demonstrates the variability of performance that can be expected in a low-cost QLC drive, as the P3 Plus somehow turns in better write performance on the larger test.
SPECworkstation, thermals, and our conclusion are up next.


When a test like ATTO 256MB QD4 32MB scores much better than expected, is the result repeatable? Is there a special pattern of use where the drive really performs that well which could be employed in a disk scheduling algorithm for an operating system?
Alternatively, if it’s a bug in the benchmark, why aren’t all devices affected. If they are, then why in different ways? It seems to me that some source-code auditable tests would be useful. Alternatively, could a ticket be opened with ATTO as to why their software exhibits what appears to be an bug on this test?
I suppose the result could also reflect a separate hardware issue with test rig itself.
Thanks for sharing all the results that were observed. In my opinion reporting the outliers is an important part of treating SSD testing as a science.
Crucial P3 Plus review
For the love of Pete, this reads like homework a student wrote the night before handing it in.
First of all, why do you ignore the use case of a drive before diving in to describe its performance?
This drive, like the Solidigm P41, is focused on the lowest cost per byte. In one of your final paragraphs you mention “The Crucial P3 Plus 1TB is $52 as of today. The Solidigm P41 Plus is $50. Every drive that I tested that was markedly better than either of those two drives is at least $15 more expensive”.
This means these two drives are *at least* 30% cheaper than any competition.
If you were reviewing a Prius you wouldn’t compare it’s performance to a Corvette or Charger yet in this review you state things like:
> This result is nothing short of horrible.
And
> The best thing to be said here is that it did not catastrophically fail in any particular test,
But you follow that immediately with:
> it is only at the bottom of the chart in Energy with much more respectable results in Product Development General Operations.
This is a drive, that based on price, you would *expect* to perform at the bottom in every category, but when it doesn’t you proclaim that it is a horrible device.
The use case matters and seeing benchmarks that are focused on that use case would be more beneficial. As an example, QLC is great for a backup target because those workloads are mostly WORM. There are very few overwrites or modifications to data so very little endurance will be used over the life of the drive.
For a workload like that we are less interested in how quickly it can be filled completely and more interested in how quickly it can inject a ZFS snapshot. (A thing we expect you’re doing based on your TrueNas articles)
Finally, in the Review Overview section you give a score of 6 out of 10 for Feature Set. But nowhere in the article do you cover the features that are implemented or those that are missing. Yet you have a quantitative score for this metric. What features are you scoring this (and all other drives) against?
I know this is the format you’ve used for SSD reviews for quite some time and you have a Moto of “if it’s not broke, don’t fix it”. But this is broke. Your testing methodology has fallen behind the rest of the industry the the execution of specific reviews is lacking.
John Stacker hits the nail on the head. But can you adapt?
Comments are closed.