AMD EPYC 7452 Performance
For this exercise, we are using our legacy Linux-Bench scripts which help us see cross-platform “least common denominator” results we have been using for years as well as several results from our updated Linux-Bench2 scripts. Starting with our 2nd Generation Intel Xeon Scalable refresh benchmarks, we are adding a number of our workload testing features to the mix as the next evolution of our platform.
At this point, our benchmarking sessions take days to run and we are generating well over a thousand data points. We are also running workloads for software companies that want to see how their software works on the latest hardware. As a result, this is a small sample of the data we are collecting and can share publicly. Our position is always that we are happy to provide some free data but we also have services to let companies run their own workloads in our lab, such as with our DemoEval service. What we do provide is an extremely controlled environment where we know every step is exactly the same and each run is done in a real-world data center, not a test bench.
We are going to show off a few results, and highlight a number of interesting data points in this article.
Python Linux 4.4.2 Kernel Compile Benchmark
This is one of the most requested benchmarks for STH over the past few years. The task was simple, we have a standard configuration file, the Linux 4.4.2 kernel from kernel.org, and make the standard auto-generated configuration utilizing every thread in the system. We are expressing results in terms of compiles per hour to make the results easier to read:
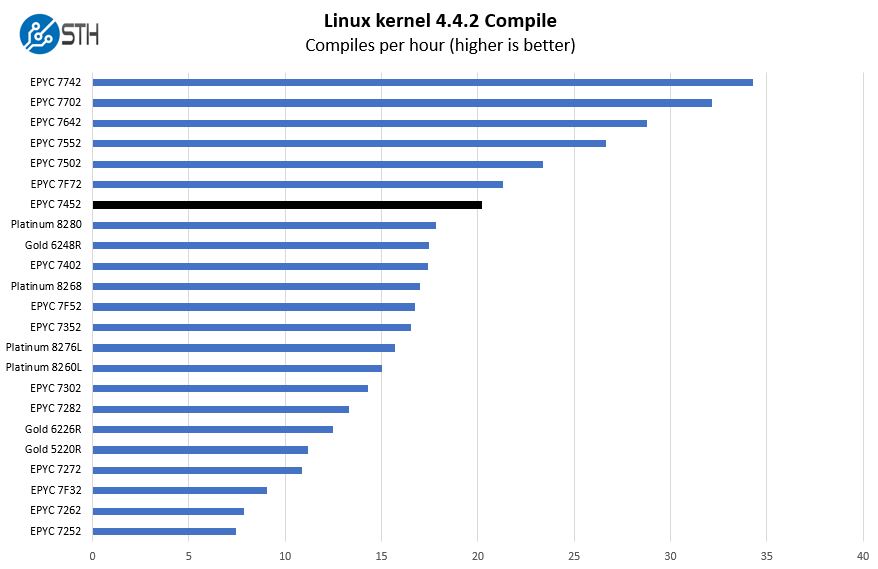
The performance with this chip is certainly one of the more interesting aspects. While this chip has a lot of cores, it also has a lower TDP. That is going to put it in a place somewhere between the other 24 and 32 core offerings.
c-ray 1.1 Performance
We have been using c-ray for our performance testing for years now. It is a ray tracing benchmark that is extremely popular to show differences in processors under multi-threaded workloads. We are going to use our 8K results which work well at this end of the performance spectrum.
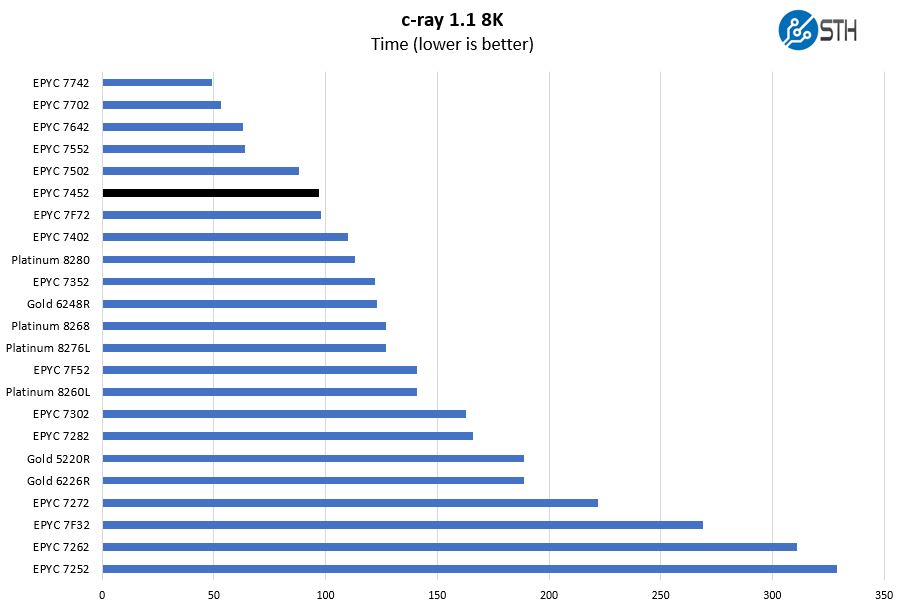
This is a benchmark that we started to use several years ago. There are architectural reasons the AMD Zen and Zen 2 chips perform extremely well here. Instead of looking at AMD versus Intel, it is best to look at AMD v. AMD here. Here, the AMD EPYC 7502 performs much better than the EPYC 7452 which is largely TDP and clock speed driven.
7-zip Compression Performance
7-zip is a widely used compression/ decompression program that works cross-platform. We started using the program during our early days with Windows testing. It is now part of Linux-Bench.
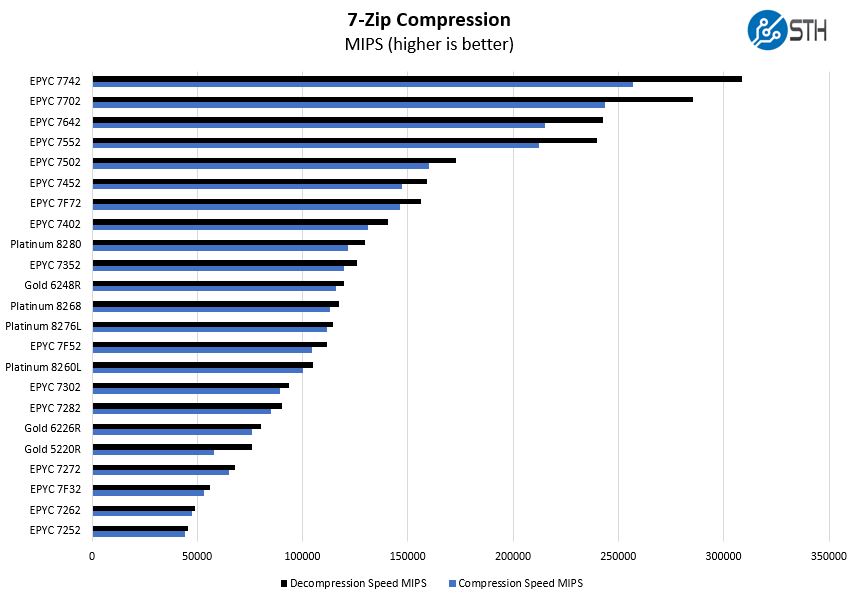
Something you will notice here is that the AMD EPYC 7F72 has 25% fewer cores but those cores have more power and TDP headroom. Since we are using a methodology of removing the top and bottom quartiles of benchmark runs and then averaging the remainder, sometimes, as in this test the EPYC 7452 comes out ahead. If we averaged the raw results, the EPYC 7F72 would have come out on top. We use this methodology to better approximate sustained performance since it removes outliers. Still, we wanted to provide some context here.
NAMD Performance
NAMD is a molecular modeling benchmark developed by the Theoretical and Computational Biophysics Group in the Beckman Institute for Advanced Science and Technology at the University of Illinois at Urbana-Champaign. More information on the benchmark can be found here. With GROMACS we have been working hard to support AVX-512 and AVX2 architectures. Here are the comparison results for the legacy data set:
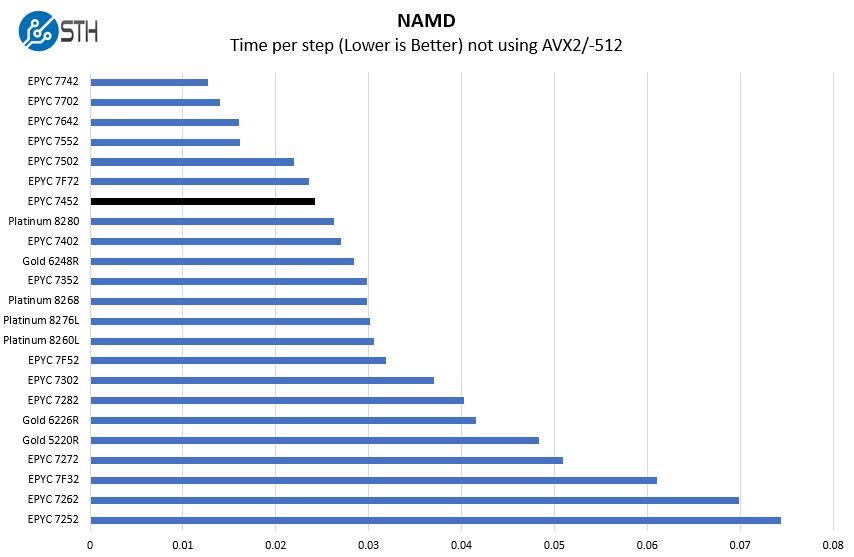
As we go through these benchmarks, you can look to the Intel Xeon Platinum 8280 numbers as being similar to the Xeon Gold 6258R representing the top-end of the Intel Xeon line at this time. Our Gold 6258R review is coming and is already submitted to the publishing queue. Simply having more cores is helping the EPYC 7452 stay competitive with these Xeon offerings.
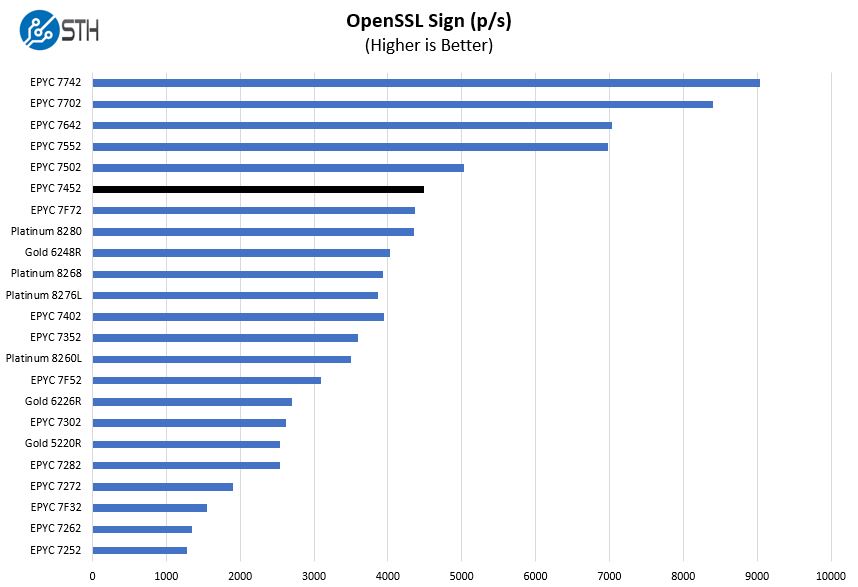
OpenSSL Performance
OpenSSL is widely used to secure communications between servers. This is an important protocol in many server stacks. We first look at our sign tests:
Here are the verify results:
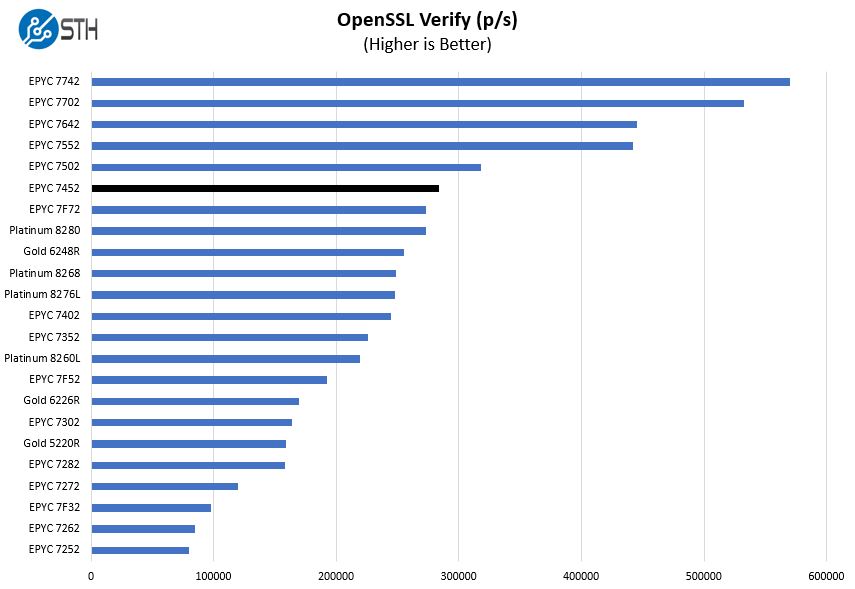
This is a workload that Intel may argue can be offloaded to QAT accelerators. Still, most architectures today do not have QAT accelerators since Intel uses this as an add-on sale either through accelerator cards or upgraded PCHs. Again, we have good performance, but it is more in the range of 24-28 core Intel Xeon performance than the EPYC 7502. Given the $2025 price tag, this is still a very solid result.
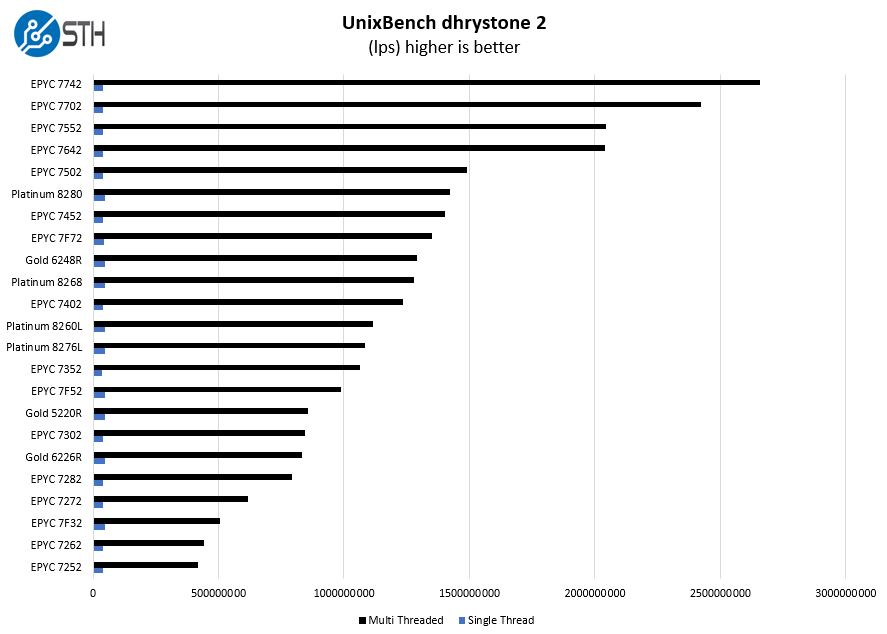
UnixBench Dhrystone 2 and Whetstone Benchmarks
Some of the longest-running tests at STH are the venerable UnixBench 5.1.3 Dhrystone 2 and Whetstone results. They are certainly aging, however, we constantly get requests for them, and many angry notes when we leave them out. UnixBench is widely used so we are including it in this data set. Here are the Dhrystone 2 results:
Here are the whetstone results:
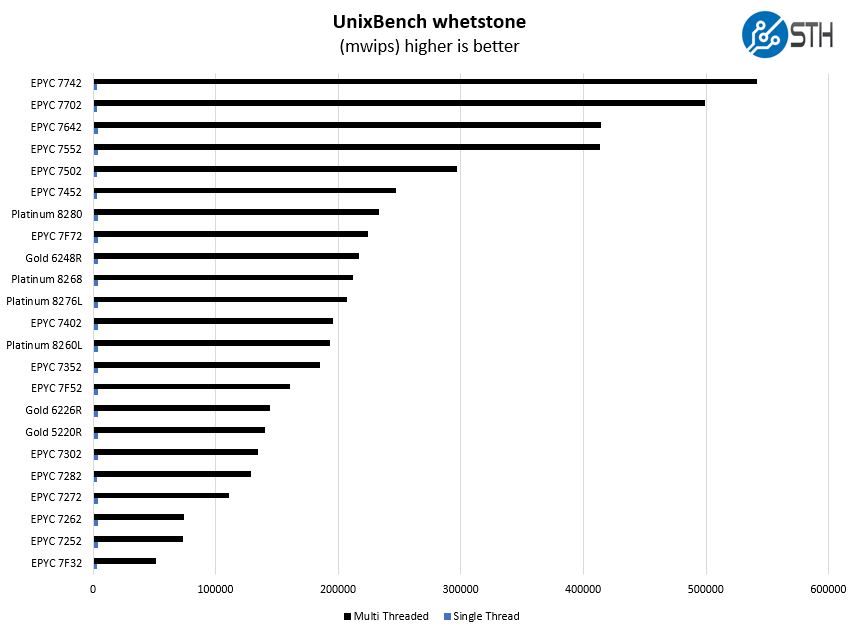
Perhaps the best competitor in the 28 core Intel space is the Intel Xeon Platinum 8276L. That is now analogous to the Xeon Gold 6238R refresh part at 165W TDP. The Xeon Gold 6238R is a $2612 part so it is more expensive than the EPYC 7452, but not that much more so.
Chess Benchmarking
Chess is an interesting use case since it has almost unlimited complexity. Over the years, we have received a number of requests to bring back chess benchmarking. We have been profiling systems and now use the results in our mainstream reviews:
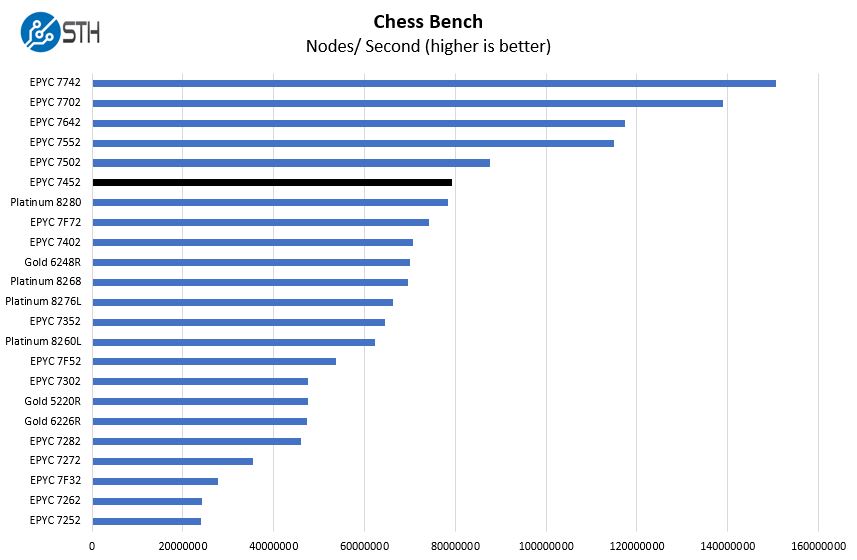
Here we get the performance just about around a 28-core Xeon Scalable processor which is a good result. One will notice that the other AMD EPYC 32-core offerings perform significantly better, again we attribute this to clock speeds and TDP.
STH STFB KVM Virtualization Testing
One of the other workloads we wanted to share is from one of our DemoEval customers. We have permission to publish the results, but the application itself being tested is closed source. This is a KVM virtualization-based workload where our client is testing how many VMs it can have online at a given time while completing work under the target SLA. Each VM is a self-contained worker.
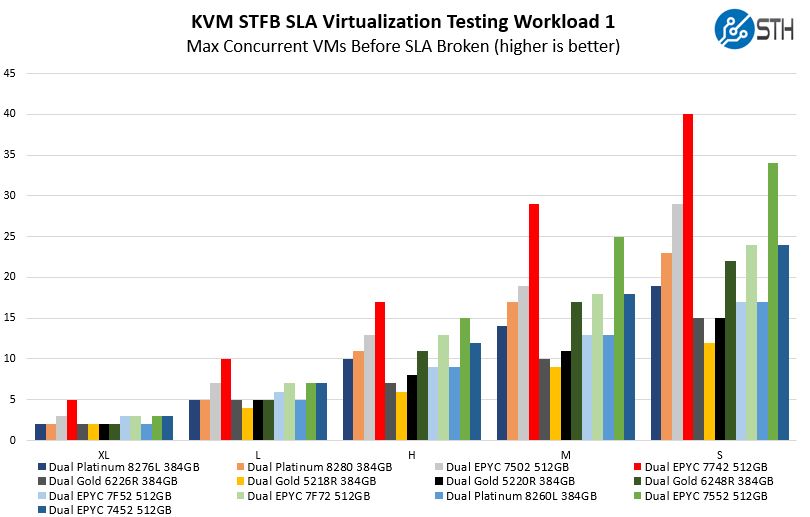
On the virtualization side, we see the benefits of having 32 cores. Since this is much more than just per-core performance limited as we are hitting memory as well, this is a bit of a broader application test.
Next, we are going to get into the “so what” and discuss market positioning for the processor before giving our final words.


Seeing the performance of this chip and the other EYPC chips next to the Intel Xeon offerings got me thinking:
“Oh how the once mighty have fallen…”
Comments are closed.