WD Red SA500 1TB Performance Testing
We are moving towards using larger test sizes on our benchmarks, but on several tests, we also used the smaller default test sizes. This allows us to see the difference between lighter and heavier workloads.
A word of warning before you see the benchmarks; unfortunately, I do not have many SATA drives in my testing database, as up to this point I have focused mostly on consumer-class PCIe SSDs. As a result, the WD Red SA500 1TB will be making many appearances near the bottom of the benchmark comparison chart.
Blackmagic Disk Speed Test
This is a popular speed test in the video community. It shows whether a storage device is suitable for throughput required at a given video format.
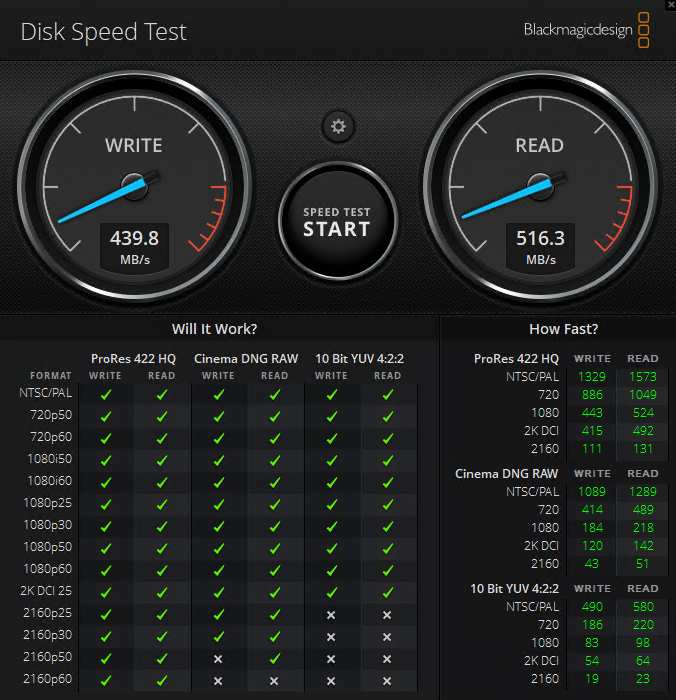
The WD Red SA500 1TB is limited to a SATA interface, so a number of these formats were simply never going to work on this drive.
CrystalDiskMark 7.0.0 x64
CrystalDiskMark is used as a basic starting point for benchmarks as it is something commonly run by end-users as a sanity check.
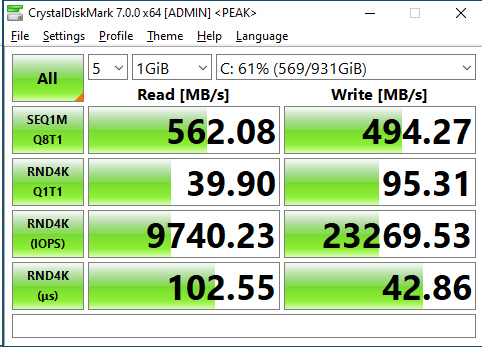
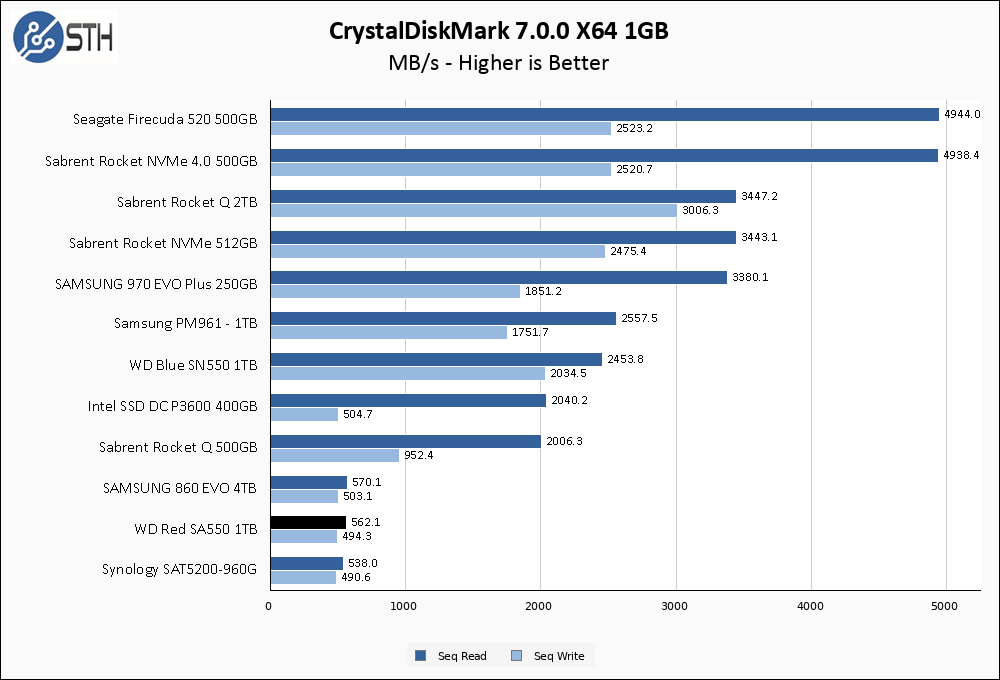
The WD Red SA500 1TB arrives right in line with our other SATA SSDs in CrystalDiskMark, and gets close to the rated 560 MB/s read and 530 MB/s write that is advertised.
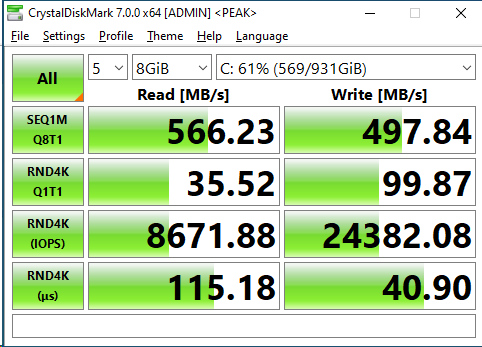
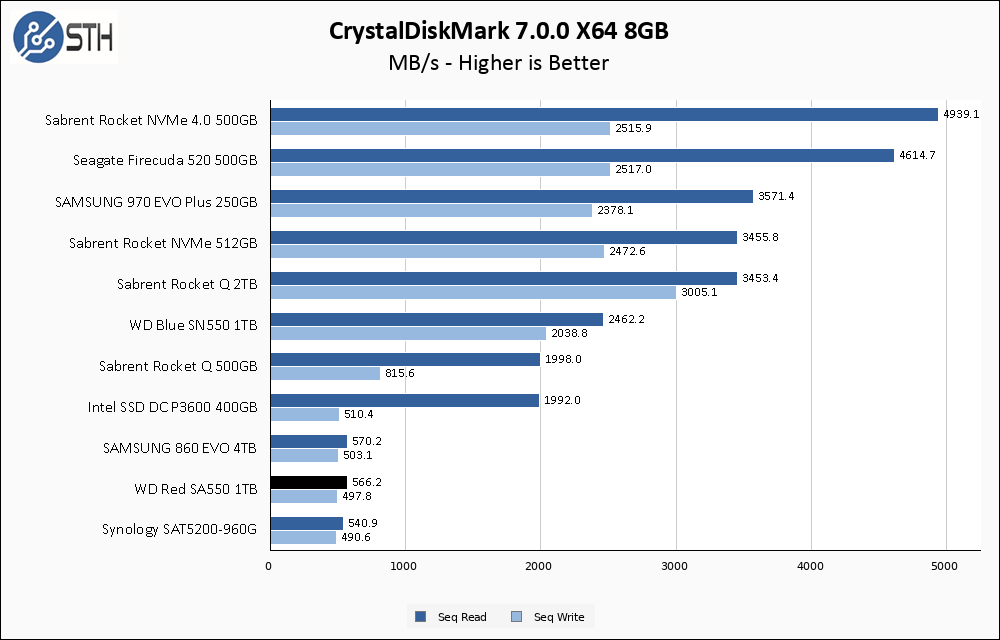
The larger test set has no effect on the SA500 whatsoever.
ATTO Disk Benchmark
The ATTO Disk Benchmark has been a staple of drive sequential performance testing for years. ATTO was tested at both 256MB and 8GB file sizes.
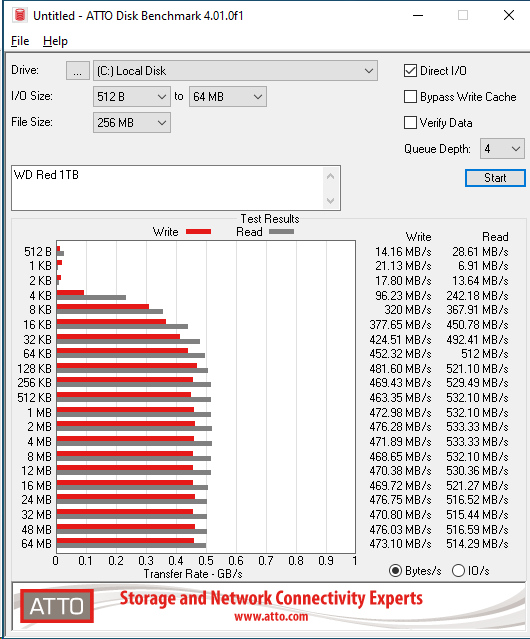
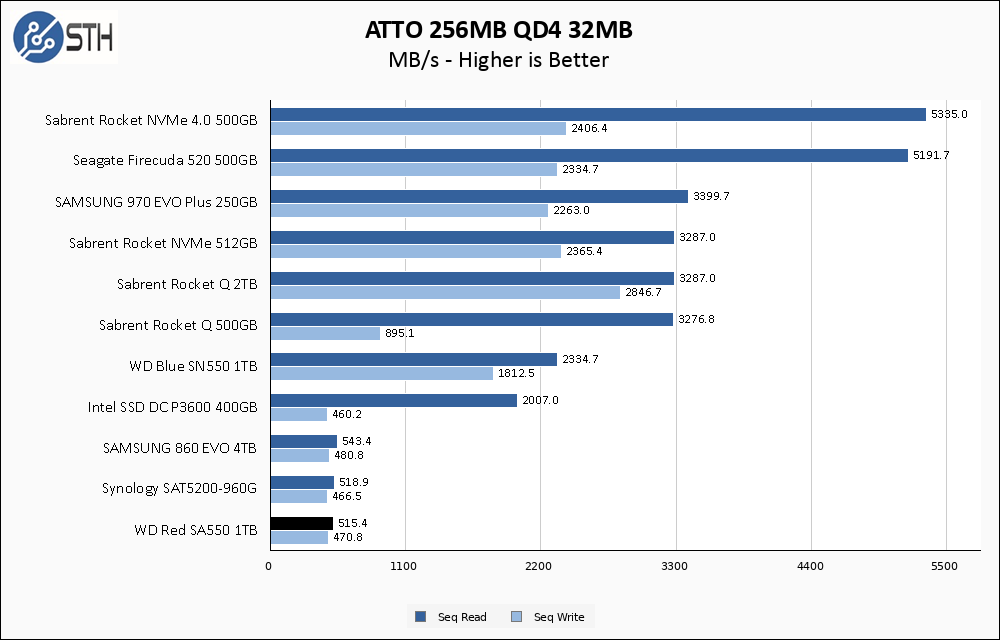
Relative to the advertised specs, ATTO shows a slight dip in performance. Additionally, compared to the SAT5200-960G the WD Red SA500 1TB has a bit less consistent performance overall, wavering up and down slightly through the duration of the ATTO test.
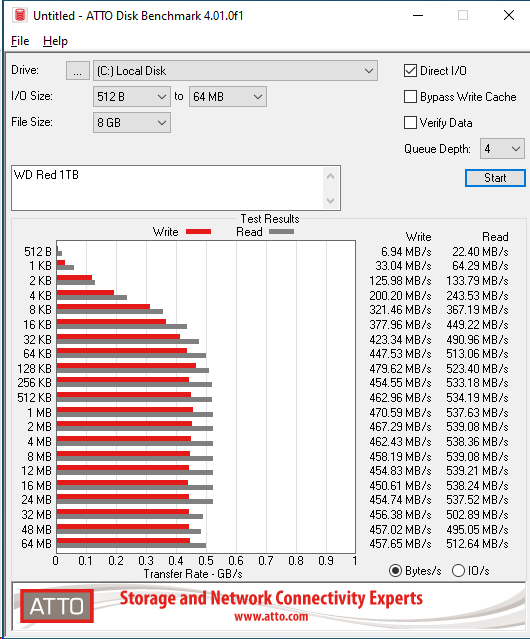
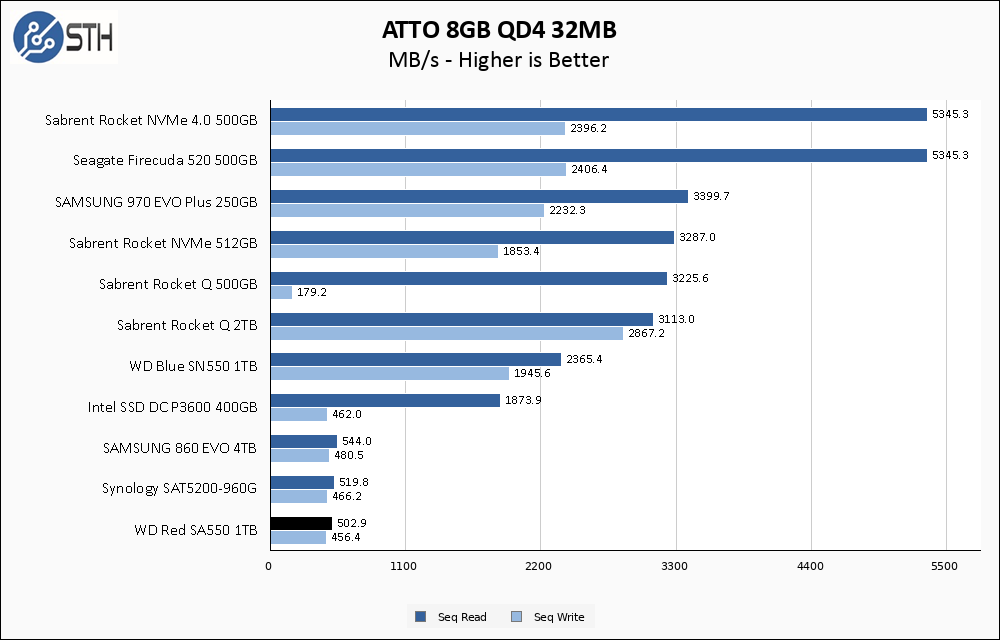
Once again the larger test set has no negative impact on performance; the ATTO 8GB test set is nearly indistinguishable from the 256MB one.
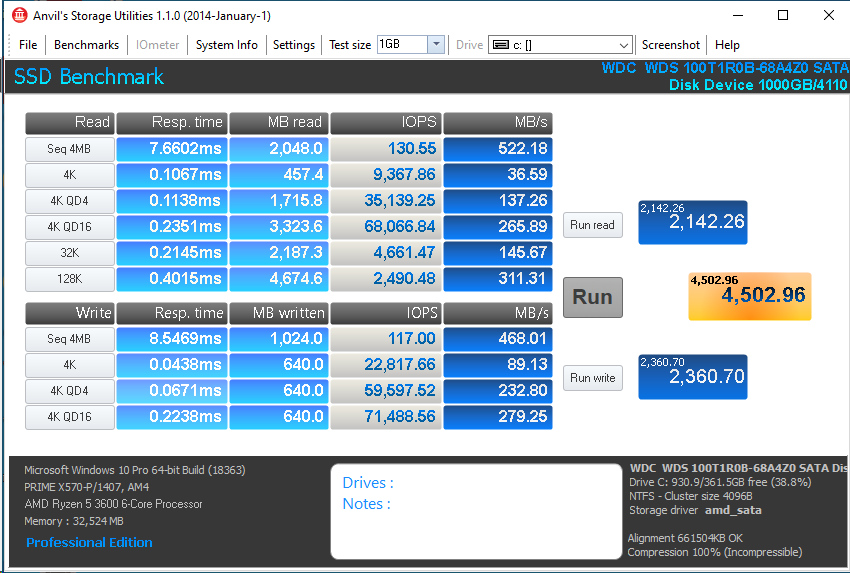
Anvil’s Storage Utilities
Anvil’s Storage Utilities is a comprehensive benchmark that gives us a very in-depth look at the performance of drives tested. This benchmark was run with both a 1GB and 8GB test size.
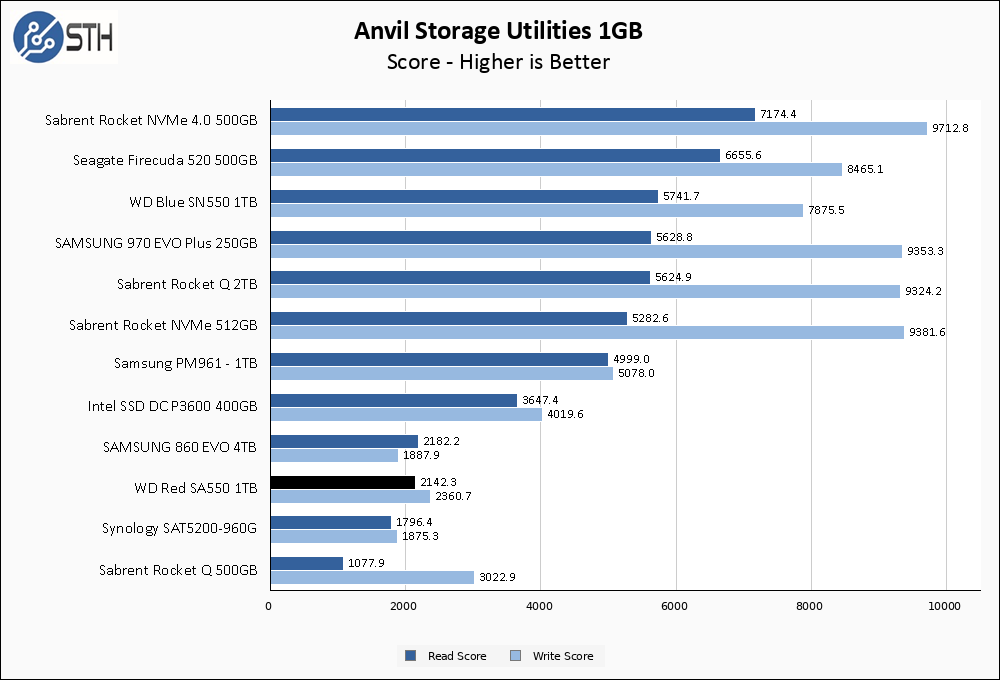
In Anvil the WD Red SA500 1TB manages to distance itself slightly from the Synology drive, and notches better performance overall than the Samsung 860 EVO as well. All three SATA drives exhibit better read performance than the Rocket Q 500GB.

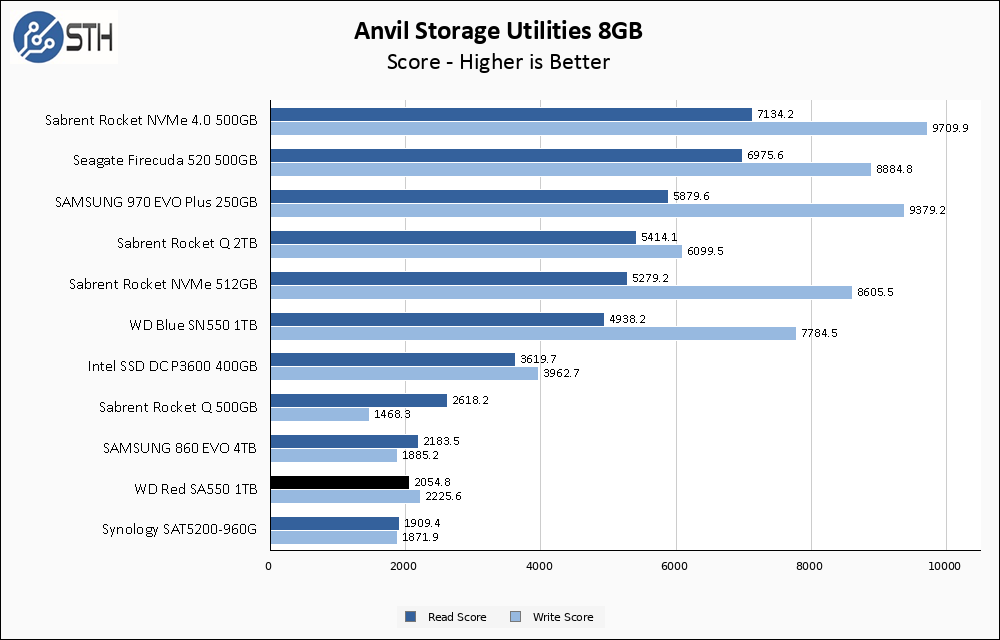
With the larger 8GB test size, the WD Red SA500 1TB loses slightly to the Samsung in overall read speed but takes the SATA performance crown over both the Samsung and Synology drives. All three SATA drives are outpaced by our NVMe drives, with the exception of the Rocket Q 500GB.
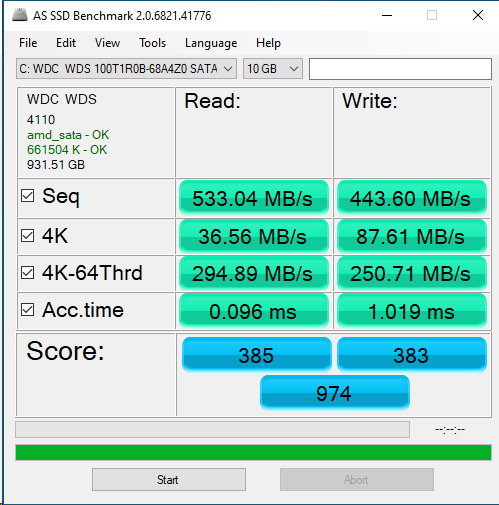
AS SSD Benchmark
AS SSD Benchmark is another good benchmark for testing SSDs. We run all three tests for our series. Like other utilities, it was run with both the default 1GB as well as a larger 10GB test set.

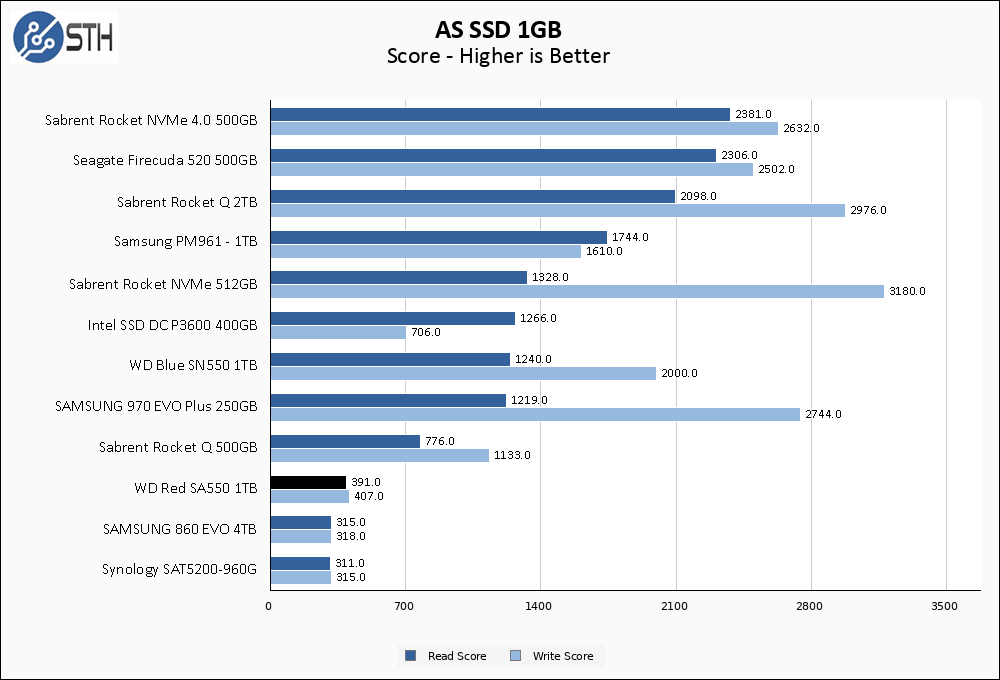
The SA500 1TB manages to register a solid win in ASSSD compared to the other SATA drives in our test set. Strong 4K-64Thread numbers help separate it from the Synology and Samsung drives.
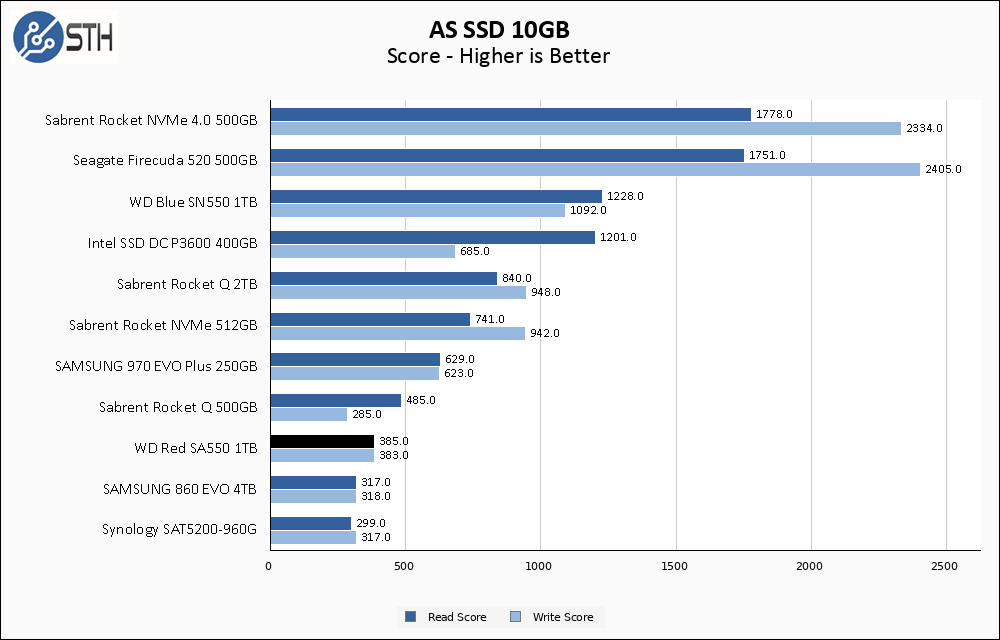
The WD Red drive manages to hold onto its lead over the other SATA drives when the larger test set is used. The performance for highly threaded workloads is impressive on this SATA drive.
SPECworkstation and our conclusion are up next.


Western Digital isn’t really helping their Red brand. First with sneaking SMR drives into NAS drives, now releasing a enterprise NAS branded SSD that lacks enterprise features. What is WD doing?
@Steven – I think they are reshuffling their brands. Red is now “prosumer” and red pro is is getting closer to enterprise, although gold is obviously the true enterprise in their weird colour based system.
This drive doesn’t seem compelling at all.
It’s hard to think of a use case where I would be excited to get this drive, even for $120.
Sata-only, so, it’s not fast, but, that does improve compatibility I suppose.
0.6 DWPD, so, not a ton of endurance, but not the worst I’ve seen I guess.
No PLP, which makes it not great for a number of use cases.
$120 for 1tb, so, I can get a used enterprise drive with PLP, high endurance, higher performance, around the same size, for around the same price.
Like an 800gb or 1.6tb Intel DC S3600, I’d much rather have one of those for 2.5″ form factor at least. Don’t know off the top of my head what m.2 drive I’d rather have, but, in m.2 form factor I’d really prefer nvme.
It seems computer storage technology has experienced a Christensen type of disruptive innovation. Companies such as Western Digital and Seagate were too busy making money with traditional hard disks (and shingled magnetic recording) to invest in the future. The too little too late mode of operation that happens in such situations then results in thoroughly underwhelming products which have no compelling advantage over similar things that were on the market years ago. I see no market leadership whatsoever in bringing a SATA m.2 drive to market at this point.
Slow SATA drives being so close in price to proper NVMe drives is really infuriating.
This sounds like Boeing renaming the 777X to the 777MAX.
I was happy to see the “you get what you pay for” quote for this SSD, as i basicly bougth the cheapest ssds of a trusted vendor.
I’m using 4 of these in my silent qnap nas (2x m.2, 2×2.5″) and they max out at 680Mbyte/s over 10GbE.
Thanks for the review.
This is a typo, yes? “Seagate WD Red SA500 Specs”
To demonstrate market leadership, I would recommend that WDC consider advocating a new “SATA-IV” standard that adds at least 2 more features:
(1) change the frame layout from 8b/10b “legacy frame” to 128b/130b “jumbo frame”
(PCIe/NVMe channels already do this);
(2) sync the clock rate to the chipset, using auto detection as needed
(NVMe already uses 8G (Gen3) and 16G (Gen4)).
Modern SATA SSDs e.g. Samsung, WDC etc. already “down-clock” to accommodate
slower SATA ports e.g. 3G (SATA-II) and even 1.5G (SATA-I).
SATA-IV should default to 16G, to sync it with PCIe 4.0 chipsets
and be backward-compatible with 8G, 6G, 3G and 1.5G clock rates.
16G / 8.125 = 1,969.2 MB/second per SATA-IV channel
6G / 10 = 600 MB/second per SATA-III channel
By definition, “SATA” uses a single Serial channel (the “S” in “SATA”);
NVMe by design uses x2 or x4 PCIe lanes.
Freezing SATA at 6G and the 8b/10b legacy frame is only retarding
the normal evolution of this one technology.
p.s. for readers who are not familiar with frame layouts:
“legacy frame” is one start bit + 8 data bits + one stop bit
for a total of 10 binary digits per byte
(6G / 10 = 600 MB/sec MAX HEADROOM = theoretical maximum bandwidth)
“jumbo frame” is one start bit + 16 bytes @ 8 bits per byte + one stop bit
for a total of 130 binary digits per 16 bytes = 130 / 16 = 8.125 bits per byte
(8G / 8.125) = 984.6 MB/sec MAX HEADROOM)
Hope this helps.
Comments are closed.