
Phison has been making SSD controllers for several years. While their newest controller dubbed the S10 has been in consumer drives for some time, the company is also making a push into the data center. We had the opportunity to test several Phison S10DC reference SSDs and came away impressed. The 960GB SSDs we tested utilized the S10 controller with capacitors for power loss protection. Phison is marketing the platform as low cost data center flash. Although industry buzz is around metrics like heavy 4K write workloads, there are many (or most) workloads that are heavily read focused. The bulk of flash storage deployed is focused on serving content and therefore the market for read-optimized SSDs is a highly competitive one.
About the Phison S10DC 960GB Reference Drives
The Phison S10DC reference design drives we have came originally as bare PCB. We were able to photograph the internals before placing them in their protective 7mm 2.5″ housings. These are not production SSDs but rather reference platforms. We do expect similar SSDs to launch from Phison’s partners in the near future.
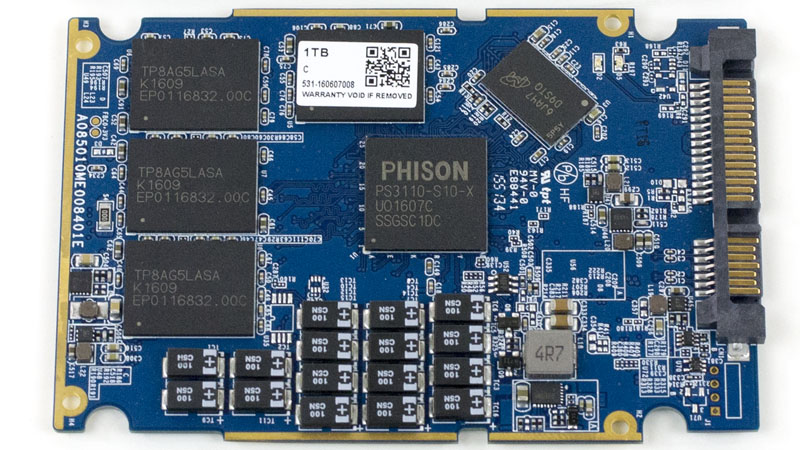
The Phison S10DC 1TB (960GB) reference platform comes in a standard 2.5″ PCB. We can see five main component areas on the top side of the drive: the PS3110-S10-X controller, Micron RAM, four NAND packages, power loss protection (PLP) capacitors and the SATA power/ data connector.
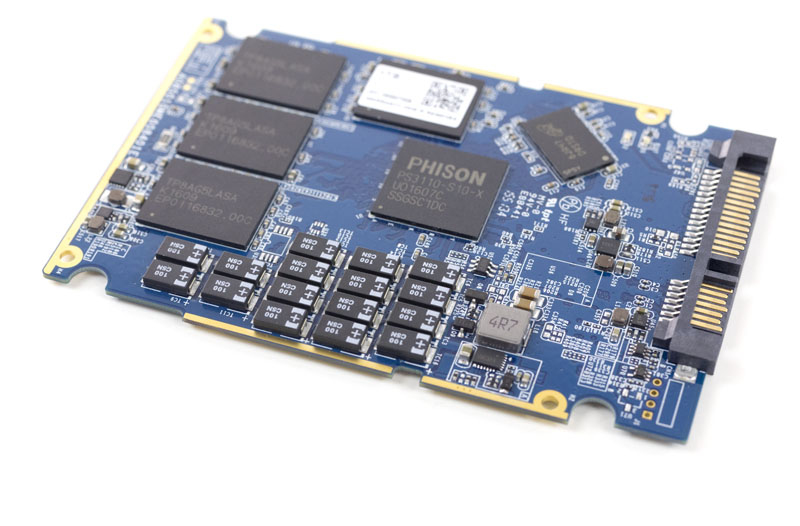
We snapped a photo of the bottom of the PCB exposed in the 7mm thick 2.5″ drive housing for some perspective. Here we can see four additional NAND packages and an additional RAM package.

Since the Phison S10DC platform can cache write data in RAM, the data center variants of the drives can have power loss protection. This feature will ensure the drive can write data cached in RAM to persistent NAND memory in the event of an unplanned power outage.
Power loss protection is provided by a bank of capacitors below the PS3110-S10-X controller. This has become a standard industry approach to ensure data is not lost in the event of an unexpected power outage.
Phison S10DC 960GB Drive Specs
We are going to simply provide the basic specs for the Phison S10DC 960GB SSD. Although we have seen the Phison S10 controller paired with a wide variety of NAND types in the past, the reference platform uses Toshiba 15nm MLC NAND.

One feature we did want to draw attention to is the write endurance. The platform is rated at 0.44DWPD. We see competitive offerings in the read-optimized data center SSD space target 0.3 DPWD as a target endurance specification so the S10DC platform is approximately 50% higher. We recently published a used data center SSD piece purchasing over 400 used data center SSDs. Upon receipt, we looked at the power on hours as well as the writes to each drive we could pull data for and found a not surprising result:

The impact of our survey is simple and aligns with one of the best kept secrets in the industry: real-world write workloads are generally well below 0.3 DWPD. Often SSD purchasers assume they need high write endurance to have reliable NAND however most workloads are not highly write intensive. The Phison S10DC at 0.44DWPD write endurance actually outpaces many modern hard drives in terms of endurance.
Given the market segmentation, we are evaluating the Phison S10 960GB reference platform as read intensive SATA SSDs.
Test Configuration
We used one of our primary storage platforms for our testing. Using our lab, we have a variety of different target nodes which can be used for load generation nodes.
- Test Platform: Supermicro 2U Server
- CPUs: Dual Intel Xeon E5-2690 V3
- RAM: 512GB DDR4-2133 (SK.Hynix)
- SAS Controllers: 3x LSI SAS 3008 (one per 8 drives)
- SSDs: Phison S10DC 960GB SSDs featuring Toshiba 15nm MLC NAND
- OS SSD: Supermicro SATA DOM 64GB
- Network Controllers: 2x Intel XL710-QDA2
- Switch: QCT QuantaMesh T3048-LY9


We are upgrading the STH lab over the next few weeks to add more 40GbE ports but we were able to complete our testing using nodes on a single switch to minimize latency. The LSI cards we use are the most widely adopted in the industry and are well supported in both operating systems but also software defined storage solutions.
Single Drive Tests
We did want to provide some comparison data in terms of the Phison S10DC drives with Toshiba 15nm MLC NAND against other 800GB-960GB capacity SSDs. For these tests we used basic benchmarking tools that are readily available. We run these tests directly after our IOMeter test runs. These tests should give a general performance overview. As with our larger array testing, we utilize LSI SAS 3008 controllers. That means that these results are comparable to other tests completed on SAS 3008 platforms. There will be some performance variations comparing these results to Intel or SoC (e.g. Cavium ThunderX) onboard SATA controllers.
AS SSD Benchmark
AS SSD is a solid benchmark that does not write compressible data to drives. The result is perhaps one of the best workstation SSD benchmarks available today.

As one can quickly see, the Phison S10DC 960GB offering is near the top of the pack in terms of performance. The QD1 4K write performance is more comparable to a SanDisk CloudSpeed Eco 960GB SSD or an Intel S3500 800GB SSD. Once higher queue depths are reached, or sequential workloads are added, the performance is in-line with some of the faster SSDs we have tested.
CrystalDiskMark
CrystalDiskMark is another benchmark which gives non-compressible read/write numbers. This is in contrast to the ATTO Benchmark used by LSI/ Sandforce and its partners when they market a given solid state drive.

Here we see a very similar picture to the AS SSD results. The Phison S10DC drives perform relatively well in our tests. While in client workloads QD1 4K numbers are very important, in servers we tend to see higher queue depth I/O and also mixed I/O (larger than 4K I/O.)
ATTO Benchmark
The value of the ATTO benchmark is really to show the best-case scenario. ATTO is known to write highly compressible data to drives, which inflates speeds of controllers that compress data like LSI/ SandForce does prior to writing on a given solid state drive.

Sequential read performance is solid, at lower transfer sizes we see the S10DC below some of its competition but for the majority of the curve the S10DC is near the top.

Write performance of the drives in ATTO is generally in the middle of the pack. We see solid performance through the curve. For general purpose workloads, these drives will compete on price.
24 Drive Benchmarks
For our larger arrays, we utilize Iometer and a number of workloads:
- Database – This workload is used to represent a sample database workload. This is a standard 8KB random workload with two thirds read focused.
- Web Server – This workload is meant to represent a sample web server workloads. This is a read heavy workload with a number of different file sizes.
- File Server – With a distribution between 512B an 64KB and 80/20 read/ write ratio, this is a file server workload focused on smaller file sizes.
- 128KB Sequential Read – This workload tests sequential read speeds.
- 128KB Sequential Write – This workload test sequential write speeds.
- 4K Random Read – This workload tests random 4K file size reads.
- 4k Random Write – This workload tests random 4K file size writes.
- 70/30 Read/ Write Mixed – This workload focuses on a mixed 70/30 read/ write workload at 4K file sizes.
These are industry standard workloads. In aggregate, they give significant information regarding drive performance, however they are largely synthetic workloads.
IOPS Results
IOPS are a key metric for storage workloads. With SSDs, higher queue depths often equate to higher performance as the controller can better manage requests to NAND. We did pull out the 128KB sequential results from the IOPS by QD since those are governed more by raw throughput.
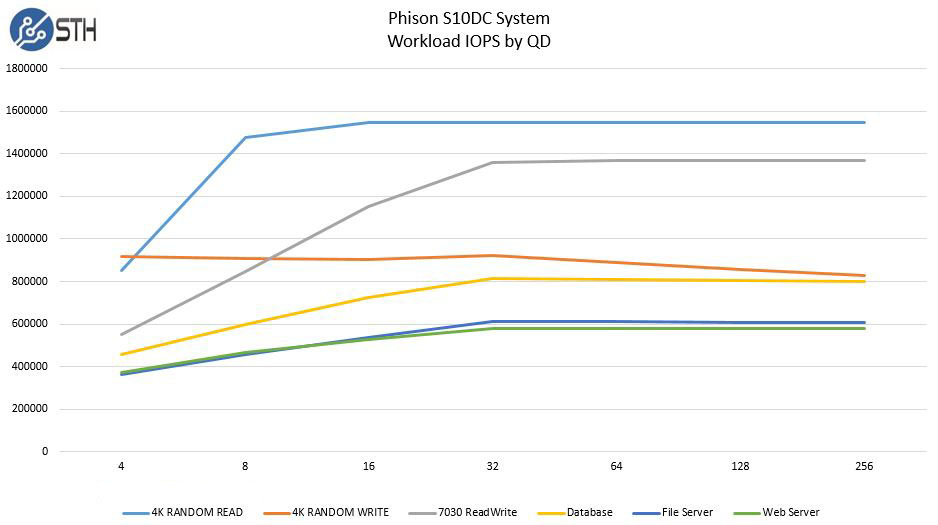
Our maximum IOPS in the test system was just shy of 1.6 Million in our 4K Random Read Test. These drives are focused on read performance so we see this as a solid indicator of their primary use case. The 70/30 read/ write workload approached almost 1.4M IOPS in our test system at QD32 which is excellent as well.
Throughput Results
In terms of raw throughput we charted our workloads by queue depth.
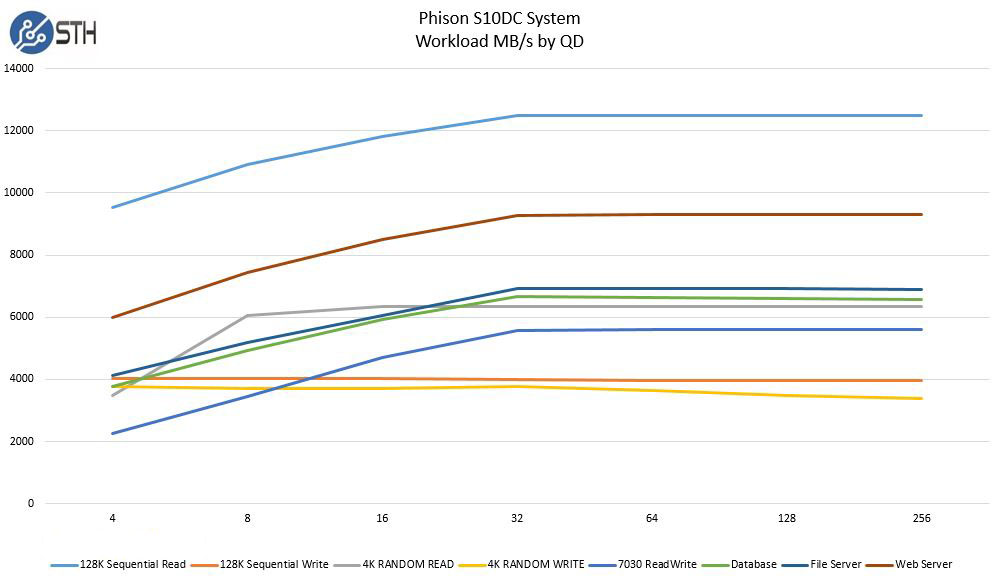
In terms of raw throughput, we saw over 12GB/s from our sequential read tests and over 9GB/s in our web server workload. Write figures both in terms of 128K sequential and 4K random were around 4GB/s in the system. As we would expect the majority of workloads to be read optimized with these drives, the key focus areas to be the read tests. Our pre-conditioning scripts push writes to long-term levels. It is unlikely one would put such a workload onto these drives as they belong on higher write endurance drives.
Response Time Results
Response times are important in many applications. We wanted to chart our results as a distribution at QD4. Manufacturers often quote QD1 workloads, however, in severs slightly higher queue depths are more common.
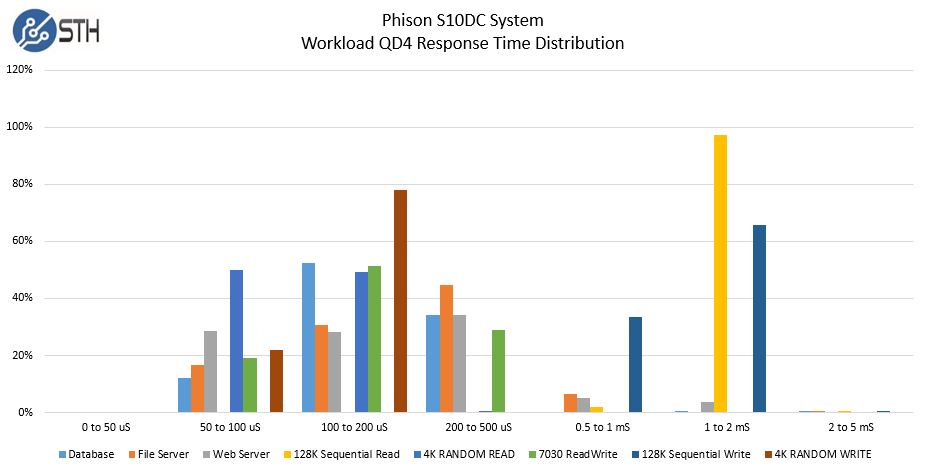
We charted results as a percent of total. As one can see, aside from the large sequential transfers, the majority of I/O occurs below 1ms. The drives had no I/O completed above 5ms which is excellent in terms of consistency.
Preview: 24 Drive Ceph Cluster Performance
We created a very small scale Ceph cluster within our environment using KVM virtualization. We created a dozen VMs each with two SSD OSDs. This type of virtualized distributed cluster we have seen multiple times working with users of our DemoEval platform. As a result, we are exploring adding similar tests to our data sets. We use Ceph as a storage back-end for hosting at STH, so the performance is important to us. This benchmark is a work-in-progress as we are scaling it in our 24x NVMe drive systems as well.
Our test pool has a replication factor of 2. We are also using the standard rados benchmark and performing 5 minute runs.
Ceph Write Benchmark
Bandwidth (MB/sec): 3573.895

Stddev Bandwidth: 2338.538

Max bandwidth (MB/sec): 3932

Min bandwidth (MB/sec): 0

Average Latency: 0.110878

Stddev Latency: 0.270413

Max latency: 2.19796

Min latency: 0.0223284
Ceph Sequential Read Benchmark
Bandwidth (MB/sec): 3723.455

Average Latency: 0.122045

Max latency: 1.23819

Min latency: 0.00343404
Ceph Random Read Benchmark
Bandwidth (MB/sec): 3868.844

Average Latency: 0.095591

Max latency: 1.04682

Min latency: 0.00355225
This performance was excellent for SATA SSDs. We certainly have (a lot) of tuning to do in our Ceph benchmarking methodology however we did want to provide an update as we are making significant progress on this front. We are already seeing latency in-line with our production Ceph cluster.
Conclusion
When purchasing storage for STH, we do focus on reliability and performance. We publish our SSD reliability figures from the hundreds of data center SSDs we use in production. Our Ceph cluster is built as a “fail in place” architecture. We actually had a node fail (we were testing how low we could get power consumption using fewer fans) and did not service the failed node for six months. At the same time, heading to the production data centers is not something we like to do on a regular basis. We were impressed by the value and performance of the S10DC and also were able to get several drive-years on the devices through our testing. After testing the Phison S10DC based drives, we are now using them in our ZFS and Ceph clusters hosting our production workloads:
root@fmt-hcn-18:~# ceph tell osd.127 version { "version": "ceph version 0.94.5 (9764da52395923e0b32908d83a9f7304401fee43)" }
We plan to report back on their real-world performance the next time we publish data on our production SSD pool.
For those looking at lower-cost read optimized data center SSDs, the Phison S10DC controller mated to Toshiba 15nm MLC NAND is a solid choice. The drives we benchmarked are not production units so we are awaiting partners to come out with drives based on the reference design. With the SATA bus providing low cost and low power commodity storage the market is heating up in terms of available offerings. The SATA market is quickly shifting to providing storage for OS/ hypervisor root disks and scale out storage where the Phison S10DC excels.
Want to try a Phison S10DC array?
The number one question we get at STH is: benchmarks are great but what about my specific workload? The test system we used for benchmarking will be at Flash Memory Summit. We will also have a 24 drive configuration in the DemoEval lab for you to setup and run your own workloads on this platform.
![]()


NVMe SSDs are starting at 3x this kind of performance. I feel that SATA is a race to the rock bottom price.
Comments are closed.