Solidigm D5-P5430 15.36TB Basic Performance
For this, we are going to run through a number of workloads just to see how the SSD performs in applications you can easily test against anything you may have around. Hopefully, this helps folks get a quick sense of the general performance of the drive.
CrystalDiskMark 8.0.4 x64
CrystalDiskMark is used as a basic starting point for benchmarks as it is something commonly run by end-users as a sanity check. Here is the smaller 1GB test size:
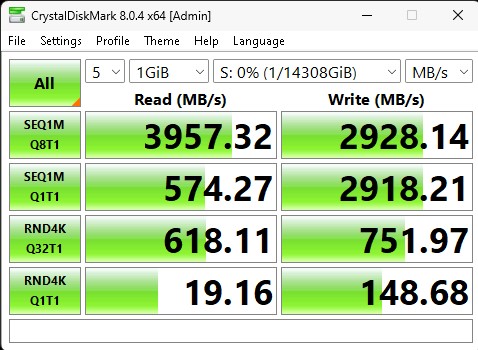
While the 1GB is not great, we see a big change on the 8GB results:
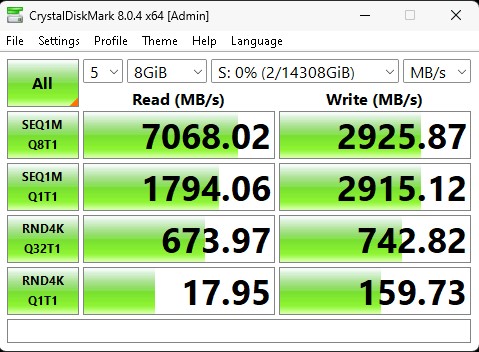
If we think about the usage model of a large SSD, most likely this will be used as a hard drive replacement. Given that, we would expect media like video files to be stored on a drive like this and then streamed or read over time. With the longer test, the SSD shines.
ATTO Disk Benchmark
The ATTO Disk Benchmark has been a staple of drive sequential performance testing for years. ATTO was tested at both 256MB and 8GB file sizes.
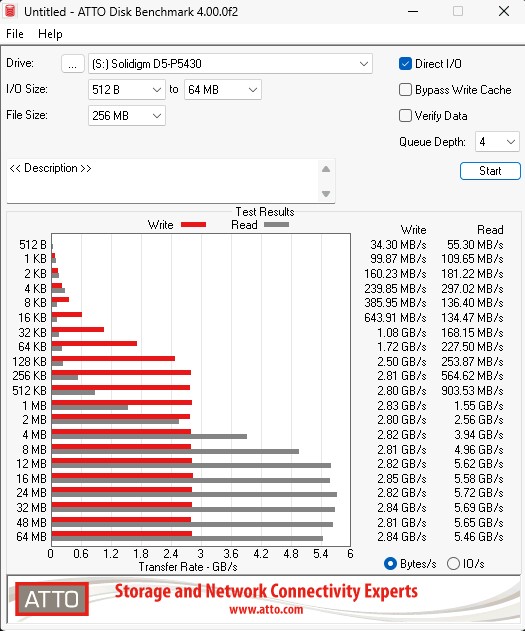
Here is the larger 8GB test:
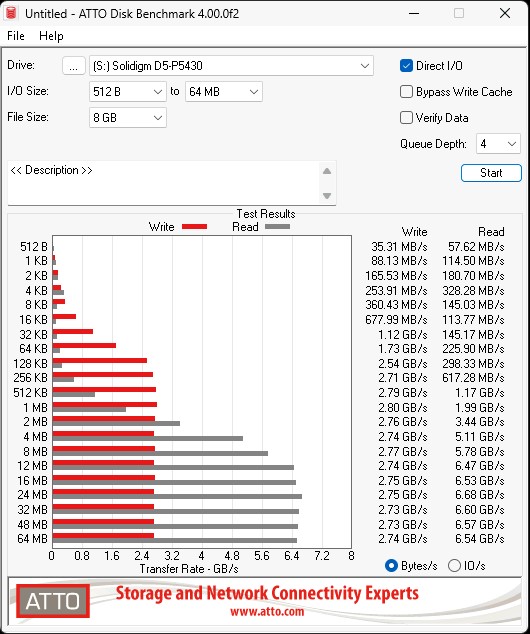
Again, there is a fairly large gap between the slower write speeds and faster read speeds. This is more of a read-optimized drive. The larger test size helped. The other big point to note is that 4KB was specifically much better than 2KB, 8KB, 16KB, 32KB, and so forth on the read size. Often we see drives ramp up much like the read side is here. Instead, the D5-P5430 does something different.
AS SSD Benchmark
AS SSD Benchmark is another good benchmark for testing SSDs. We run all three tests for our series. Like other utilities, it was run with both the default 1GB as well as a larger 10GB test set.
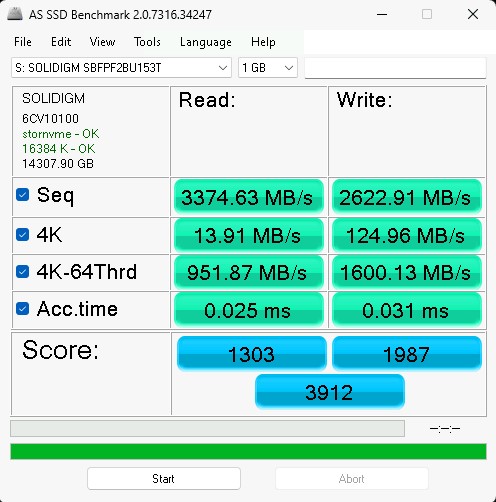
Here is the 10TB:

Again we see numbers go up for the larger test size. That should be expected at this point.
Next, let us get to some more interesting numbers.
Solidigm D5-P5430 15.36TB Performance
Our first test was to see sequential transfer rates and 4K random IOPS performance for the Solidigm D5-P5430. Please excuse the smaller-than-normal comparison set. In the next section, you will see why we have a reduced set. The main reason is that we swapped to a multi-architectural test lab. We actually tested these in 20 different processor architectures spanning PCIe Gen4 and Gen5. Still, we wanted to take a look at the performance of the drives.
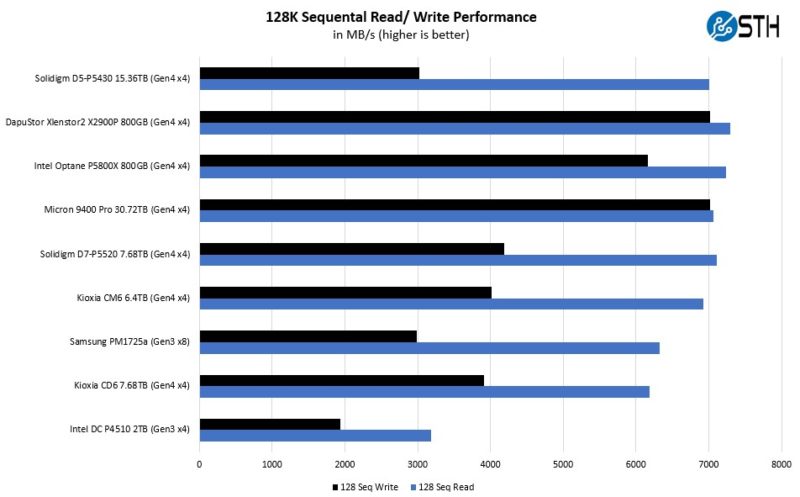
The D5-P5430 does decently well on the sequential read side, but it is not the quickest on the write side. That shows as well on the 4K IOPS side:
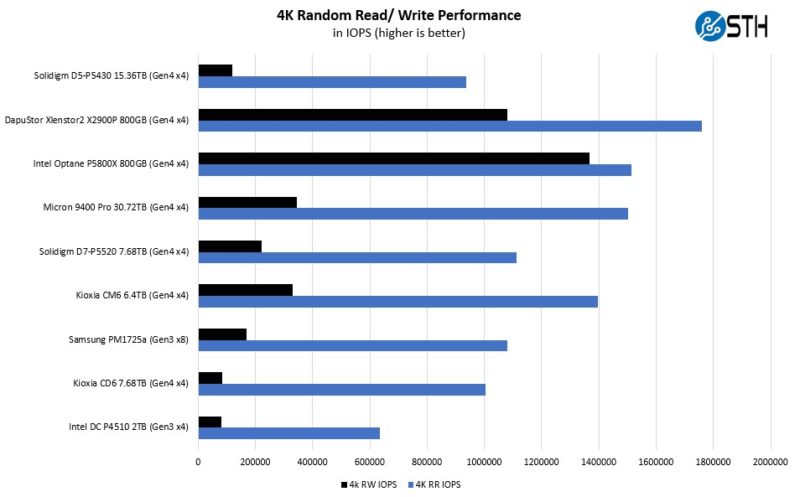
Using a large SSD designed for a lower cost per TB and hoping for great 4K Random IOPS performance is asking a lot. Here, as expected, write IOPS are slow but read IOPS are competitive. Again, for streaming media where we have large storage capacity requirements and large sequential read access patterns, this is great.
Solidigm D5-P5430 15.36TB Application Performance Comparison
For our application testing performance, we are still using AMD EPYC. We have all of these working on x86 but we do not have all working on Arm and POWER9 yet so this is still an x86 workload.
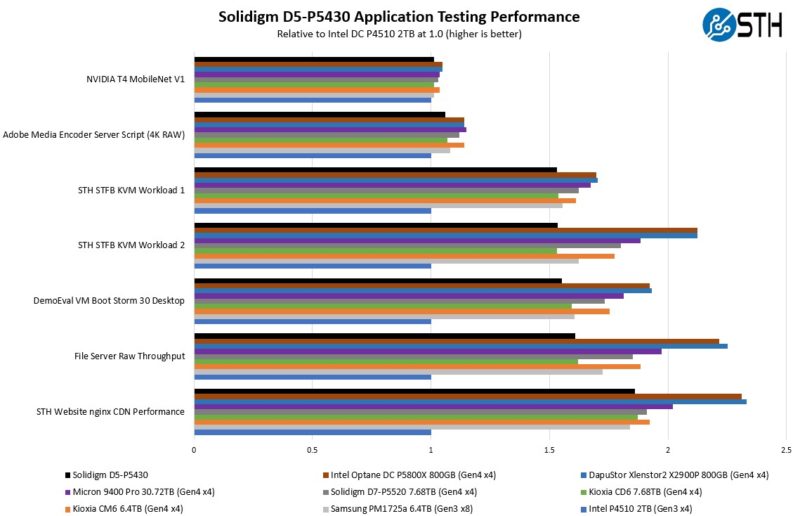
As you can see, there are a lot of variabilities here in terms of how much impact the Solidigm SSD has on application performance. Let us go through and discuss the performance drivers.
On the NVIDIA T4 MobileNet V1 script, we see very little performance impact on the AI workload, but we see some. The key here is that the performance of the NVIDIA T4 mostly limits us, and storage is not the bottleneck. We have a NVIDIA L4 that we are going to use with an updated model in the future. Here we can see a benefit to the newer drives in terms of performance, but it is not huge. That is part of the overall story. Most reviews of storage products are focused mostly on lines, and it may be exciting to see sequential throughput double in PCIe Gen3 to PCIe Gen4, but in many real workloads, the stress of a system is not solely in the storage.
Likewise, our Adobe Media Encoder script is timing copy to the drive, then the transcoding of the video file, followed by the transfer off of the drive. Here, we have a bigger impact because we have some larger sequential reads/ writes involved, the primary performance driver is the encoding speed. The key takeaway from these tests is that if you are mostly compute-limited but still need to go to storage for some parts of a workflow, the SSD can make a difference in the end-to-end workflow.
On the KVM virtualization testing, we see heavier reliance upon storage. The first KVM virtualization Workload 1 is more CPU limited than Workload 2 or the VM Boot Storm workload, so we see strong performance, albeit not as much as the other two. These are KVM virtualization-based workloads where our client is testing how many VMs it can have online at a given time while completing work under the target SLA. Each VM is a self-contained worker. We know, based on our performance profiling, that Workload 2, due to the databases being used, actually scales better with fast storage and Optane PMem. At the same time, if the dataset is larger, PMem does not have the capacity to scale, and it is being discontinued as a technology. This profiling is also why we use Workload 1 in our CPU reviews. On Workload 2, and the VM Boot Storm, peformance can be impacted more by the SSD performance. In either case, we see perhaps more mid-range performance.
Moving to the file server and nginx CDN, we see slower Solidigm access. Perhaps this makes sense if we think of a SSD on PCIe Gen4 as having a lower-latency link as well. The Solidigm falls behind while the DapuStor pulls ahead on the file server due to its faster sequential speeds. On the nginx CDN test, we are using an old snapshot and access patterns from the STH website, with caching disabled, to show what the performance looks like in that case. Here is a quick look at the distribution:
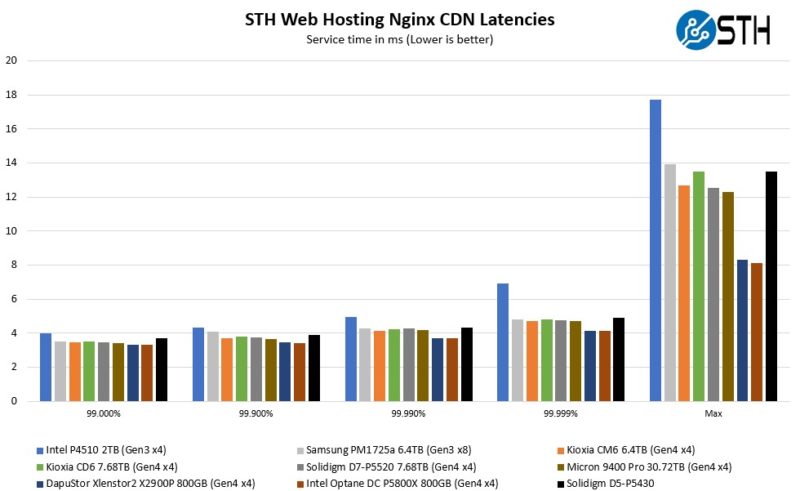
Latency is better than previous PCIe Gen3 offerings, but it is also not quite to where the newer and faster drives are. If you have small files you are serving in a more random access pattern, then there are others better suited to that use case.
Now, for the big project: we tested these drives using every PCIe Gen4 architecture and all the new PCIe Gen5 architectures we could find, and not just x86, nor even just servers that are available in the US.


Why?
Bring back MLC!!! I still use Intel drives I bought ages ago.
“Solidigm is on a major push right now to phase out a new wave of hard drives from the data center.”
This sentence reads very awkwardly. Are they trying to phase out hard drives in the datacenter by replacing them with SSDs? Are they trying to phase in a new wave of hard drives? If so, why is the article about SSDs, not hard drives?
Comments are closed.