Solidigm D5-P5336 61.44TB Basic Performance
For this, we are going to run through a number of workloads just to see how the SSD performs. We also like to provide some easy desktop tool screenshots so you can see the results compared to other drives quickly and easily.
CrystalDiskMark 8.0.4 x64
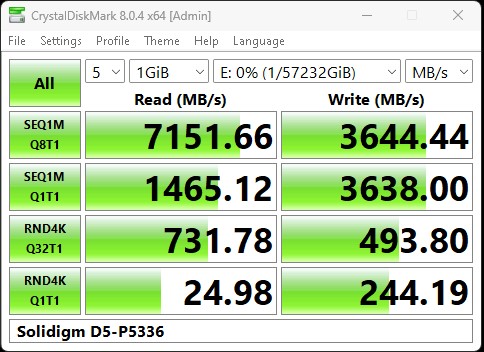
CrystalDiskMark is used as a basic starting point for benchmarks as it is something commonly run by end-users as a sanity check. Here is the smaller 1GB test size:
Here is the larger 8GB test size:
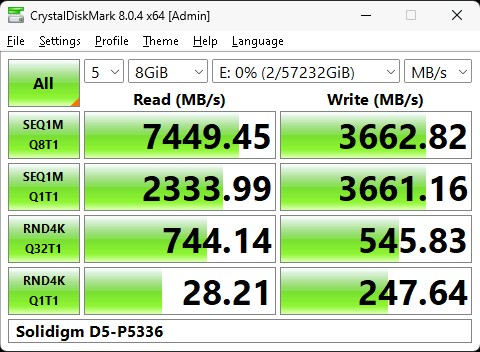
At only around 7.4GB/s for reads and 3.6GB/s for sequential writes, this is far from even the fastest PCIe Gen4 drive, let alone the PCIe Gen5 SSDs we have been seeing. The 4K random numbers are not high-end by any means.
ATTO Disk Benchmark
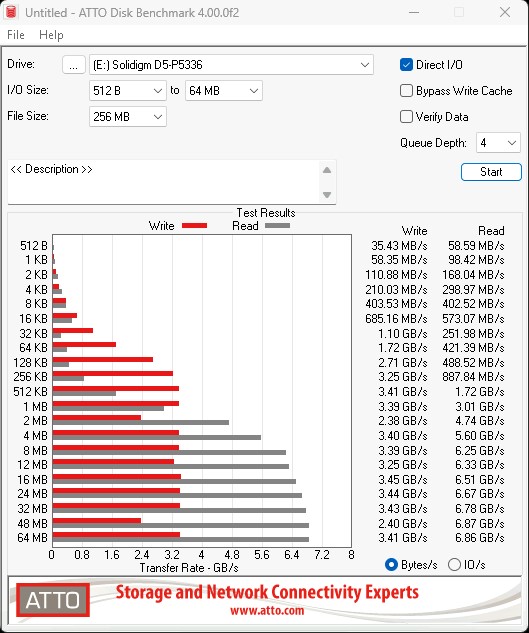
The ATTO Disk Benchmark has been a staple of drive sequential performance testing for years. ATTO was tested at both 256MB and 8GB file sizes.
Here is the larger 8GB file size, which seems very small for a 30.72TB SSD.
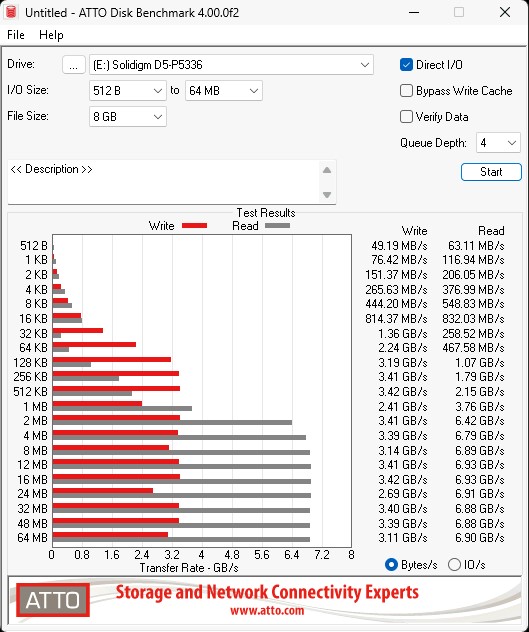
ATTO seems to show a similar pattern for sequential performance. This is the kind of performance that often matters when serving video files, which are also relatively larger files.
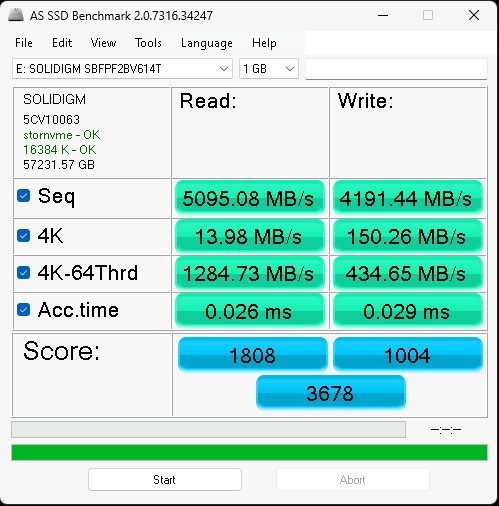
AS SSD Benchmark
AS SSD Benchmark is another good benchmark for testing SSDs. We run all three tests for our series. Like other utilities, it was run with both the default 1GB as well as a larger 10GB test set.
Here is the 10GB result:
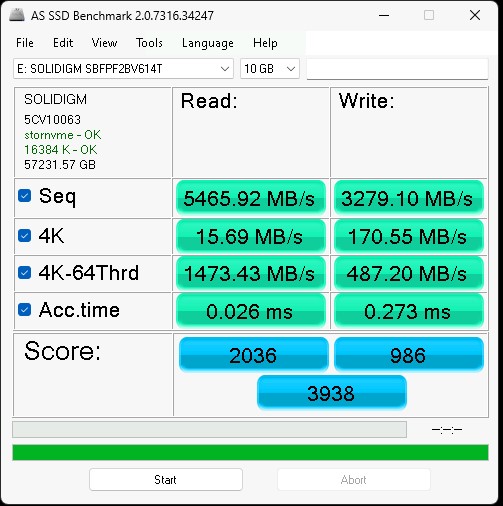
Again, this is more of an OK result, rather than showing great performance.
Next, let us get to some higher-level performance figures.
Solidigm D5-P5336 61.44TB SSD Performance
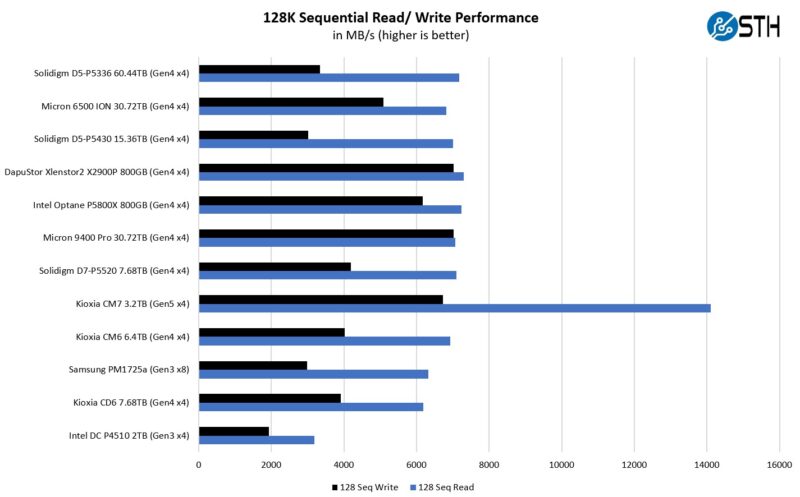
Our first test was to see sequential transfer rates and 4K random IOPS performance for the SSD. Please excuse the smaller-than-normal comparison set. In the next section, you will see why we have a reduced set. The main reason is that we swapped to a multi-architectural test lab. We actually tested these in 20 different processor architectures spanning PCIe Gen4 and Gen5. Still, we wanted to take a look at the performance of the drives.
Here is the 4K random IOPS chart:
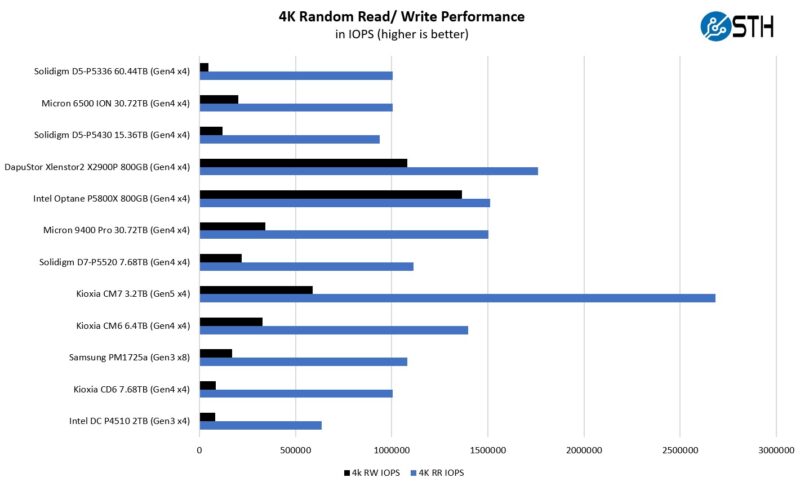
Here, the Kioxia CM7 does well as a PCIe Gen5 drive. The Solidigm D5-P5336 is notably slower than many of the higher-end drives we see today. In an industry so focused on outright performance, again, the SSD is focused on capacity storage. Our sense is that the real competitors are hard drives, rather than SSDs.
Solidigm D5-P5336 61.44TB SSD Application Performance Comparison
For our application testing performance, we are still using AMD EPYC. We have all of these working on x86 but we do not have all working on Arm and POWER9 yet so this is still an x86 workload.
As you can see, there are a lot of variabilities here in terms of how much impact the drive has on application performance. Let us go through and discuss the performance drivers.
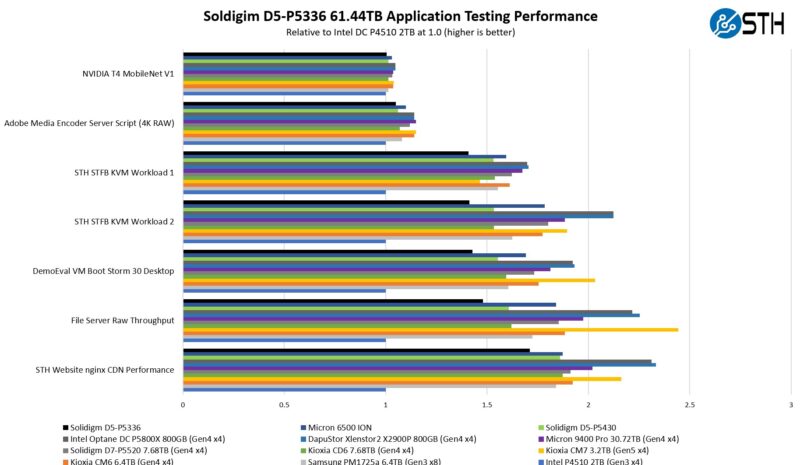
On the NVIDIA T4 MobileNet V1 script, we see very little performance impact on the AI workload, but we see some. The key here is that the performance of the NVIDIA T4 mostly limits us, and storage is not the bottleneck. We have a NVIDIA L4 that we are going to use with an updated model in the future, but we are keeping the T4 inference as a common point. Here we can see a benefit to the newer drives in terms of performance, but it is not huge. That is part of the overall story. Most reviews of storage products are focused mostly on lines, and it may be exciting to see sequential throughput double in PCIe Gen3 to PCIe Gen4, but in many real workloads, the stress of a system is not solely in the storage.
Likewise, our Adobe Media Encoder script is timing copy to the drive, then the transcoding of the video file, followed by the transfer off of the drive. Here, we have a bigger impact because we have some larger sequential reads/ writes involved, the primary performance driver is the encoding speed. Here, while we are generally compute limited, the sequential speeds of the giant Solidigm SSD are fine to largely keep the system fed. There are many video editors out there who crave more capacity.
On the KVM virtualization testing, we see heavier reliance upon storage. The first KVM virtualization Workload 1 is more CPU-limited than Workload 2 or the VM Boot Storm workload, so we see strong performance, albeit not as much as the other two. These are KVM virtualization-based workloads where our client is testing how many VMs it can have online at a given time while completing work under the target SLA. Each VM is a self-contained worker. We know, based on our performance profiling, that Workload 2, due to the databases being used, actually scales better with fast SLC storage and Optane PMem. At the same time, if the dataset is larger, PMem does not have the capacity to scale, and it is being discontinued as a technology. This profiling is also why we use Workload 1 in our CPU reviews. This is certainly not the best, but it is far from terrible performance.
Moving to the file server and nginx CDN, we see better QoS and throughput from the Solidigm D5-P5336, especially versus other SSDs. On the nginx CDN test, we are using an old snapshot and access patterns from the STH website, with caching disabled, to show what the performance looks like in that case. Here is a quick look at the distribution:
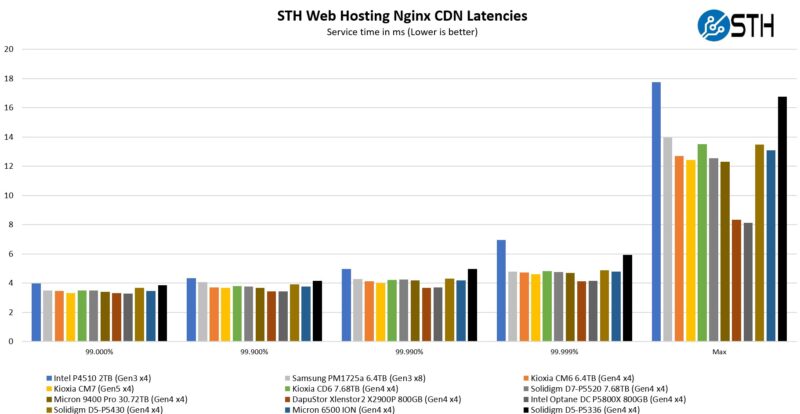
Here the throughput of serving images is more relevant, and so the Solidigm drive performance perhaps OK, but nowhere near the class leading drives. One does not expect a cruise ship to be as fast as a speed boat.
Now, for the big project: we tested these drives using every PCIe Gen4 architecture and all the new PCIe Gen5 architectures we could find, and not just x86, nor even just servers that are available in the US.


“Still, driving around with the setup we saw the first 10TB drive on the way up to Sedona, AZ in well under 500 miles of travel.”
You saw the first 10TB drive on the way? I would have thought you would see it when you installed it in the qnap before you left. Perhaps you mean you “…saw the first 10TB drive **fail** on the way…”
How can you review something across three pages without even mentioning even a ballpark figure for the price!?
Because it’s nearly $8000 and the terms of the review agreement probably stipulate they’re not allowed to share that.
I picked up one of these in December 2023 for $3700. Now that the cost of NAND has spiked they seem to be around $6400.
Ah, these are actually running PLC in pQLC mode.
Yikes.
I’m addition to price information for the SSD discussed here, I’d like to see some discussion of prices for the ASRock Rack 2U1G-B650 review last week. Why does a website devoted to server hardware have a dozen reviews of near identical 2.5 Gbit switches with prices and buy now links but no price-performance information for any of the server hardware?
Any reason for SOLIDIGM for not moving to U.3? I suppose this SSD is still U.2, which means it’s not supported by hardware RAID.
Whereas U.3 is supported by many new trimode hardware raid cards
These drives are meant for use cases where data availability/redundancy are handled somewhere else (CDNs, object storage, etc).
@Olimjon
U.2 is supported by hardware RAID. Its still PCIe.
9560-8i is specifically U.3 but supports U.2… why? Because U.2 PCIe backplane is still PCIe.
I spotted one of Patrick’s Easter Eggs: “outlets that can stay powered on while driving, so we though it might be interesting” – though instead of thought. (I never used to comment on these as I thought they were just typos, but once Patrick inserted some typos intentionally and then was surprised that hardly anyone noticed – so now I figure we are supposed to point them out just in case.)
Like @michaelp I was also wondering about why you would see the 10TB drive half way into the trip, wasn’t it there from the beginning?
“Lost”?
Interesting, who would lost when we compare the price lol
Why Threadreaper 7000WX, especialy thredreaper, is so slow compared to EmeraldRapids or Bergamo cpus with nvme on your charts.? Any ideas Patrick?
That spec sheet – Power Off Data retention.. 90 days at 104f(40c). So one hot summer on a shelf in texas/arizona and your data is gone ?
First, how do you review high capacity drives without discussing the IU/TU/whatever. Is this drive using 4k, 16k, or 64k as the smallest transfer unit? The IOPS numbers are somewhat misleading if you’re not showing off the drive’s strengths.
Secondly, when are you going to use enterprise benchmarking practices instead of consumer ones? There’s no way I’d go to you for industry analysis if you can’t even properly test a basic enterprise storage device. Seriously, CrystalDiskMark has no place in a review for enterprise storage.
Finally, how much Tesla stock do you own and are the Cyber Truck mentions paid for?
Terry Wallace wrote “That spec sheet – Power Off Data retention.. 90 days at 104f(40c).”
Thanks for posting. I was wondering what the power off data retention times were like. Given how malware and human errors affect online backups, it seems the world needs a modern media that can be shipped around in trucks and stored off-site.
After all the 2.5 Gbit switches have been rounded up, I’d vote for a focus on offline backup media.
@John S
What tools are you using to benchmark business SSDs?
Actually curious.
FIO on Linux. Windows can use vdbench or iometer, but enterprise storage is mostly Linux.
For synthetic tests you want to test the standard 4 corners. Also look at large block writes concurrent with small block reads and focus on the QoS numbers (eg: 99.999% latency on reads). With the new very high-capacity drives I would test IOPS at increasing sizes of IOs to see how it scales as most applications that will use these will already be tuned to do larger IOs since they’re applications migrating from HDD.
FYI, the driver and block level differences between windows and Linux are pretty big. Only testing on Windows also prevents you from collecting enterprise-worthy data.
I would recommend testing applications too. RocksDB (YCSB) / Postgres or MS SQL (TPC-C & TPC-H via hammerDB) / Cassandra (YDSB) / MySQL (sysbench) / various Spec workloads.
@CW Was it a retail purchase, or under some corporate agreement or something like that?
“Since this drive is 61.44TB the 0.58 DWPD rating may not seem huge”
For perspective, 0.58 DWPD would mean the drive sat writing at over 400MB/s continously 24/7.
Comments are closed.