Silicon Power UD90 4TB Performance Testing
We test using both the default smaller test size as well as larger test sets on our benchmarks. This allows us to see the difference between lighter and heavier workloads.
CrystalDiskMark x64
CrystalDiskMark is used as a basic starting point for benchmarks as it is something commonly run by end-users as a sanity check.
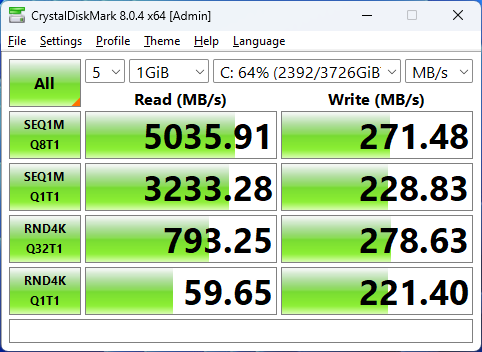
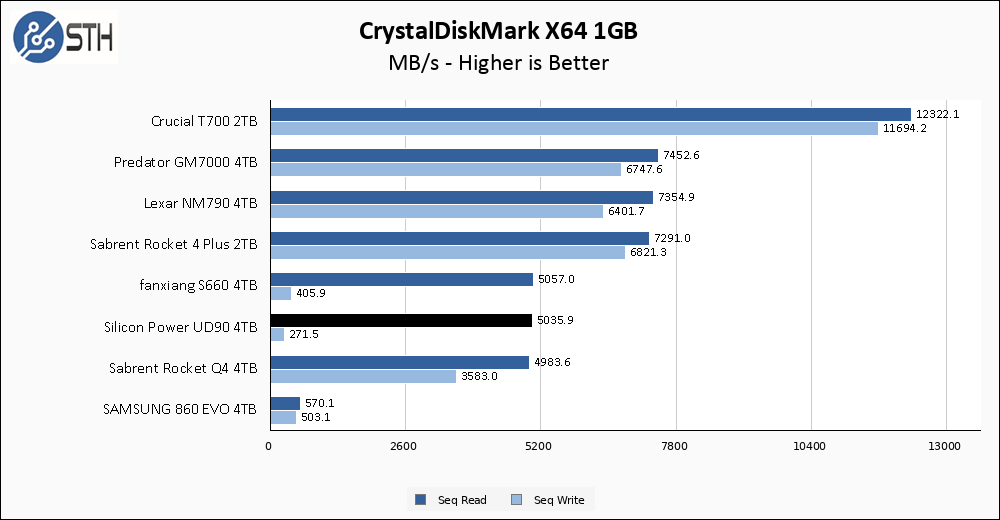
Please prepare yourself for a bunch of results that are extremely similar to the Fanxiang S660. These drives are essentially identical, and for all I know were produced in the same factory. As a result, the Silicon Power UD90 4TB starts off in CrystalDiskMark essentially exactly the same way the S660 did. It hits its sequential read speed target and then completely fails on write speed.
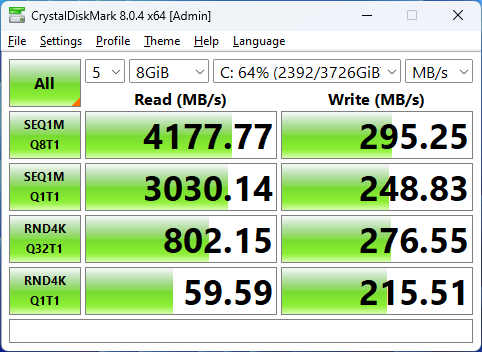
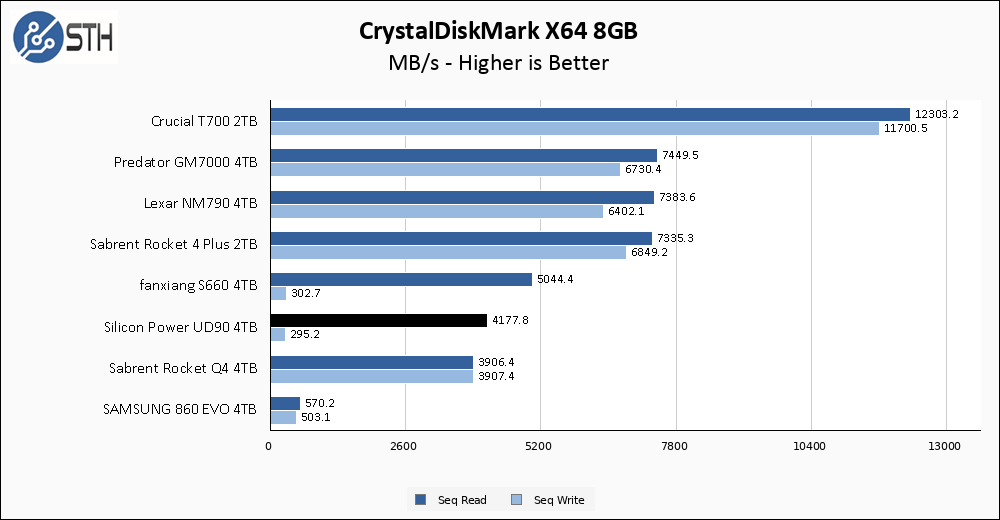
The larger CrystalDiskMark test shows the UD90 continuing in the same fashion as the smaller test. Read speeds are good, though a touch behind the S660, and write speeds are terrible. Though I did not test it this time, it is likely that this extremely poor write performance is due to my testing with the drive partially full (64% here) versus performance when the drive is empty. You can check my S660 review if you want to see for yourself, but the result is the same; fresh out of the box, the Silicon Power UD90 will perform exactly as it is rated. But as the percentage of the drive used goes up, you can expect the write speed to start faltering or, at best, being inconsistent.
ATTO Disk Benchmark
The ATTO Disk Benchmark has been a staple of drive sequential performance testing for years. ATTO was tested at both 256MB and 8GB file sizes.
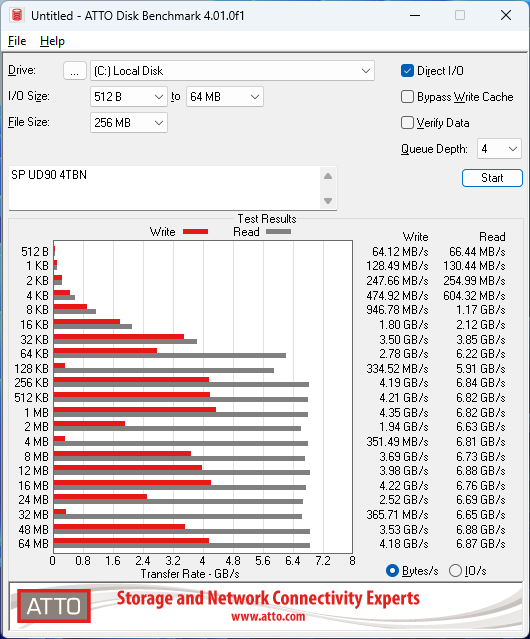
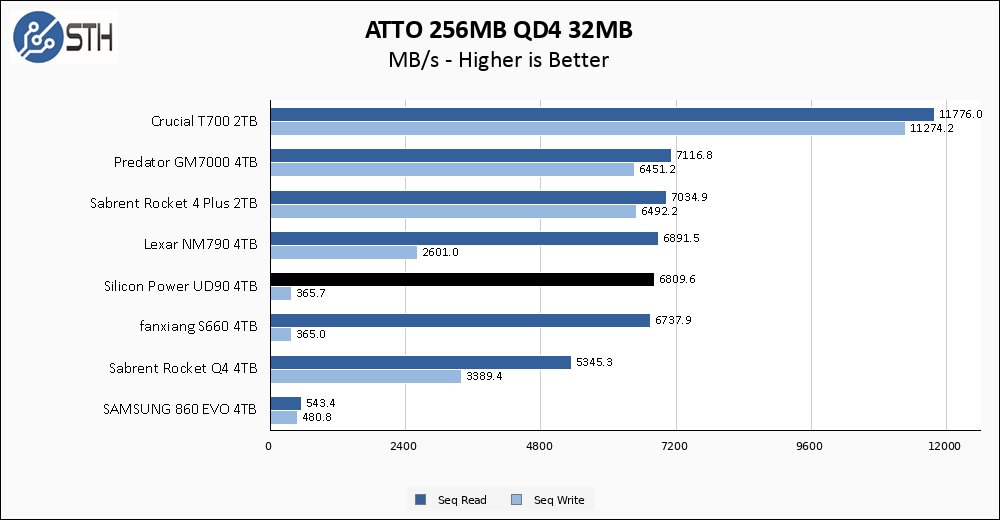
This benchmark is all over the place. First off you have terribly inconsistent write speeds, caused by the performance of the UD90 itself. Paired with that you have incomprehensibly fast read speeds, which is a result of an interaction between the Phison E21T controller and this specific benchmark. The takeaway here should be that performance is inconsistent, rather than any specific result.
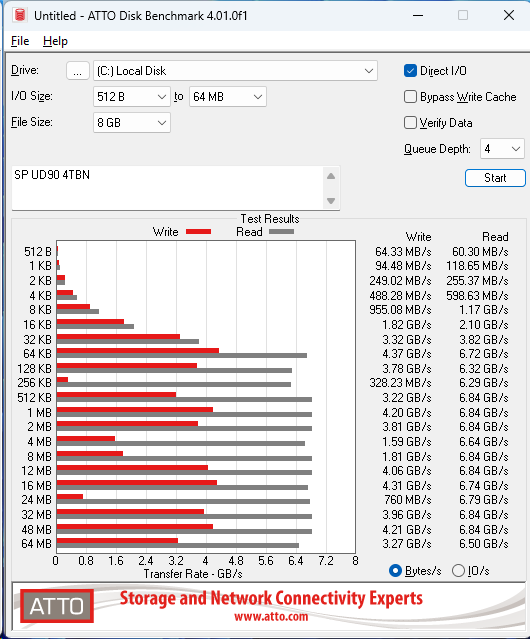
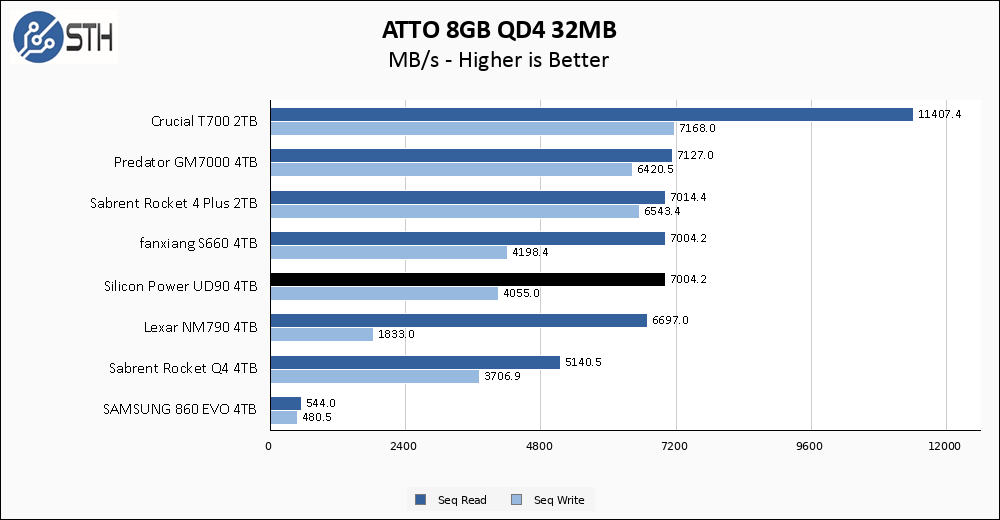
The UD90 is just as inconsistent on the larger test.
Anvil’s Storage Utilities
Anvil’s Storage Utilities is a comprehensive benchmark that gives us a very in-depth look at the performance of the drives tested. This benchmark was run with both a 1GB and 8GB test size.
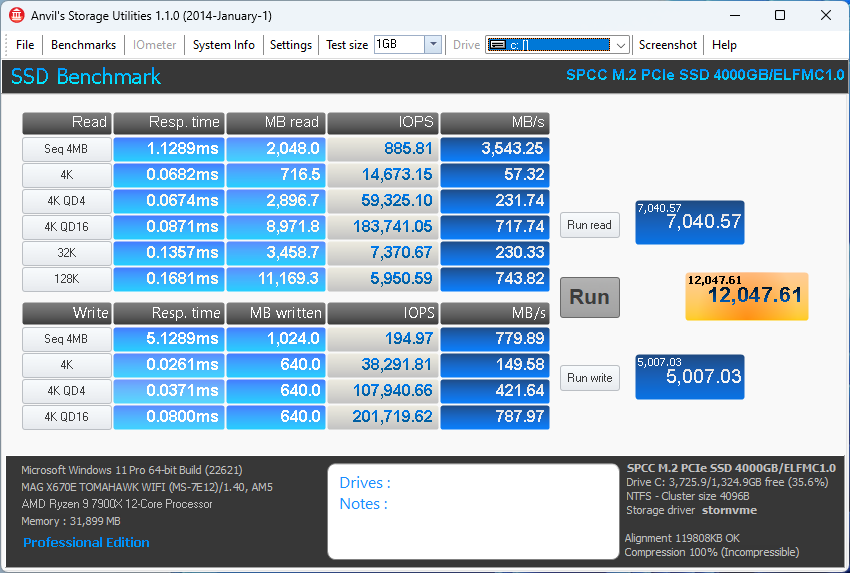
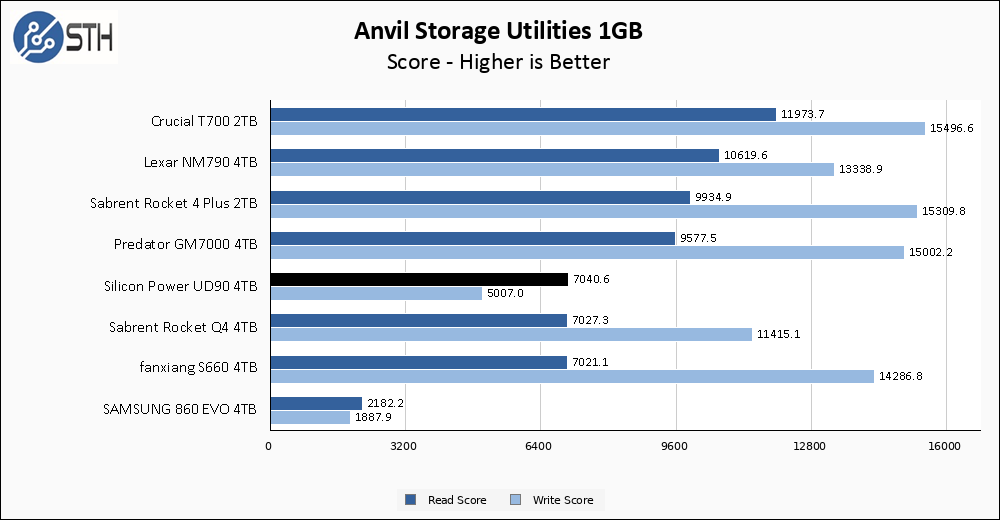
Performance in Anvil shows a wide write performance delta between the UD90 and the S660 for the first time. The read score is identical to my previously tested 4TB QLC SSDs, while the UD90 turns in a significantly lower write score than even the other QLC drives I have tested.
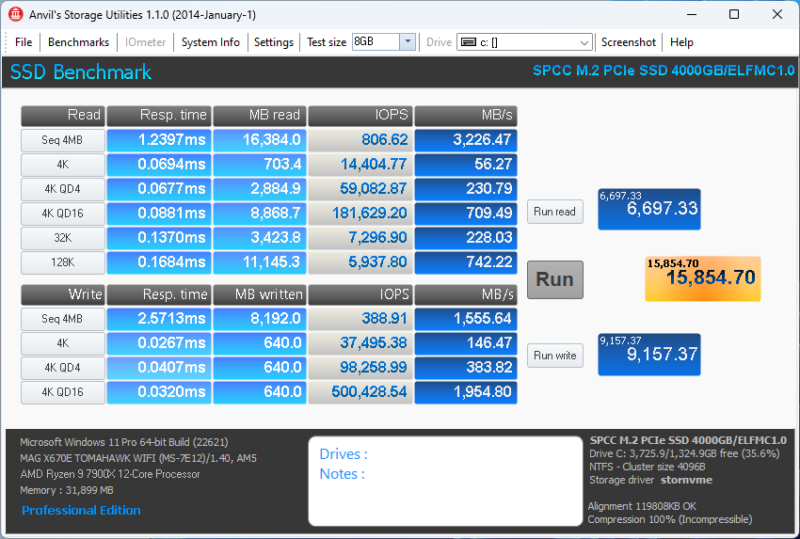
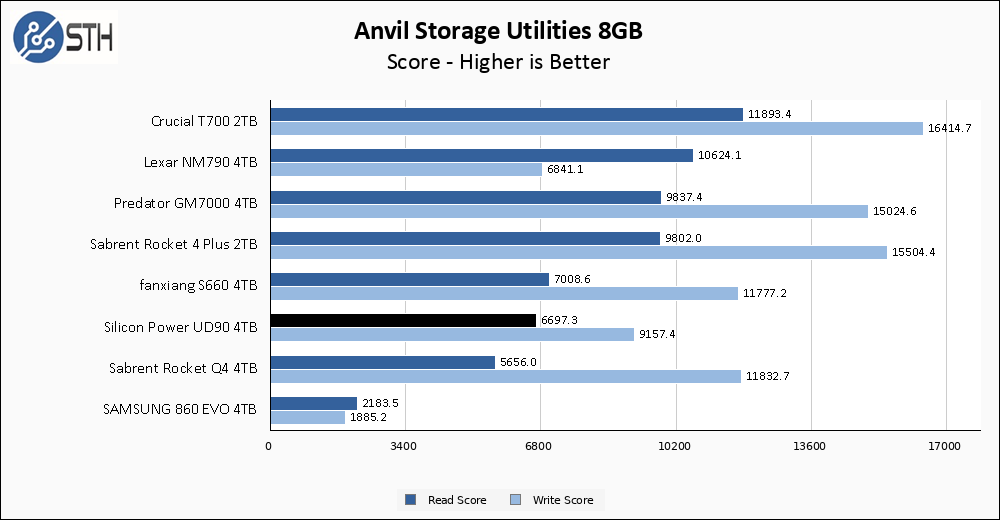
The larger Anvil test allows the UD90 to improve somewhat, closing the gap between itself and the S660. In general, though, the UD90 continues to trail by a measurable margin.
AS SSD Benchmark
AS SSD Benchmark is another good benchmark for testing SSDs. We ran all three tests for our series. Like other utilities, it was run with both the default 1GB as well as a larger 10GB test set.
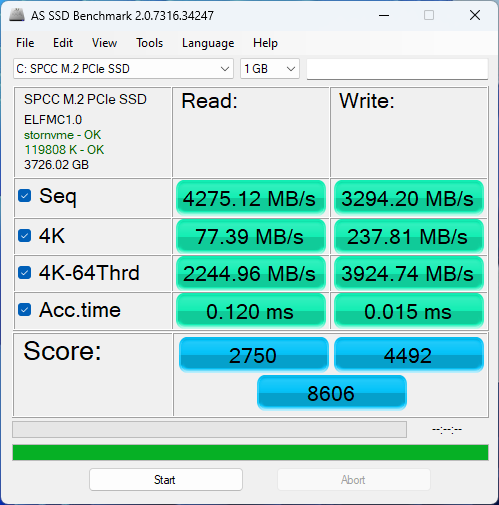
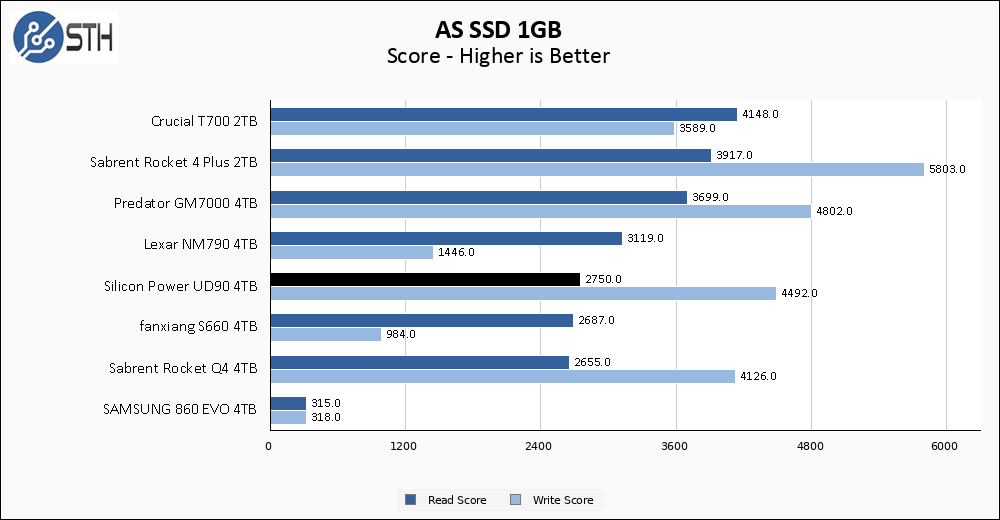
In a reversal of fortune from Anvil, AS SSD allows the UD90 its first win of any significance over the S660. I do not think that you should really take much away from that victory; what you are really witnessing here is the wide performance variability and inconsistency inherent in these drives. The UD90 just got a bit lucky, or the S660 unlucky, in this particular test.
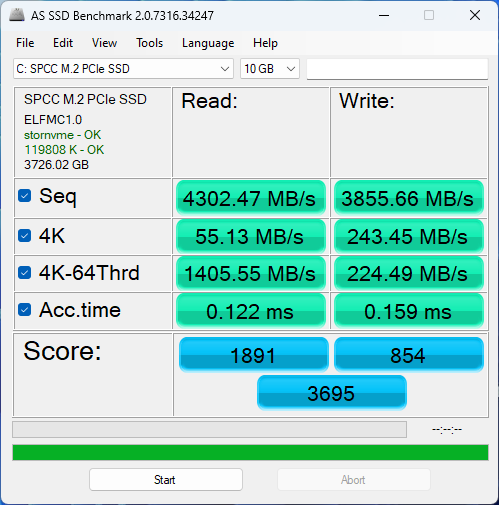
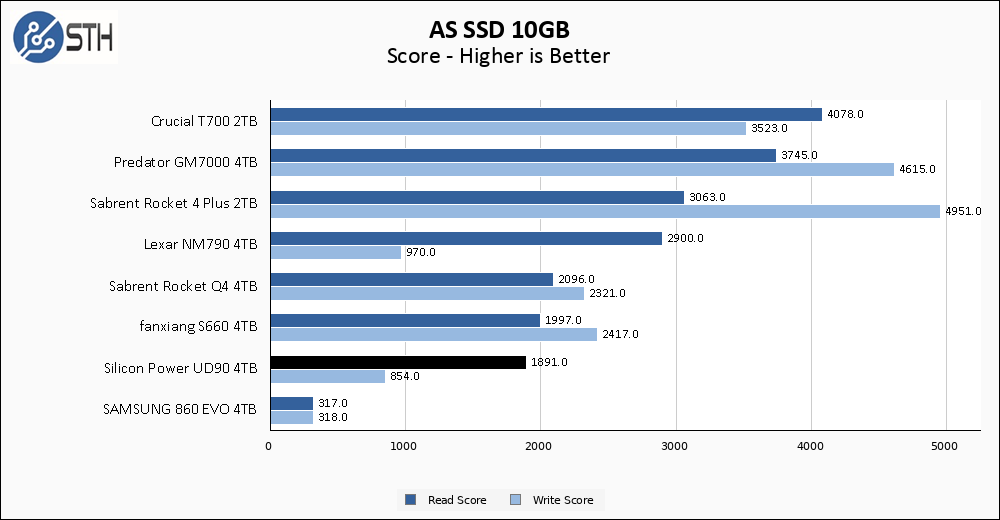
Case in point for the performance variability of the UD90 and S660, the larger AS SSD once again flips the script and the UD90 now loses by a significant margin to the S660. In reality, these drives are so inconsistent they are almost impossible to benchmark because the results are all over the place.
SPECworkstation, thermals, and our conclusion are up next.


Would you trust this with 4Tb of your data? I wouldn’t…
Once you get to 1TB of data on this drive, the write speeds go below 50MB! It’s a junk drive and won’t buy SP again.
Of course is QLC, beyond of useless for storage. Is really not worthed for boot drive, hdd is even better than this.
I have it on my ps5, works fine
I bought 4 SP SSDs and 3 have failed within 10 months. That is a 75% failure rate!
I wouldn’t trust them any farther than I could throw a grand piano.
That’s unfortunate. I have had the 2tb model in a ps5 for a few months and it’s been fine. Guess I’ll run it till it quits. Least if that fails it’s not very critical.
Comments are closed.