Fanxiang S770 2TB Performance Testing
We test using both the default smaller test size as well as larger test sets on our benchmarks. This allows us to see the difference between lighter and heavier workloads.
CrystalDiskMark x64
CrystalDiskMark is used as a basic starting point for benchmarks as it is something commonly run by end-users as a sanity check.
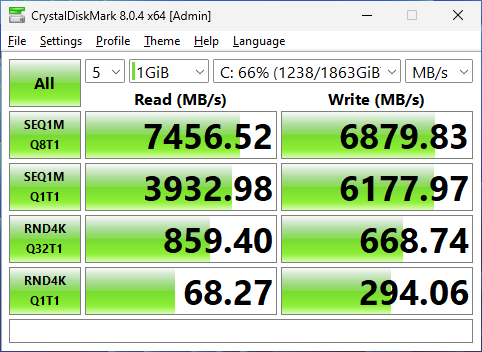
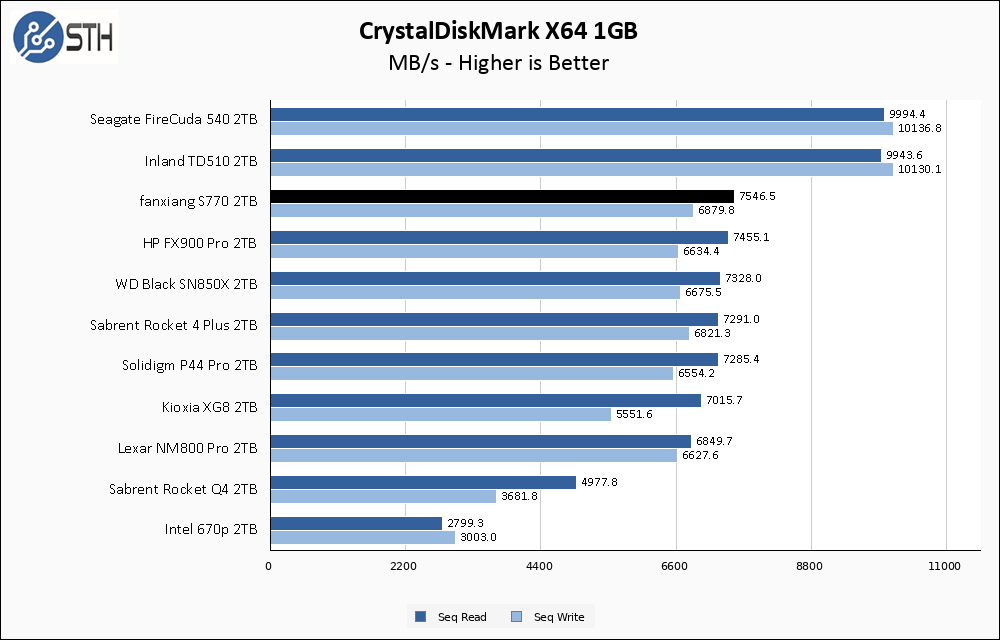
The Fanxiang S770 2TB hits the nail on the head as far as its sequential throughput by exceeding its rated 7300 MB/s read and 6800 MB/s write results. In fact, the S770 is in a functional tie for the top of my Gen4 results chart, with only the Gen5 drives getting the better of it.
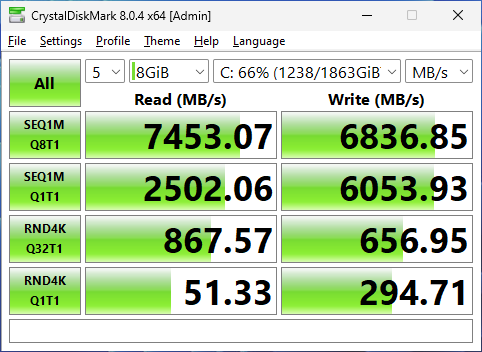
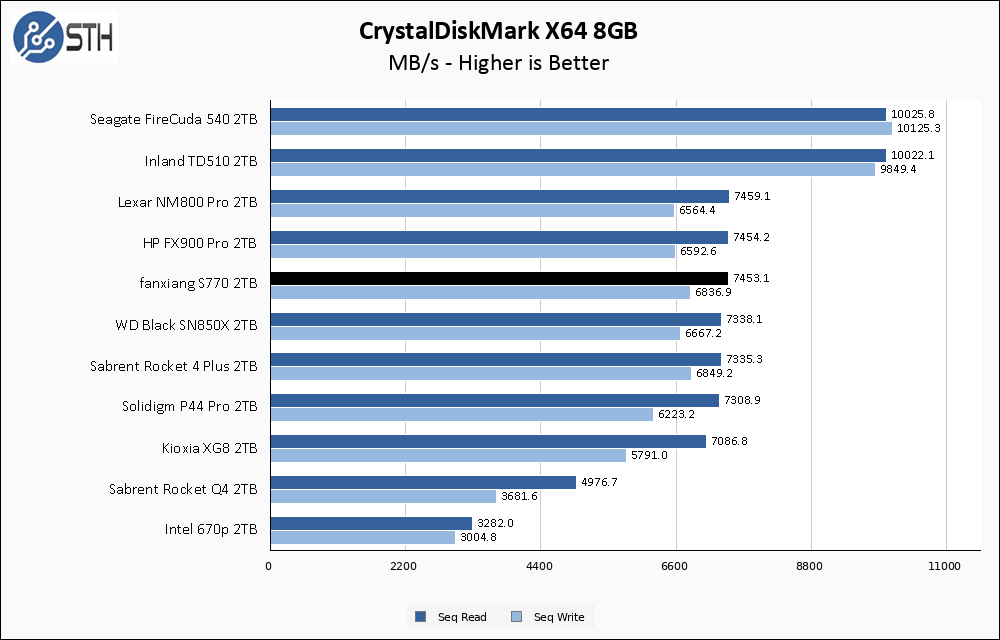
The larger CrystalDiskMark test continues to show the Fanxiang S770 in a multi-way tie for top-tier Gen4 performance.
ATTO Disk Benchmark
The ATTO Disk Benchmark has been a staple of drive sequential performance testing for years. ATTO was tested at both 256MB and 8GB file sizes.
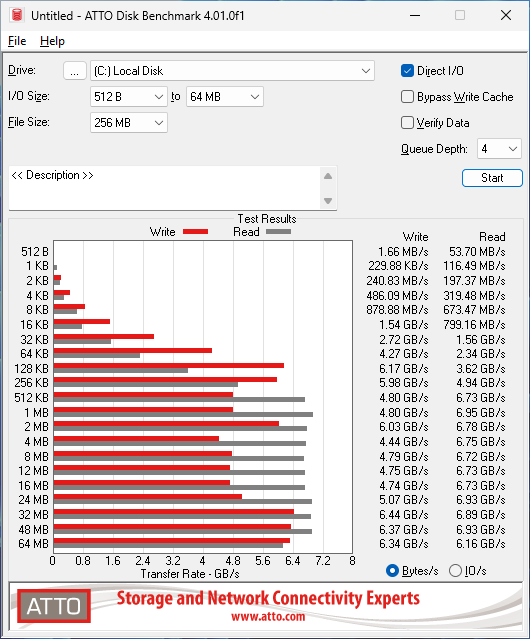
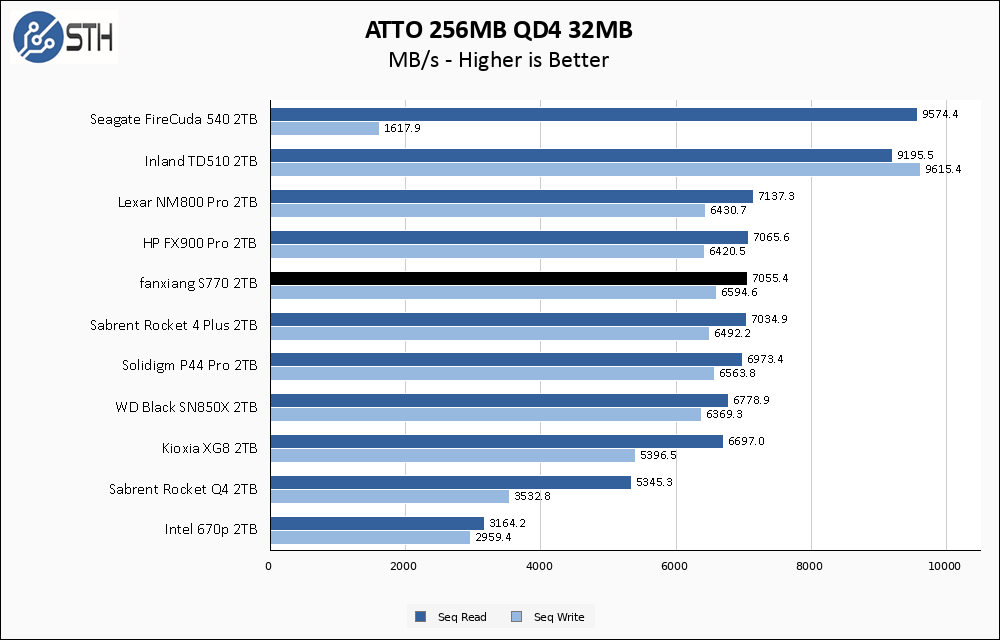
As I have mentioned before, the chart for ATTO results is taken from the 32 MB chunk size data point, and at that point, the S770 did well. With that said, looking at the whole chart the S770 had some variability to its write performance that not all drives show, so in my mind, it loses a point for this inconsistency. Still, at the 32 MB chunk, this drive is performing impressively and is once again battling it out for the top result among Gen4 drives.
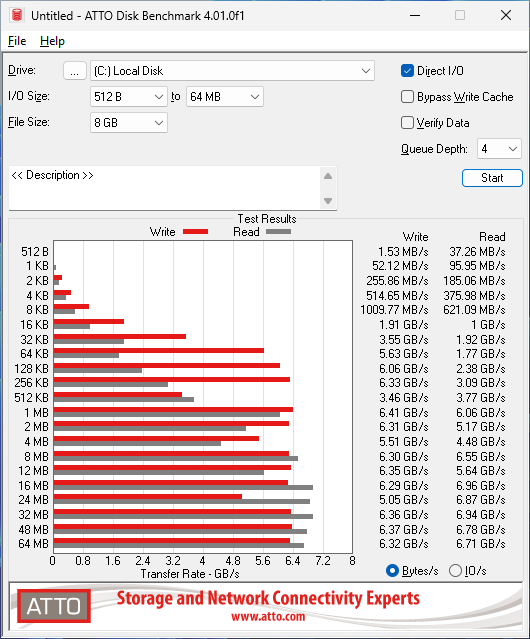
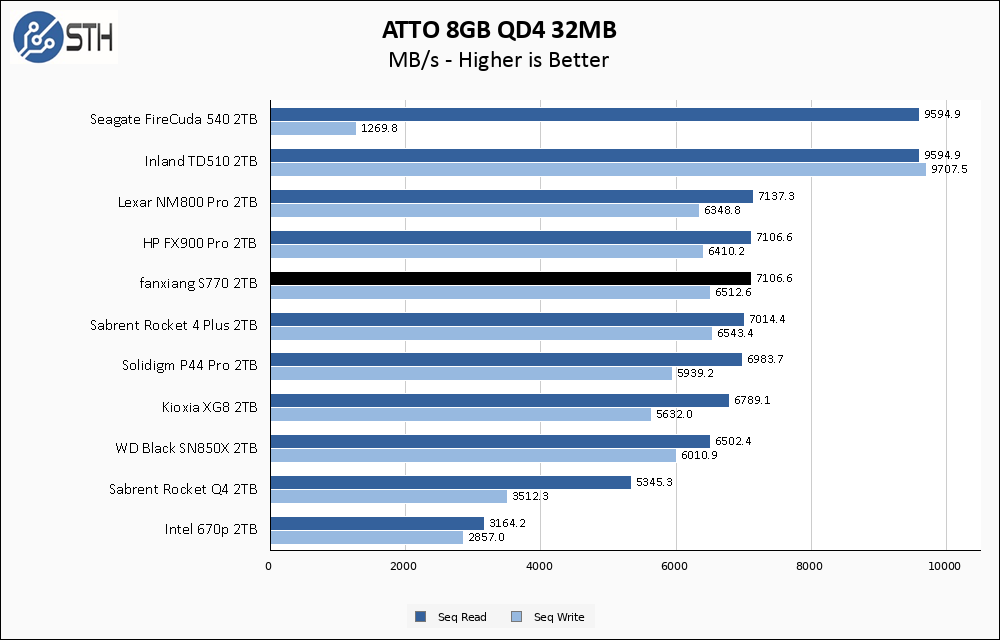
The larger ATTO test brings out more good performance at the 32 MB chunk size, while still showing some write performance inconsistency across the whole test.
Anvil’s Storage Utilities
Anvil’s Storage Utilities is a comprehensive benchmark that gives us a very in-depth look at the performance of the drives tested. This benchmark was run with both a 1GB and 8GB test size.
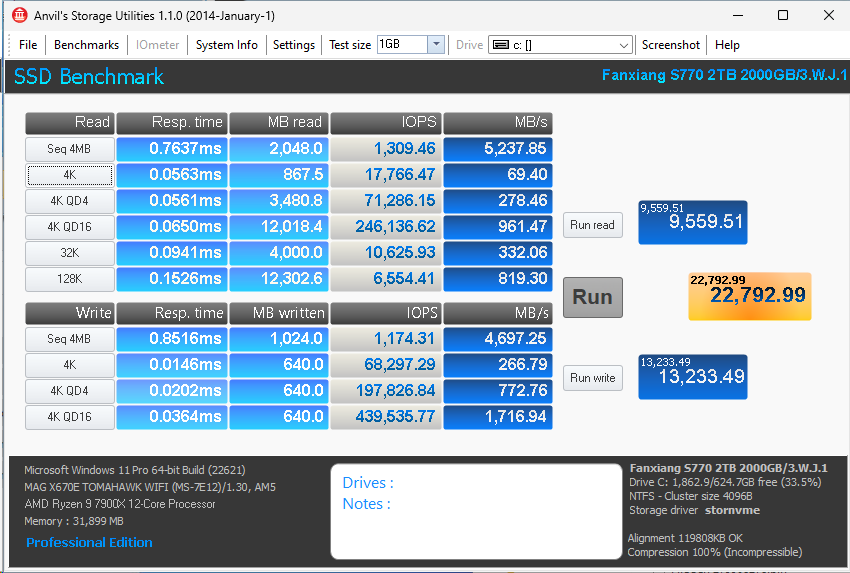
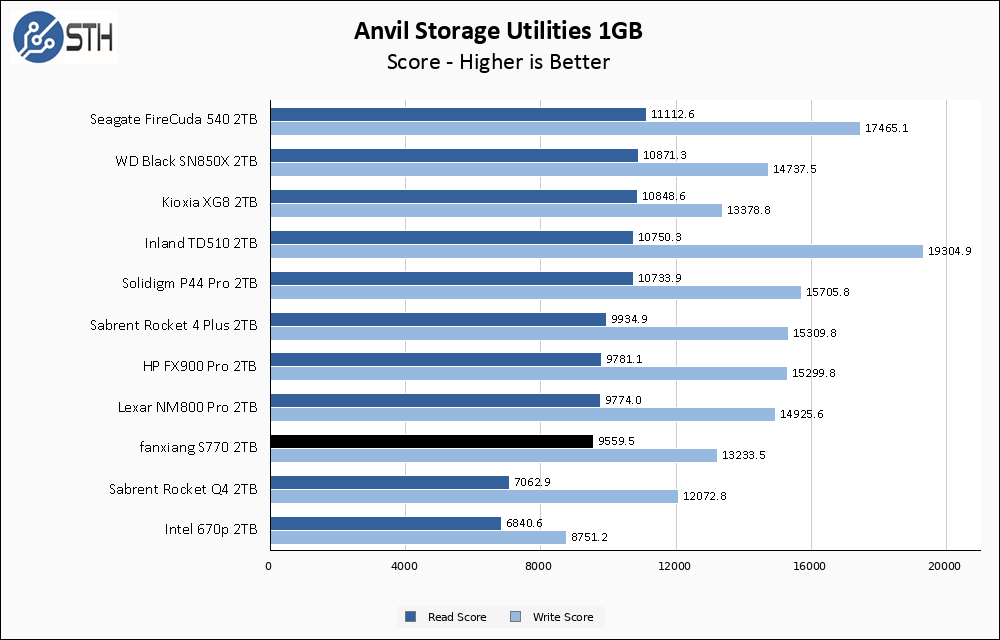
Performance in Anvil is not a particularly strong result for the fanxiang S770. Scores for both read and write come in near the bottom of the chart. With that said, most of the drives on this chart are very good company to keep, and the S770 is not dramatically behind the rest of the pack. I look at these results and mostly think they are acceptable.
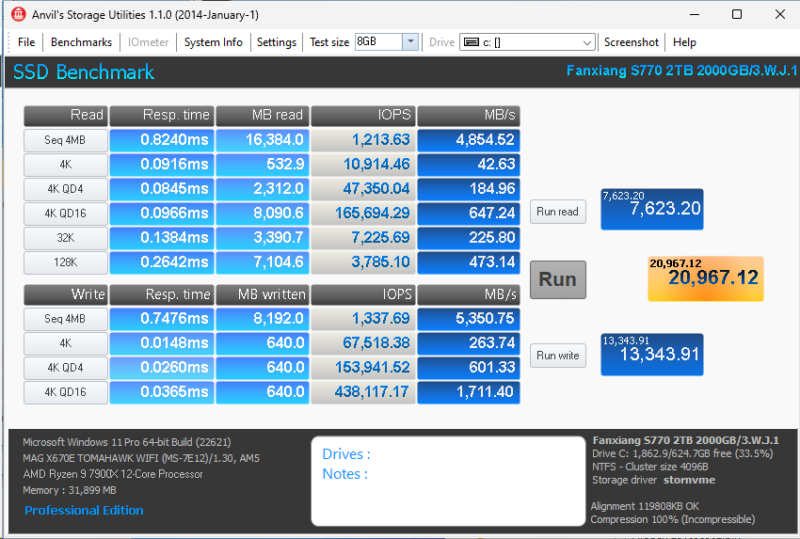
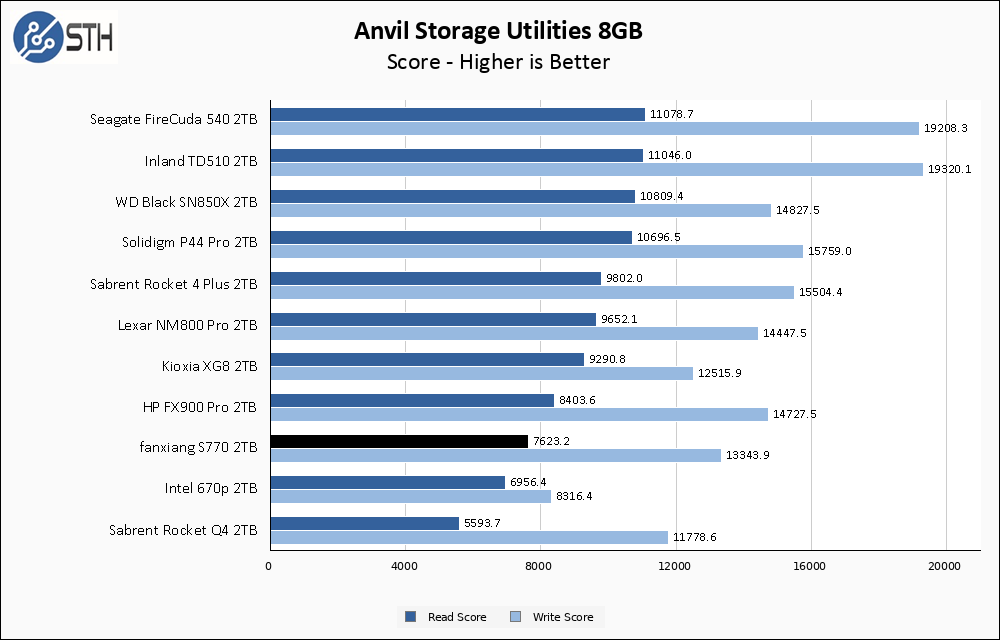
The larger Anvil test has the Fanxiang S770 maintain its position near the bottom of the chart, but again not by a particularly wide margin. Things are still looking good for the S770 in my opinion.
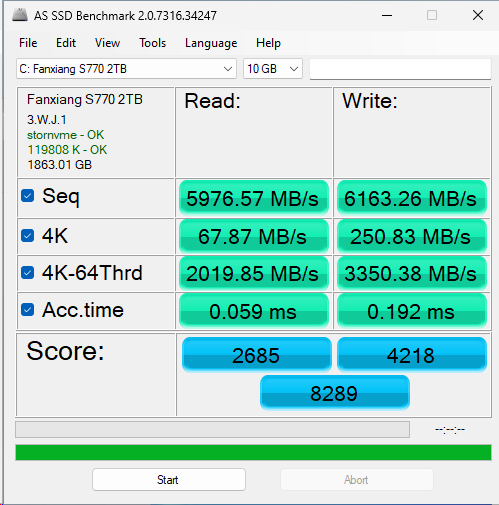
AS SSD Benchmark
AS SSD Benchmark is another good benchmark for testing SSDs. We run all three tests for our series. Like other utilities, it was run with both the default 1GB as well as a larger 10GB test set.

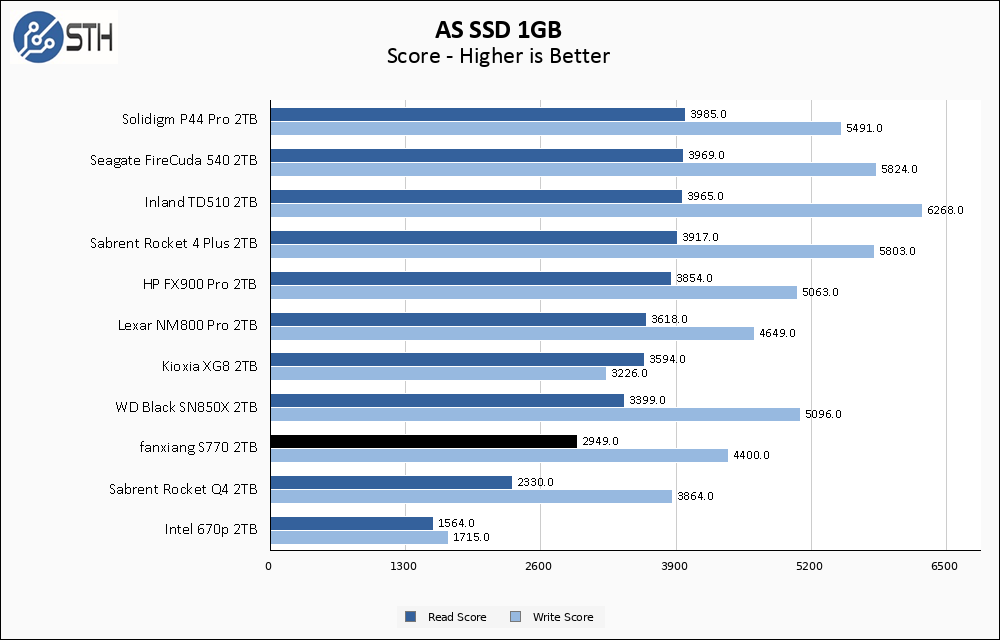
AS SSD results are more similar to Anvil, with the S770 bringing in the rear of the chart. As with Anvil, the results here are still within acceptable bounds for a modern Gen4 drive.
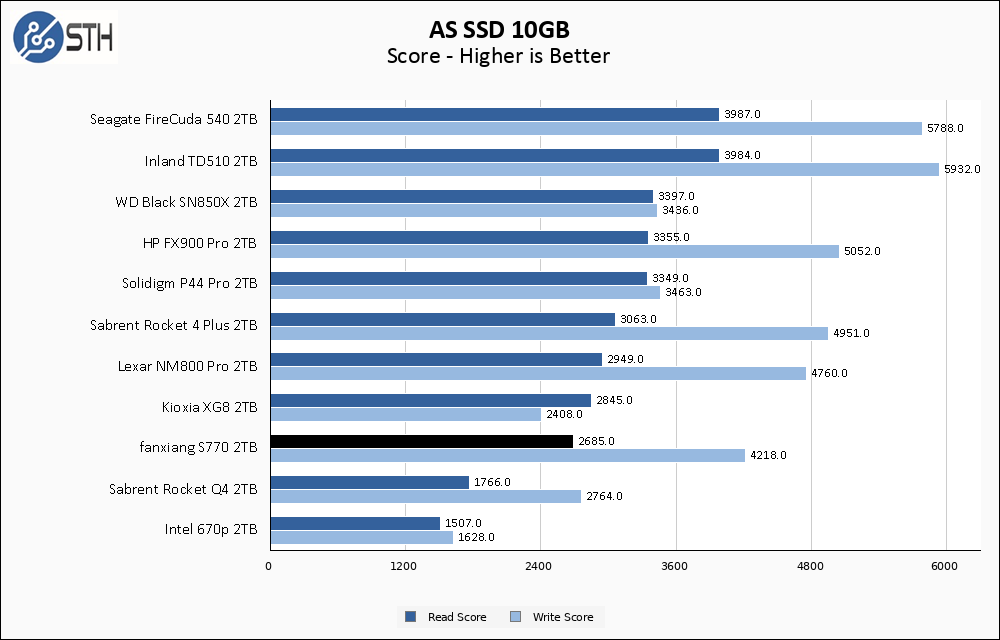
The larger AS SSD gives the Fanxiang S770 a win over the Kioxia XG8 at least. Throughout Anvil and AS SSD the S770 has been matching or slightly edging out the XG8 in write performance, but the larger AS SSD test allows the S770 to put some distance between it and the XG8.
SPECworkstation, thermals, and our conclusion are up next.


one comment:
please, put the raw values to 10hex in crystaldiskinfo. more human readable then 16 hex, which is jumbo-mumbo….make 10 hex as your default in cryataldiskinfo…
further, thanks for your effort…
@erik,
None of the values you are looking at will be particularly interesting regardless of display format, since it’s always a picture of essentially a brand new drive.
I think verifying the thermals reported by the drive with independent measurements would be useful for all SSDs. The thermals being more than reported could account for some of the inconsistencies during the testing.
Along similar lines, it would be interesting how well tools such as Linux smartctl work with each SSD and what information is actually reported.
RE temps – Jon Tanguy (Micron/Crucial) is quoted in “theregister”
” NAND, Tanguy explains, is happiest within a relatively narrow temperature band. “NAND flash actually likes to be ‘hot’ in that 60° to 70° [Celsius] range in order to program a cell because when it’s that hot, those electrons can move a little bit easier,” he explained.”
So has Fanxiang deliberately made the drive report incorrect temps ? And can they fix that remotely with a firmware update ? I have this exact drive on order from Amazon. Thanks Will for your reviews, they are very informative. Merry Christmas ?
I’ve bought some chinese SATA SSDs in the past that had harcoded temperatures.
I had an extremely useful comment and review and your anti-spam deleted it before it was even posted, before even sending anything, hadn’t even chose: name or email etc.. and it just detected something and erased the whole thing- congrats, you played yourself – what a great review system
2TB 90$?
Are you sure?
Can’t find in yours links that price…
Are you deleting any comments?
My comment was deleted!
my comment also not go thru
mine failed after 6 months lite use. stuck in read only .
231hrs use and 141 startups. used for gaming/internet.
still loads some of the games on it.
restarted windows after update and it was stuck in the start up screen.
Messaged via ebay fanxiang official, and after trouble shooting was offered
(nothing that i didn’t try from online help sources) a 1tb was offered to be delivered instead of the 2tb i brought..
Quote: “Hello?
Sorry for that. Because you have been using it for over six months. We considered the shipping and repairs fee, also we cannot determine whether the product issue is caused by operation or other issues. This is the best solution we can think of for you. You can consider it.Hope you can understand,thank you.Have a nice day!
Sincerely” If the ssd is genuinly delivered, it is kind of only lessens the loss, but is better than nothing i guess.
i did offer to pay to post it to them, and was open to any other suggestions.
con.. because it’s near dead weight (except it had all of my data viewable). I am curious if there are any pinouts/schematics that might hard enable a reset/delete everything.
e.g. using an external hdd to a phone charger/5w usb, and connecting e.g. pin a-b.
I do not know if your are reading this or not, but there is no sense in testing small files copy onto SSD. All SSD’s have about the same speed.
The only significant difference comes when drive no longer uses SLC write mode. There the real difference comes. Some junk nvme’s like NV2 drop write speed to 100MB/s
Others like KC3000 – have 2GB/s or even higher
Comments are closed.