Fanxiang S660 4TB Performance Testing
We test using both the default smaller test size as well as larger test sets on our benchmarks. This allows us to see the difference between lighter and heavier workloads.
CrystalDiskMark x64
CrystalDiskMark is used as a basic starting point for benchmarks as it is something commonly run by end-users as a sanity check.
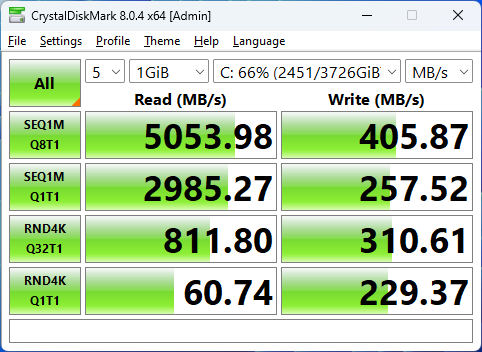
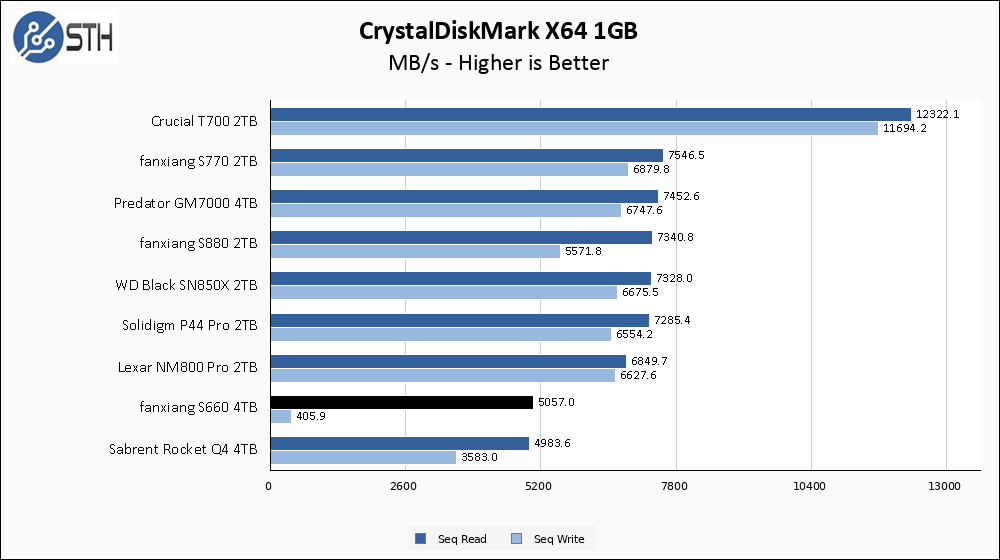
The Fanxiang S660 4TB starts off in CrystalDiskMark by nailing its sequential read speed target and then completely failing on write speed.
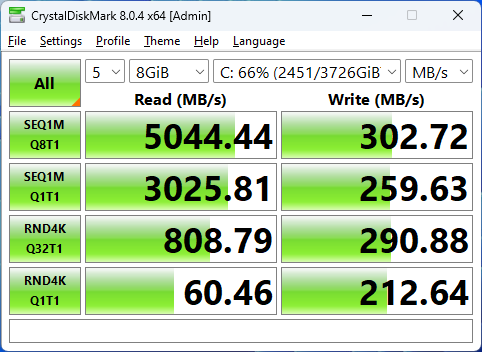
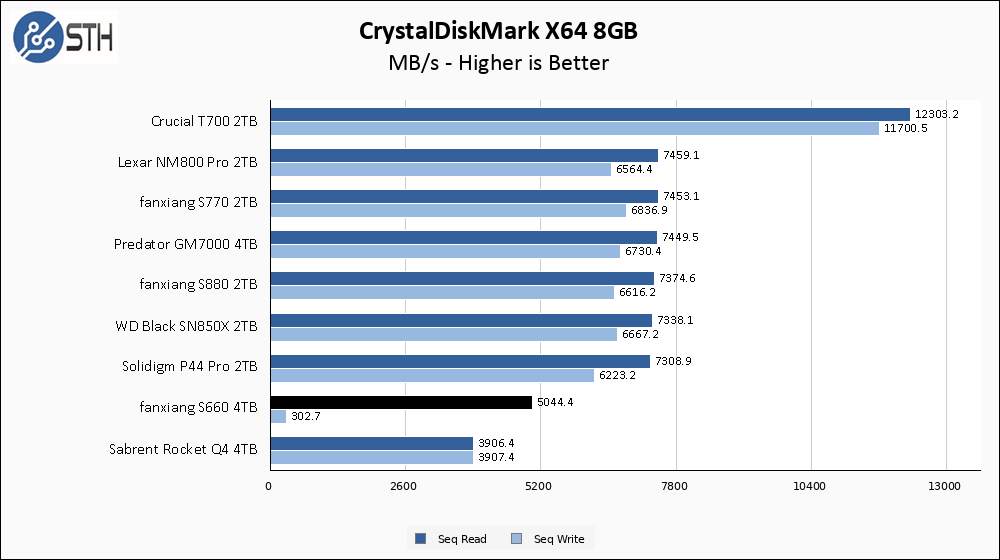
The larger CrystalDiskMark test shows the exact same results for the S660; competent read speeds, and incompetent write speeds. So what is going on here? Testing drives at a partially-used capacity strikes again! Here is the exact same CrystalDiskMark test run with the drive at 2% used capacity versus my standard 66%.
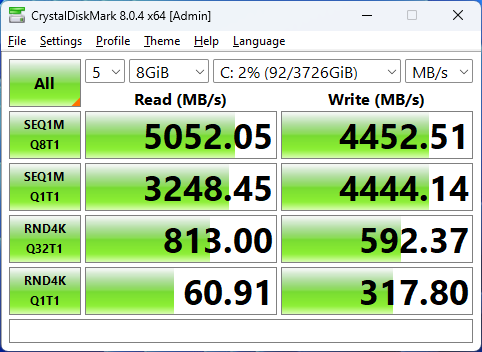
So fresh out of the box, the Fanxiang will perform exactly as it is rated. But as the percentage of the drive used goes up, you can expect the write speed to start faltering or, at best, being inconsistent.
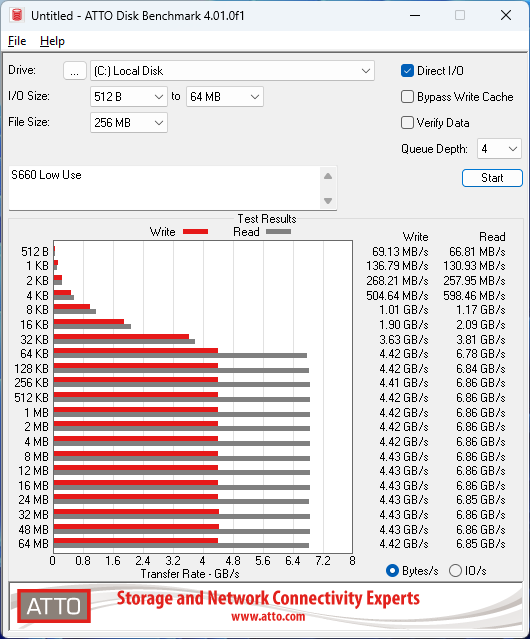
ATTO Disk Benchmark
The ATTO Disk Benchmark has been a staple of drive sequential performance testing for years. ATTO was tested at both 256MB and 8GB file sizes.
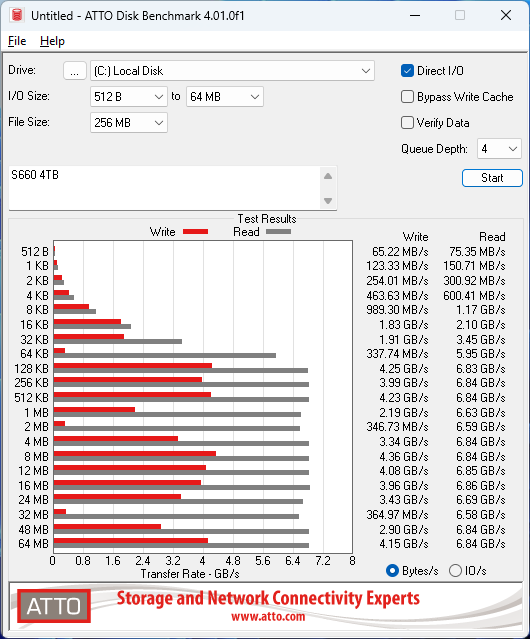
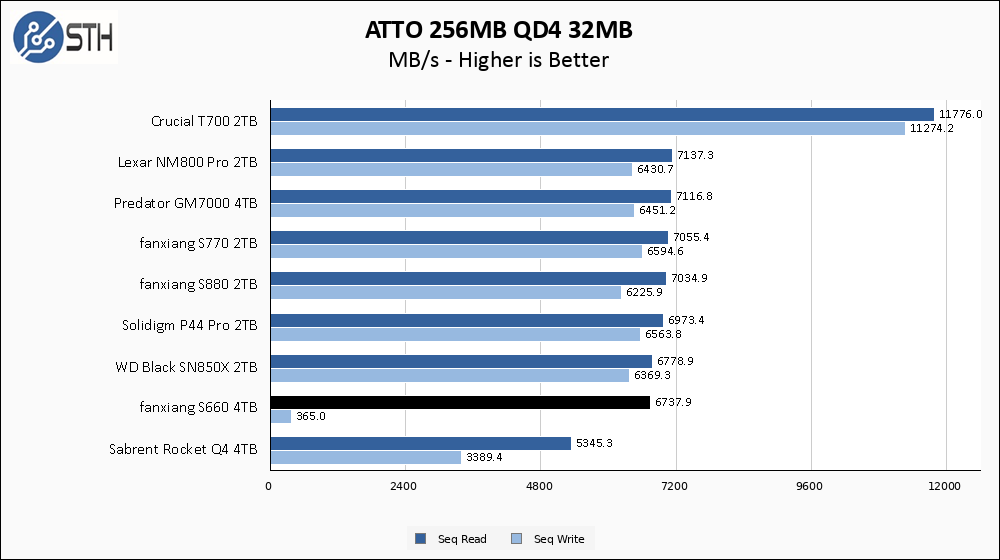
The luck of the draw here has the S660 turn in a terrible write result in ATTO. If you look at the actual benchmark result you can see that the write performance is not universally bad, it is more inconsistent and just happened to do terribly at the 32 MB chunk size that I use for generating the graph. In addition to that, I have seen anomalous read performance from the E21T in ATTO before, and the S660 shows that as well by turning in read results well above its pay grade.
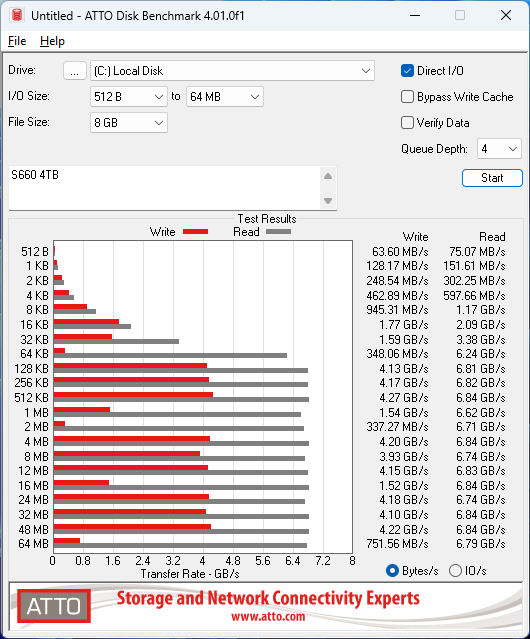
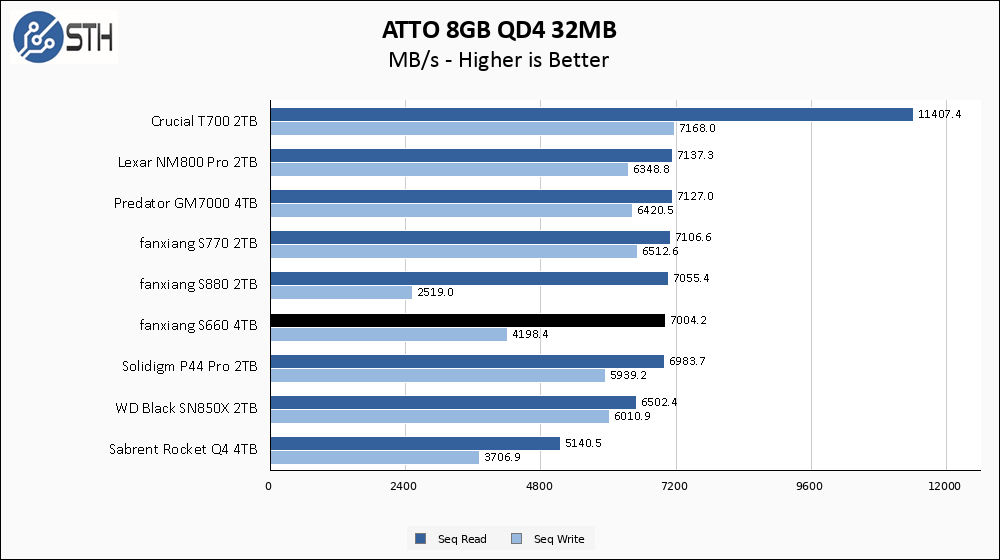
The S660 has better luck with the larger ATTO test, where it turns in a competent result at the 32 MB chunk size. Performance in general is a bit more consistent over the run, but compared to a drive with more free space performance is still inconsistent.
This is the last low-use benchmark result I am going to post, but I wanted to illustrate the complete change in the consistency of performance for this drive when comparing 2% use to 66% use.
Anvil’s Storage Utilities
Anvil’s Storage Utilities is a comprehensive benchmark that gives us a very in-depth look at the performance of the drives tested. This benchmark was run with both a 1GB and 8GB test size.
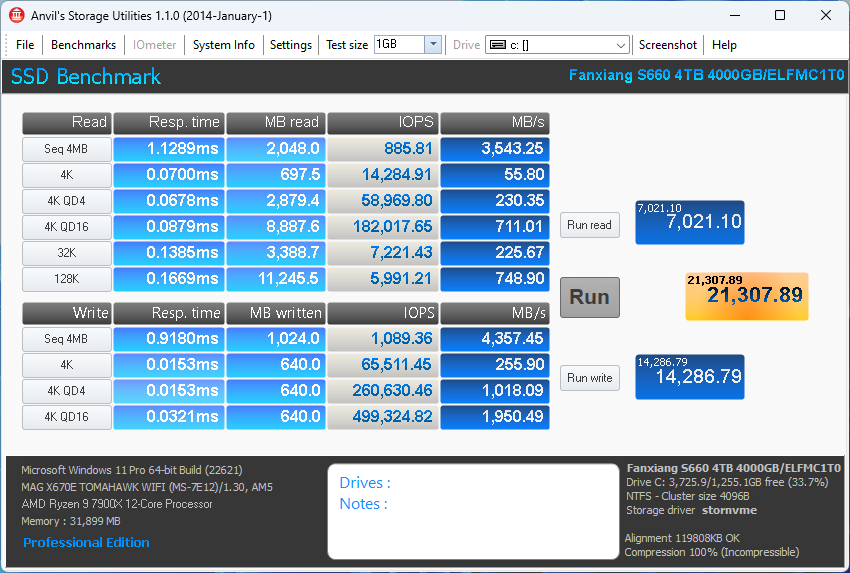
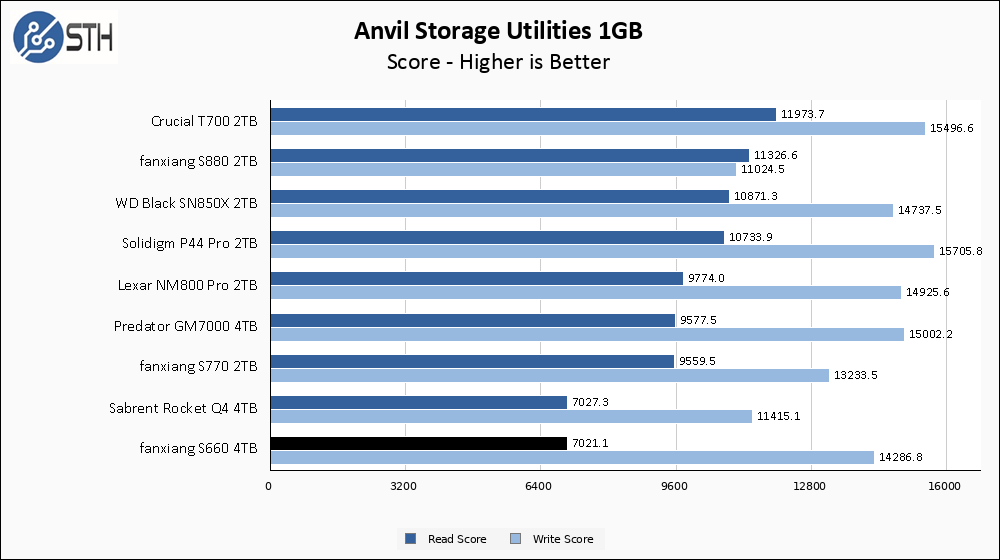
Performance in Anvil is at least more ‘normal’ than in the last two benchmarks. The S660 turns in its strongest results to date, while staying within the realm of plausible performance. Here, our results are fairly similar to the Sabrent Rocket Q4, which speaks well for the S660 as the Rocket Q4 was a higher-end drive than the S660 at the time of release.

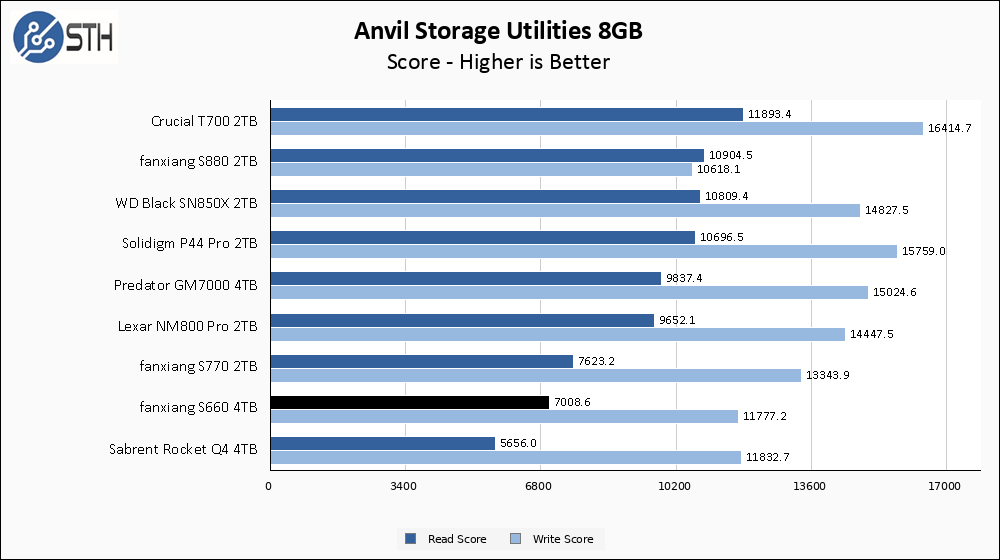
The larger Anvil test turns in continued good results for the Fanxiang S660, with read performance edging out the Rocket Q4 and approaching the S770. Write performance is a step behind the TLC drives for the most part.
AS SSD Benchmark
AS SSD Benchmark is another good benchmark for testing SSDs. We run all three tests for our series. Like other utilities, it was run with both the default 1GB as well as a larger 10GB test set.

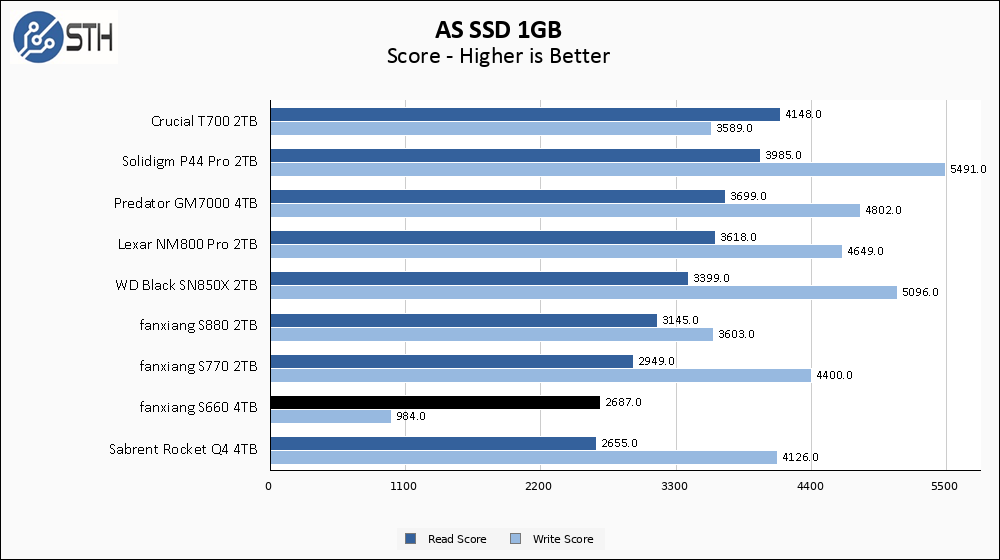
AS SSD results show the S660 once again struggling in the write department. I did not retest AS SSD at a low usage point, but I would imagine the results would dramatically improve as we have seen in other benchmarks.
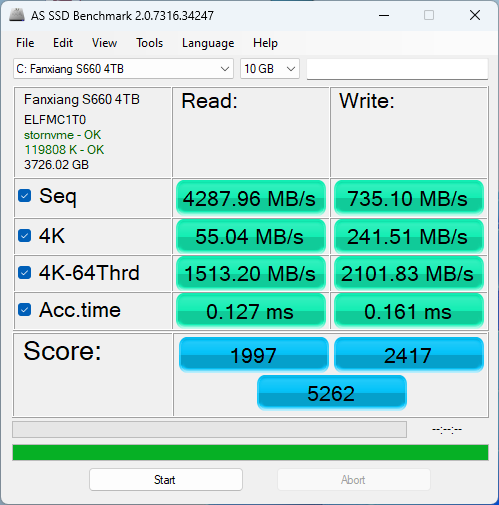
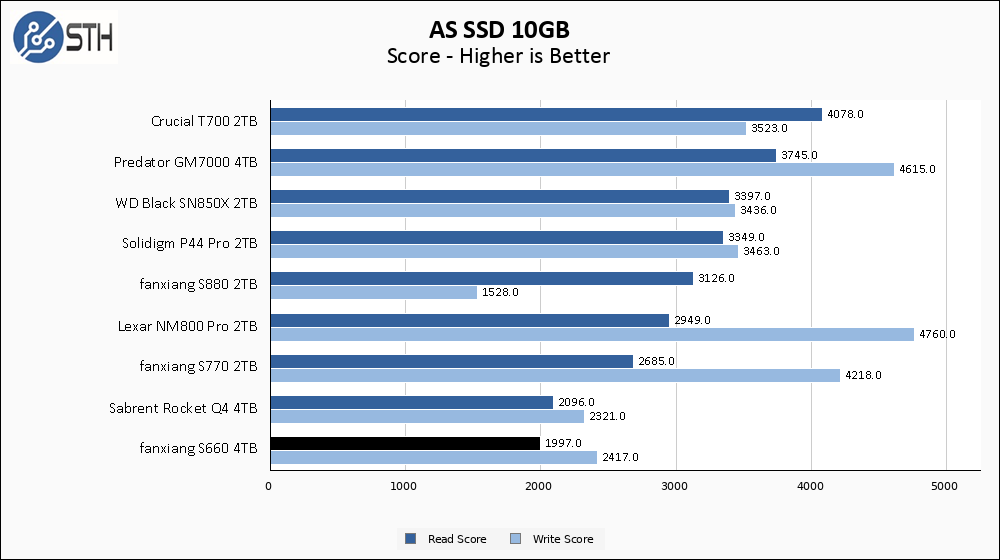
The larger AS SSD shows the performance inconsistency of the Fanxiang S660, as suddenly the write performance is back to competition with the Rocket Q4.
SPECworkstation, thermals, and our conclusion are up next.


To me it looks like the S660 is suffering from significant write amplification after its used up its SLC cache. Could that be the result of a firmware bug?
My emulators are currently on an old mechanical drive and I’ve recently been getting HD and 4K texture packs for my old PS2 and GameCube games and the mechanical drive just isn’t great for loading these new texture packs so I figured I’d grab a regular 2.5″ SSD. I was thinking about going with a 4TB just for the extra space to also install my PC games to. While searching I find that 4TB SATA SSDs are going for roughly the same price as this NVMe drive.
Seeing as how read speeds are more important for my use case I feel like this S660 from fanxiang, not to mention that the when the write speeds tank its pretty much at the levels of a SATA SSD anyway.
How did you figure out who made the nand modules? The lgom01tb4ncb1 and lp23230078 give no search results (also checked without the L as first character, as it looks a bit sketchy, but similarly no results)
Comments are closed.