Crucial T500 2TB Performance Testing
We test using both the default smaller test size as well as larger test sets on our benchmarks. This allows us to see the difference between lighter and heavier workloads.
CrystalDiskMark x64
CrystalDiskMark is used as a basic starting point for benchmarks as it is something commonly run by end-users as a sanity check.
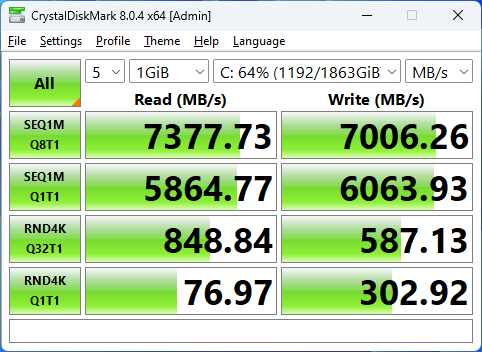
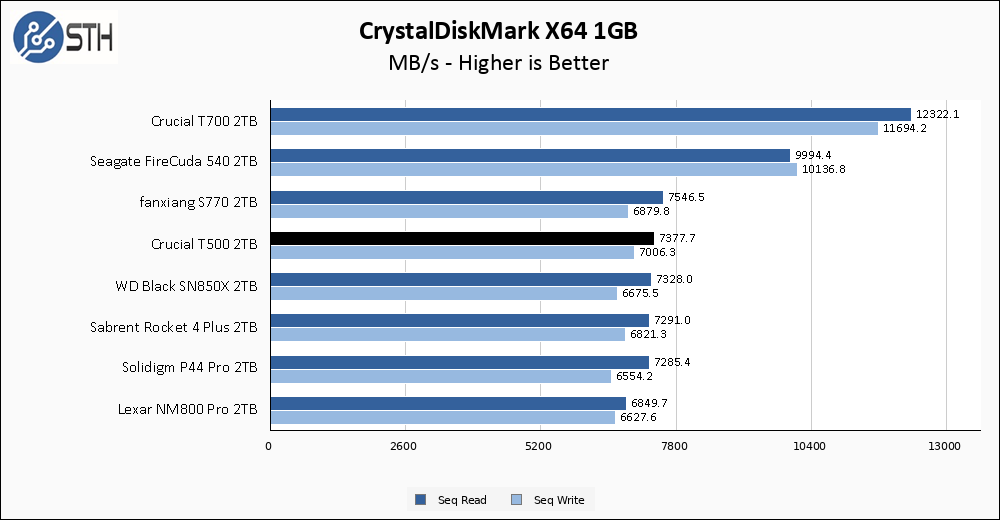
My graph dataset here is mostly PCIe Gen4 drives, with a pair of PCIe Gen5 drives thrown in for comparison. The T500 essentially hits its advertised sequential throughput, and as a result, comes in at the top of my Gen4 chart. For sequential performance, you have to go beyond Gen4 to beat the T500.
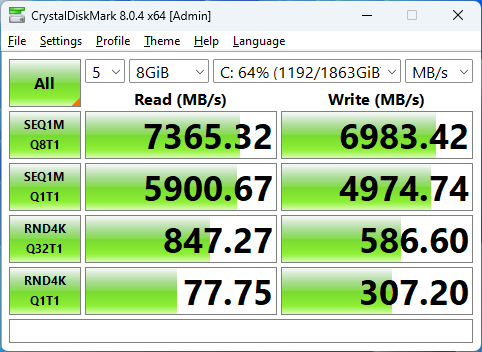
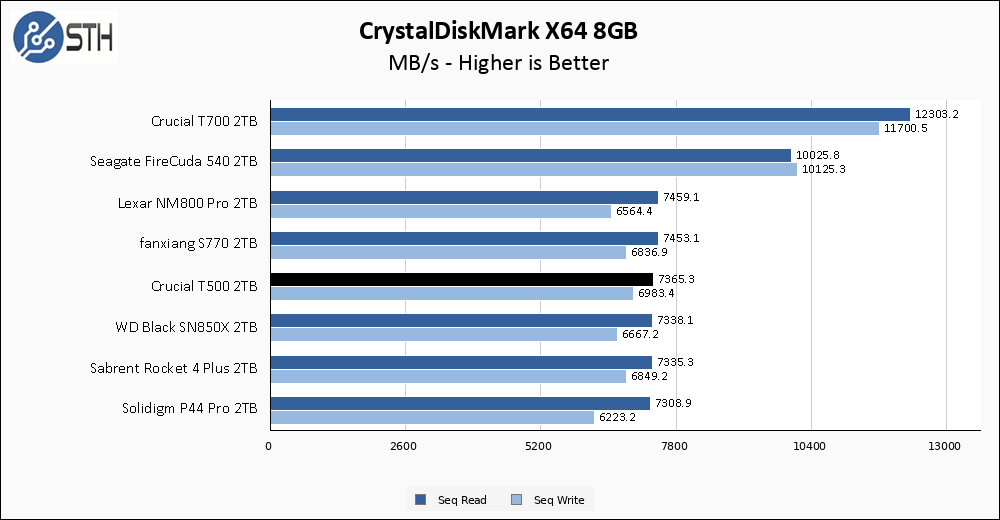
The larger CrystalDiskMark test shows the Crucial T500 sticking to its rated performance and thus is essentially class-leading among Gen4 drives.
ATTO Disk Benchmark
The ATTO Disk Benchmark has been a staple of drive sequential performance testing for years. ATTO was tested at both 256MB and 8GB file sizes.
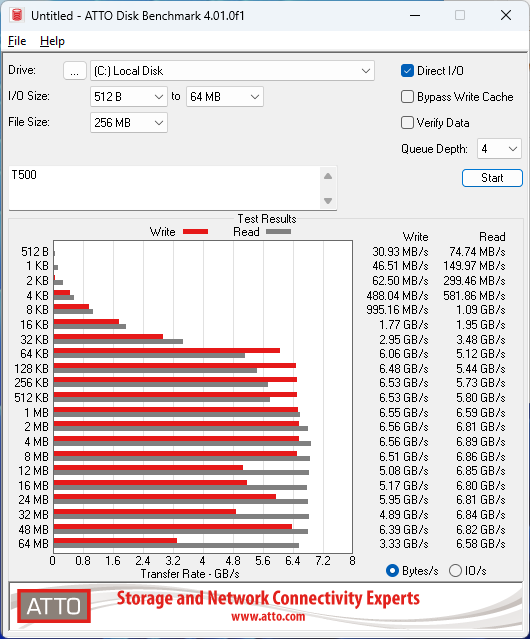
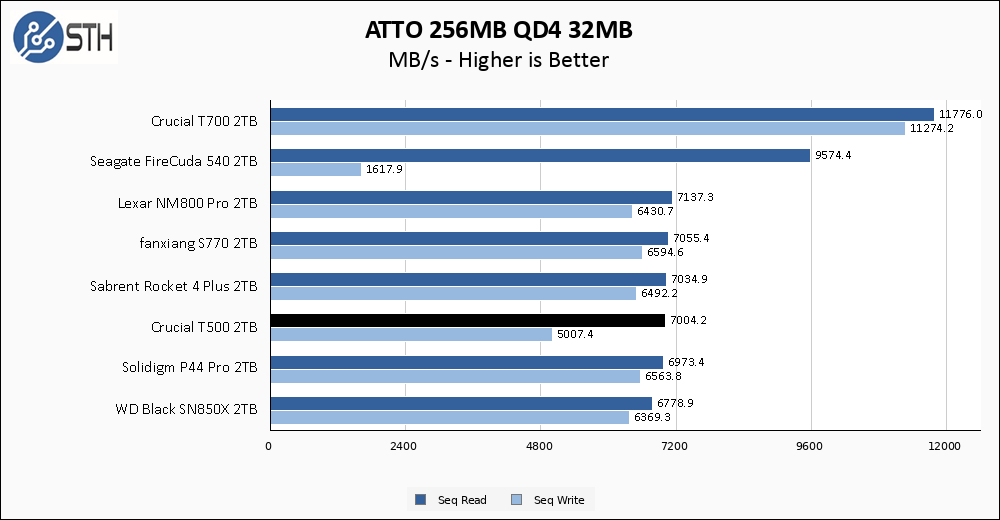
ATTO results tend to be significantly more variable than CrystalDiskMark, and the T500 shows that to some small degree. ATTO also tends to come in slightly slower than CrystalDiskMark and that has held here for essentially all our drives. A small dip in write speed is a bigger indication of some minor performance variability than it is any actual problem.
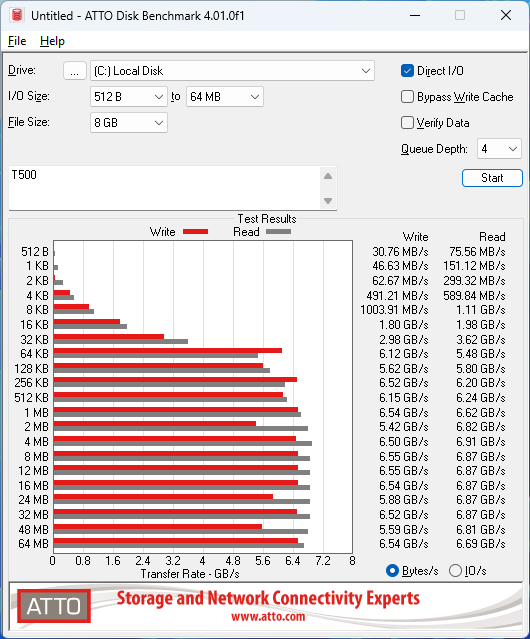
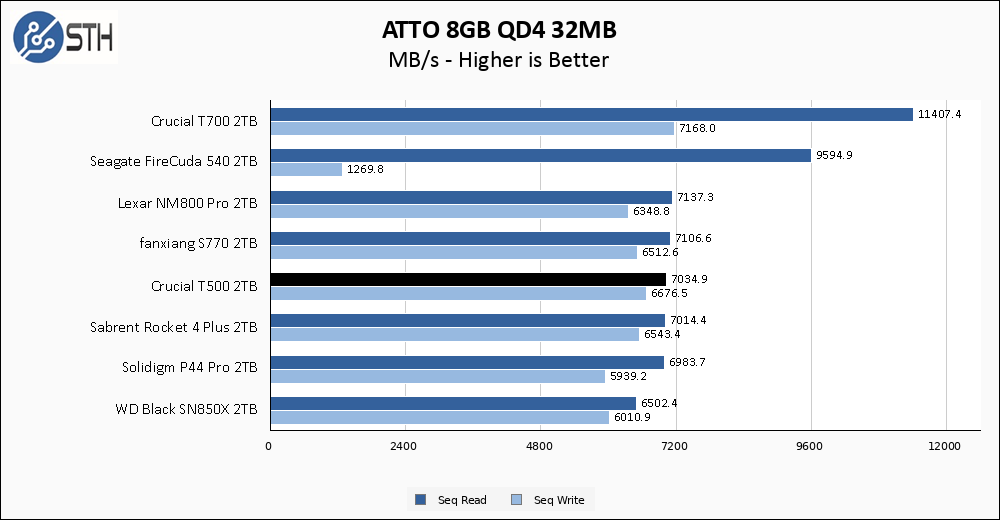
The larger ATTO test has the T500 turn in a better showing than the smaller test, but if you look at the complete results there is still some variability and run-to-run variance in the benchmark results. This is not unusual, but it is something to note.
Anvil’s Storage Utilities
Anvil’s Storage Utilities is a comprehensive benchmark that gives us a very in-depth look at the performance of the drives tested. This benchmark was run with both a 1GB and 8GB test size.
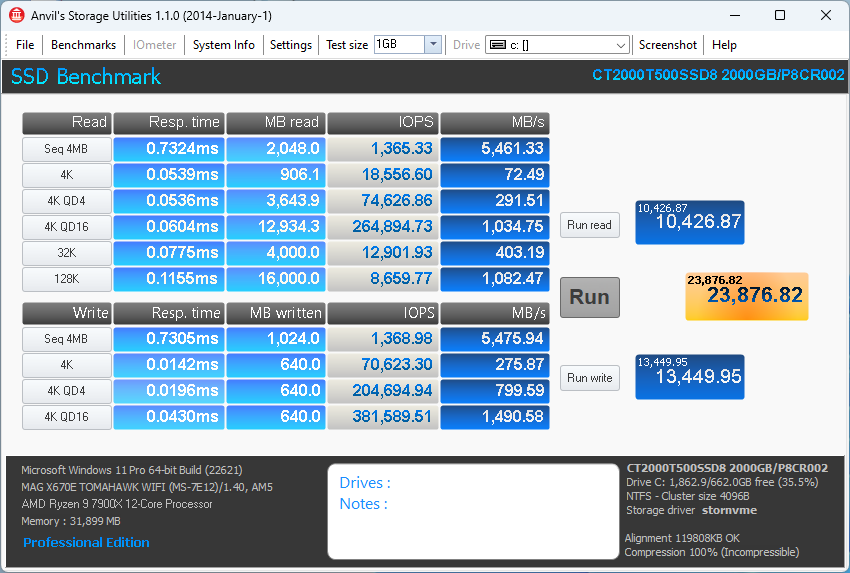
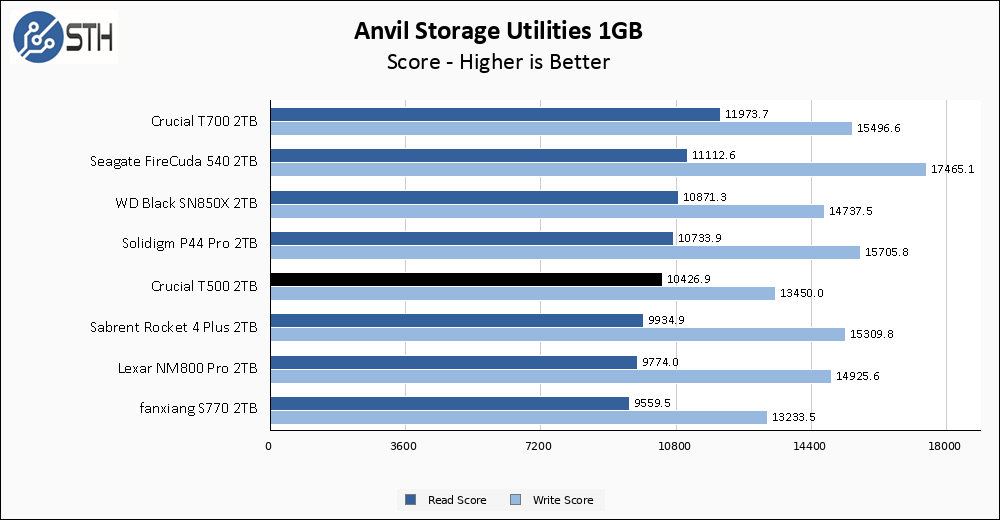
The Anvil results for the Crucial T500 are good, but not quite top of the charts. The WD SN850X turns in a bit higher read score, while several drives like the P44 Pro have a lead on the T500 for write score.
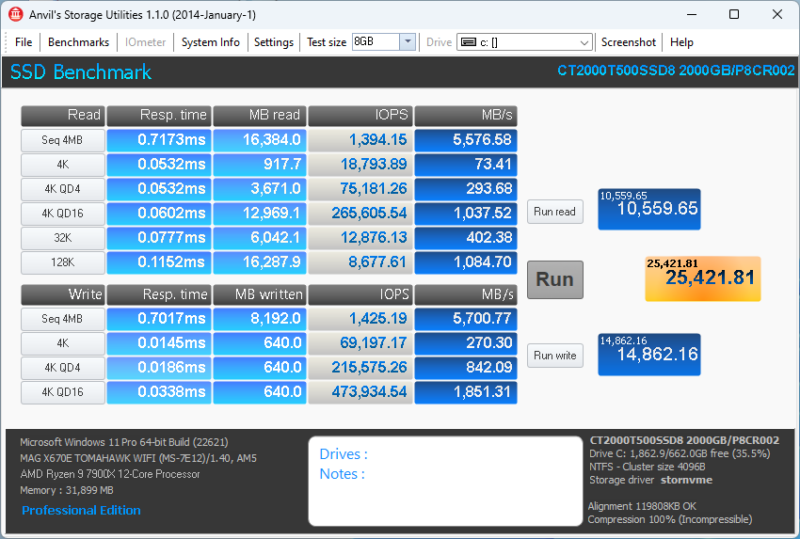
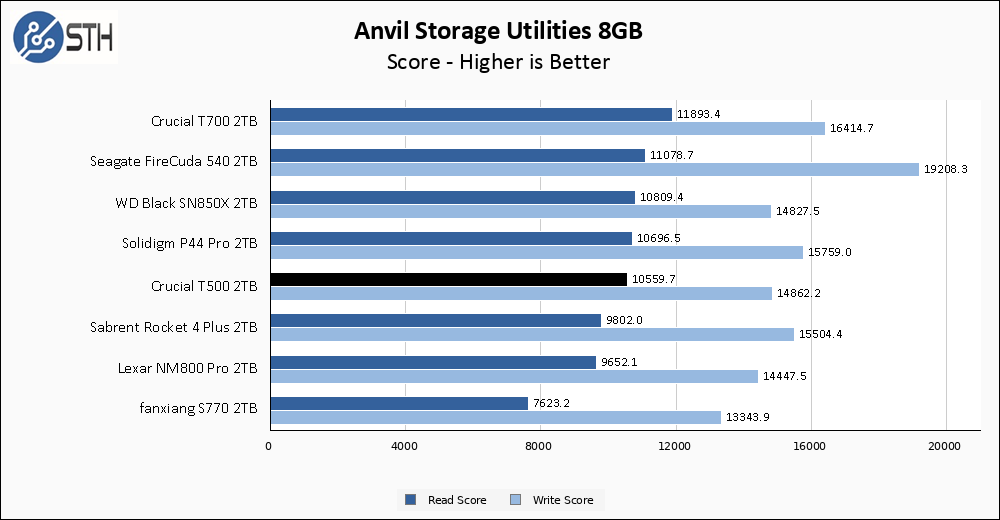
The best part of the T500 results on the larger Anvil test is that the T500 actually improves on its performance from the smaller test. Relative performance narrows a bit compared to the other drives, specifically with write score, though the T500 still is a half step behind.
AS SSD Benchmark
AS SSD Benchmark is another good benchmark for testing SSDs. We run all three tests for our series. Like other utilities, it was run with both the default 1GB as well as a larger 10GB test set.
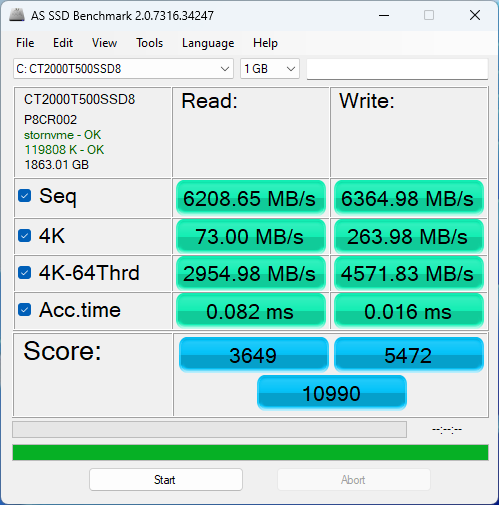
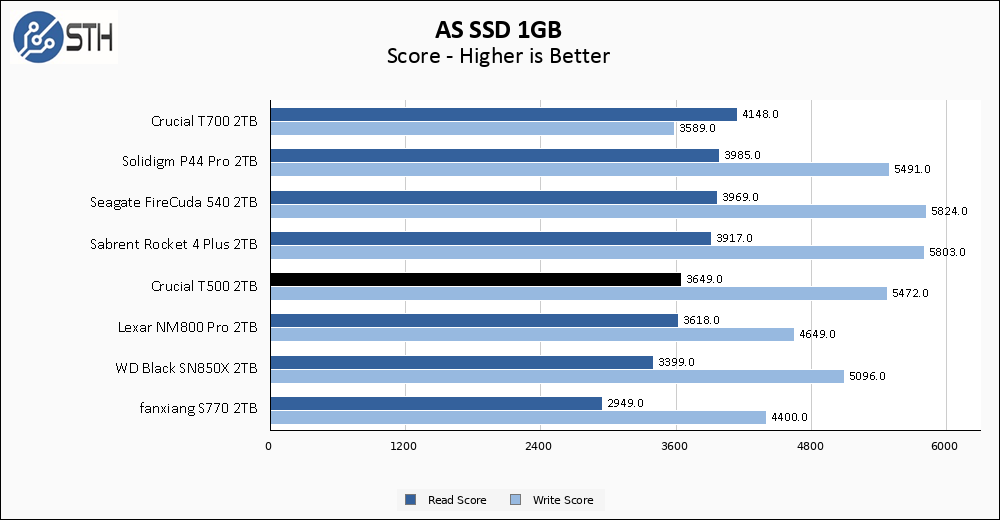
Much like the rest of the benchmarks I am running, AS SSD results for the T500 are pretty good. Read score is just a bit behind the frontrunner drives, and write score is in a similar position.
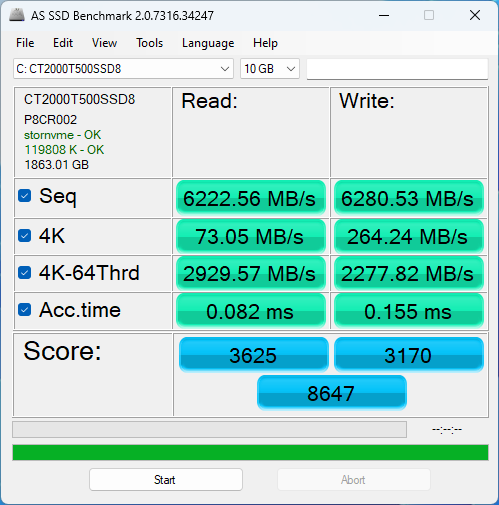
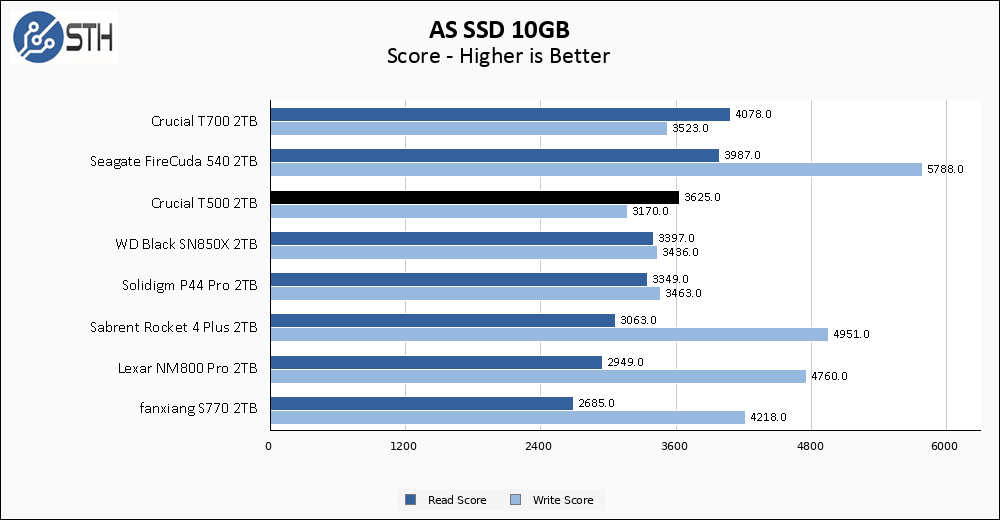
The larger AS SSD allows the Crucial T500 one more chance to acquit itself well in testing, and it does so once again. The T500 can be beaten on write score, but the read score shows it at the top of the Gen4 chart.
SPECworkstation, thermals, and our conclusion are up next.


For me the post-cache sustained write is one of the most meaningful metrics reported in these reviews. My impression is the low speed on the sustained write correlates with variable performance on the ATTO tests.
I wonder if good results for the simpler synthetic benchmarks have been optimised for by the manufacturer.
Can you elaborate on your post-cache write speed test?
Does this test mean that the drive is doing sustained writes of large files while the drive was already 85% full before the test began? Or does it mean the drive was almost empty before the test and then had 85% of it’s total capacity (around 1.53 – 1.7 TB) written in one go? Or does it mean a certain amount of data “sucked the drive’s cache dry” regardless of how much the drive itself was filled? Or does it mean that if the drive’s storage space is 85% or more filled up, it’s overall performance (sustained large files, random small files, gaming, day-to-day stuff, etc.) will terribly plummet?
What exactly is going on in that test in layman’s terms so that we, as users, know what conditions to avoid in order to avoid that performance-destroying situation?
Comments are closed.