Kaytus KSManage Overview Continued
Instead of looking at a few systems, you can define clusters and manage them as a group.
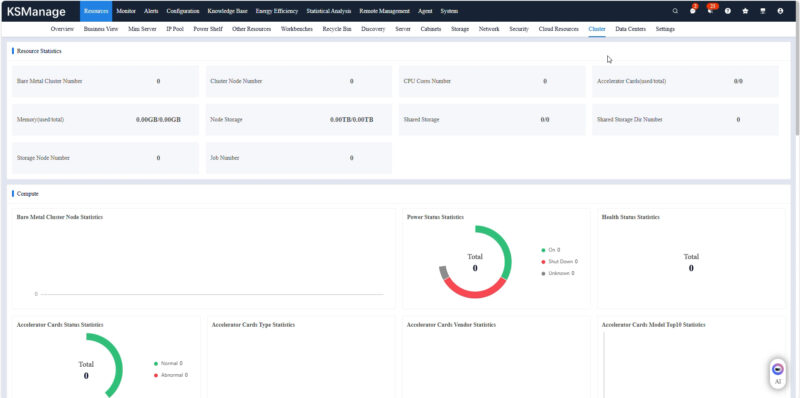
An example of why this matters is that you might have a cluster that has a maintenance window and all of those machines have firmware updated at the same time.
Beyond the clusters, there is also a view that is of entire data centers.
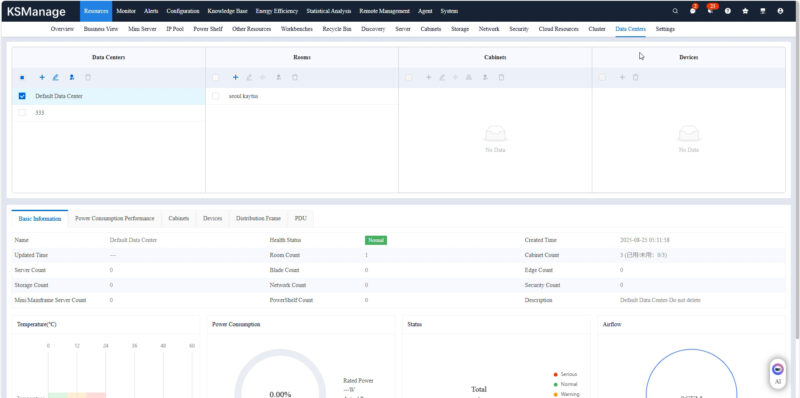
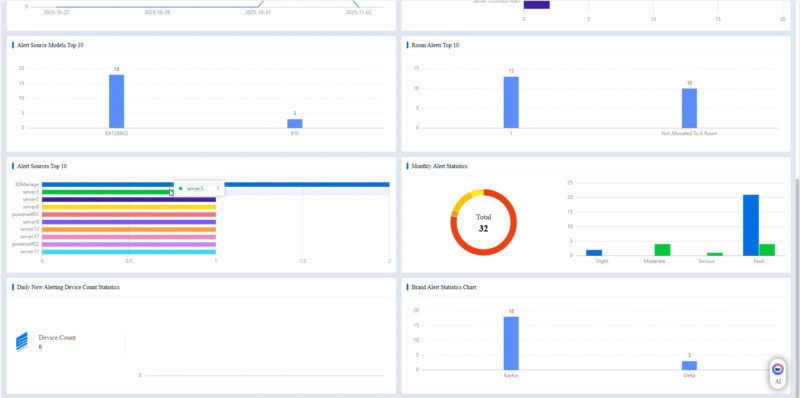
You can monitor the data center, and cluster utilization from the interface.
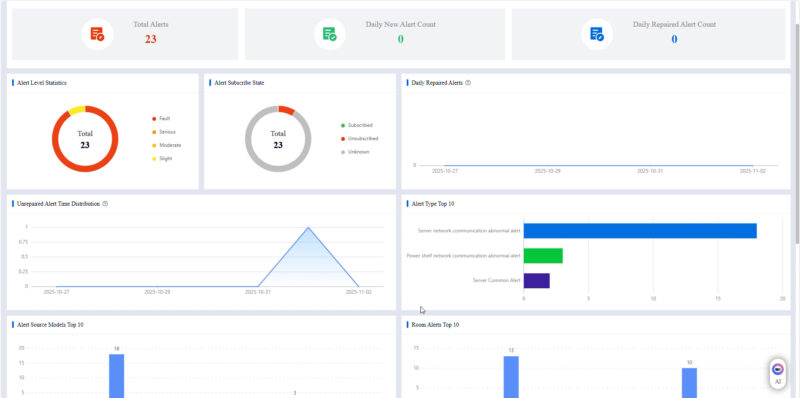
If something is looking off, you can also set off alerts. Another useful feature is that you can monitor the frequency of alerts.
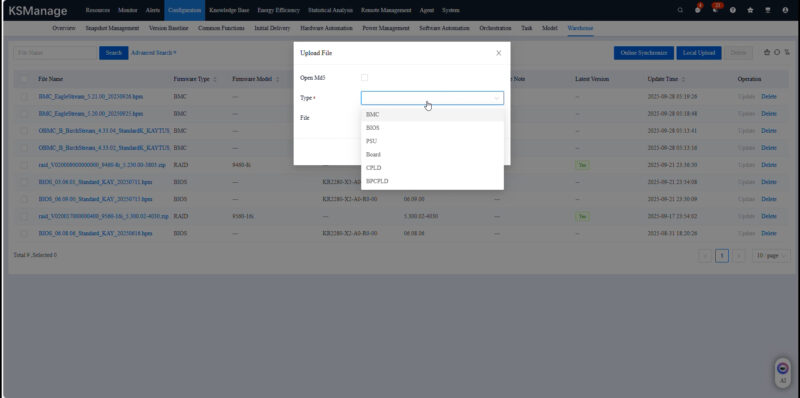
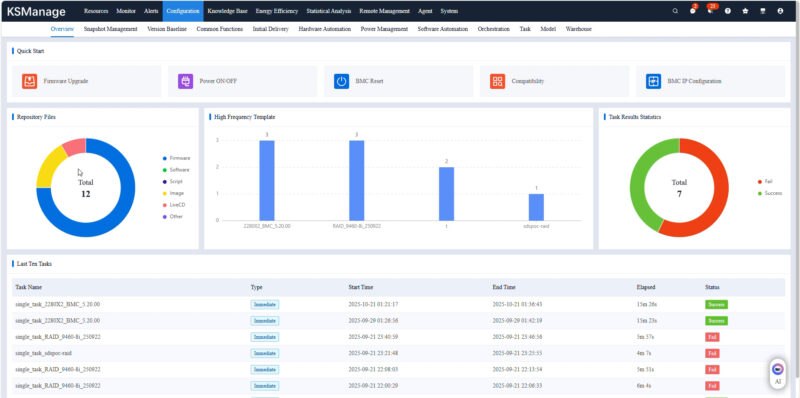
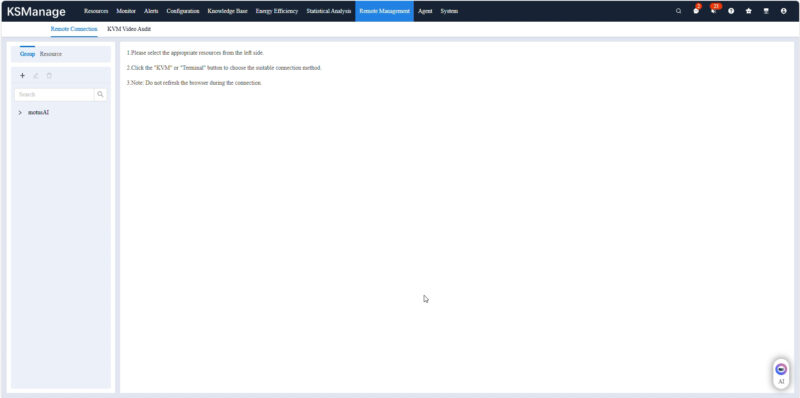
There is a section for configurations of systems, and even the ability to remotely power cycle and connect to the systems. That includes using remote KVM for management.
There is an energy efficiency section where you can see how the systems and data center are operating. We did not have this one setup, but we saw it in there.
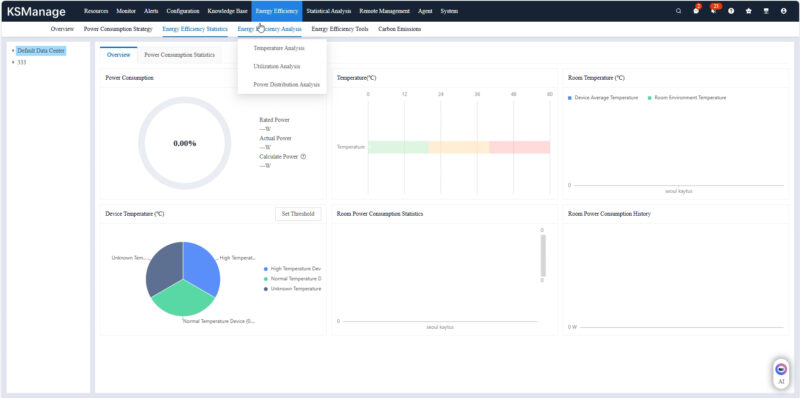
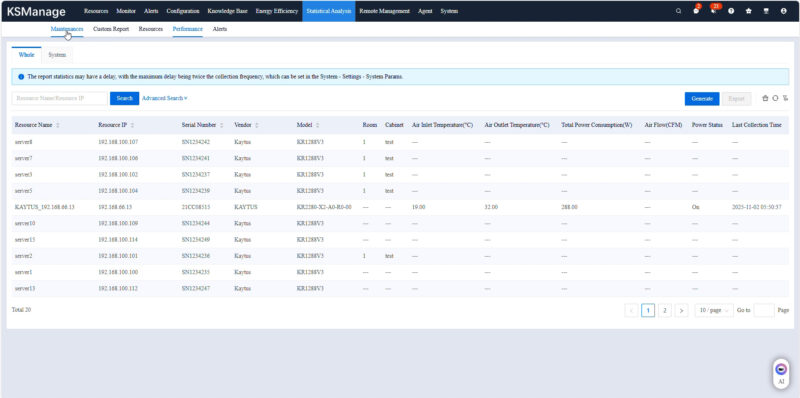
You can also do analysis, for example, if some machines are running faster than others, you can check the input temperatures to see if it is a cooling challenge.
Here was the KVM page.
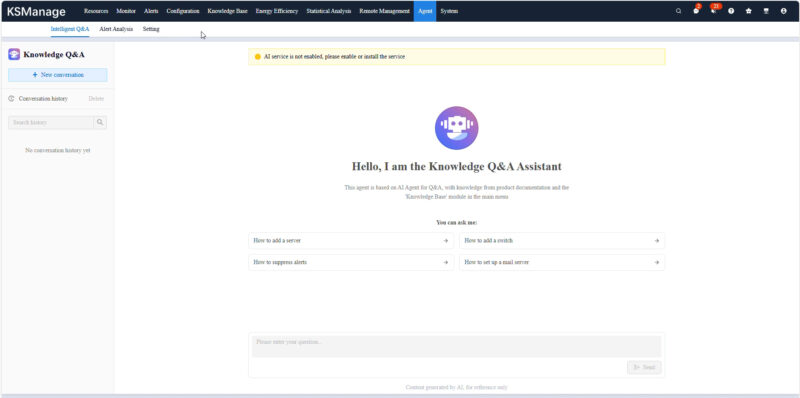
Since we are in the AI era, there is a chatbot service for Q&A. You can add questions like how do you add a switch to a cluster, and this feature will give you a response.
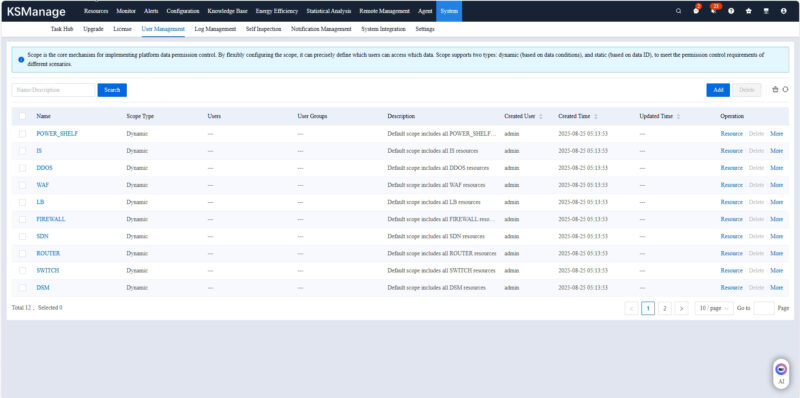
Of course, there is user management including multiple responsibility levels.
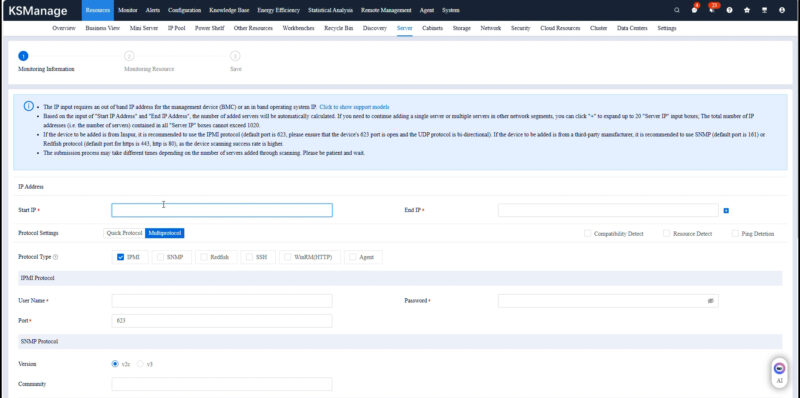
Here is the interface where you can find servers and other devices by scanning IP address ranges.
There are hundreds of views to look at here, but this is at least a flavor.
Final Words
Many of our readers work with custom management solutions or with others. We do not often get to show these since we are often reviewing single nodes. This was just a neat opportunity to show the KSManage solution by taking some screenshots as we were going through the solution.


