
When you have a large number of machines, along with other devices such as power shelves, cooling units, and so forth, the challenge is not only deploying those servers but also managing all the components and firmware. As a result, the management solutions are adapting to deploying not just single servers, but also integrated racks. Recently, we had the chance to jump into the Kaytus KSManage management solution for larger-scale AI clusters as part of another effort. We thought we would just take screen captures so folks could see what this package does, especially since we usually just review single nodes.
For this one, we have a short video you can check out for an overview.
A Quick Look at Kaytus KSManage Used to Manage Clusters of Servers
The first step was we had to login.
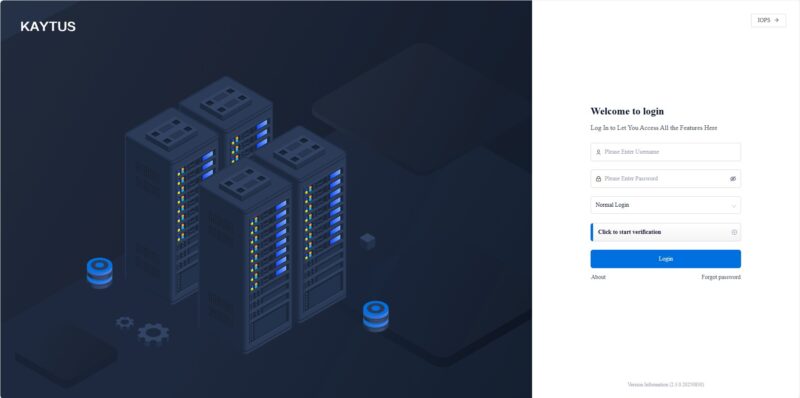
Logging in, there was a lot there. When you get to some management interfaces they are focused on hardware management, firmware, and so forth for servers. Often you see capabilities for networking and storage. What was different about KSManage is that it goes all the way to the cluster and data center view and includes cooling and power.
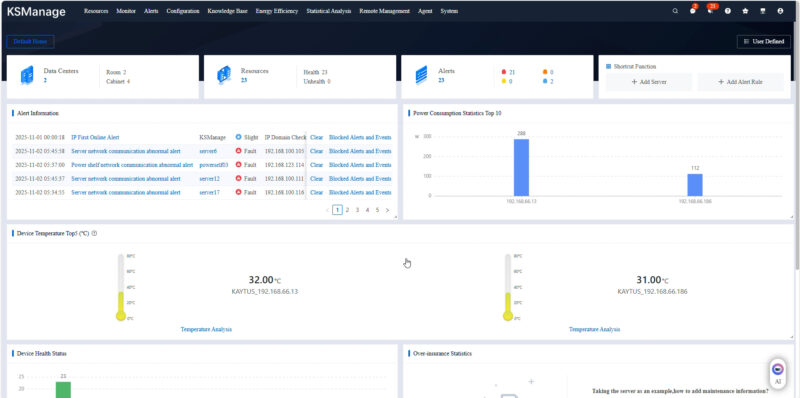
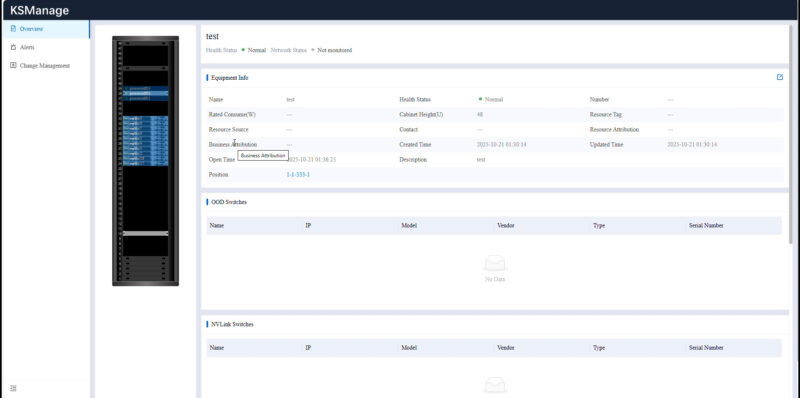
We had a test environment that we were logging into to get to a portion of a NVL72 rack, but it still had a lot of devices beyond the rack in the test environment.
Just to give some sense, now that we are moving to racks with power shelves that sit outside of the individual servers, the telemetry for those power shelves is not just in a server, but is now at the power shelf level. These days components
You can setup automation flows for routine tasks and those triggered by events.
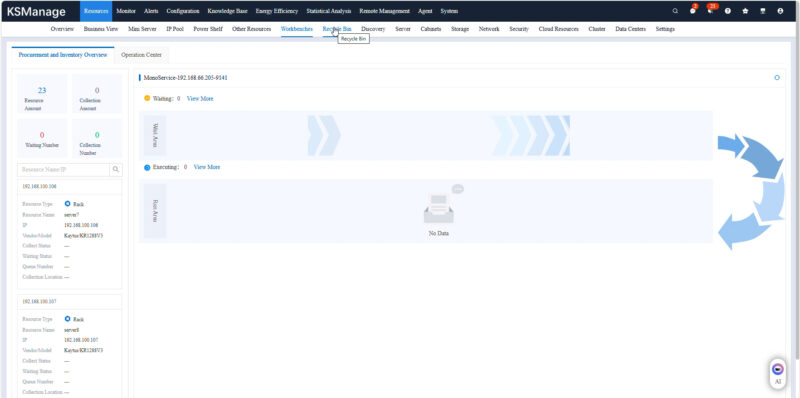
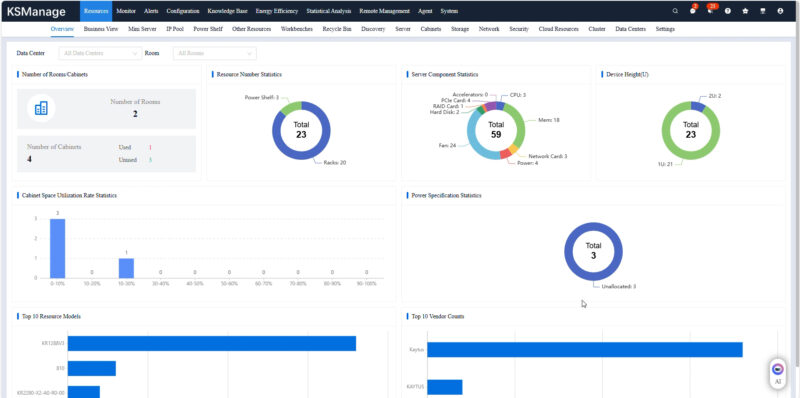
We not only had the GB200 node available, but also a number of other systems and devies in the data center.
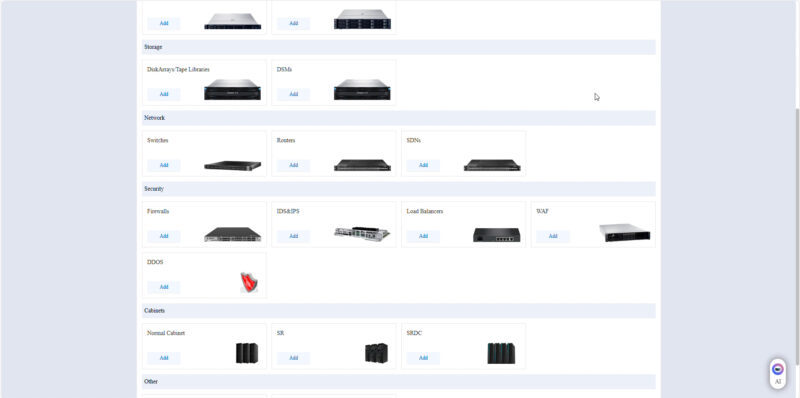
Those could be organized by data center, clusters, racks machine type, and so forth.
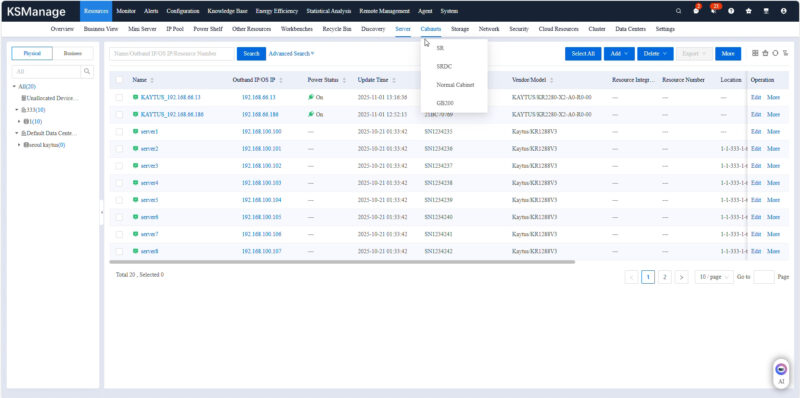
One of the neat ones is that we got on a part of a NVIDIA GB200 NVL72 rack.
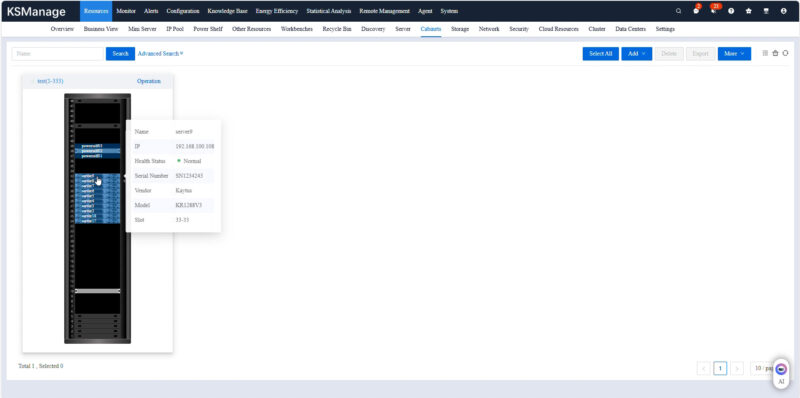
The rack also had a graphical view so you can just select the node that you want from the pictoral representation. In addition, have the ability to see and monitor the other components in the rack.
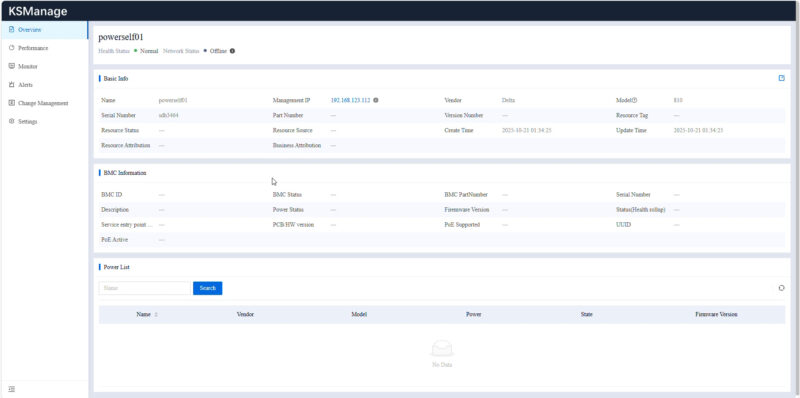
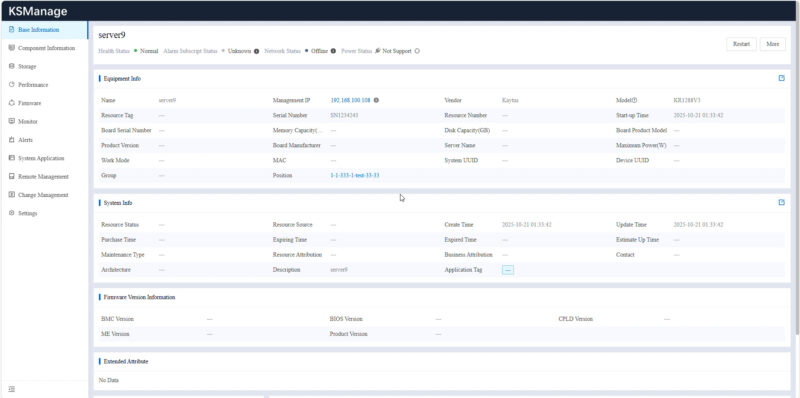
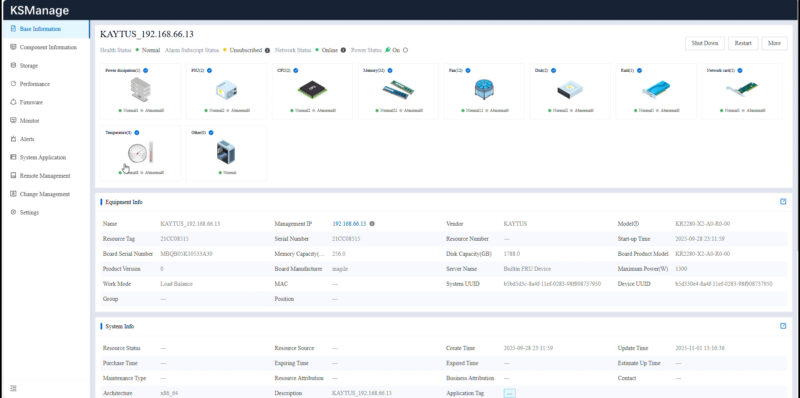
Here is an example drilling down into one of the servers we had access to.
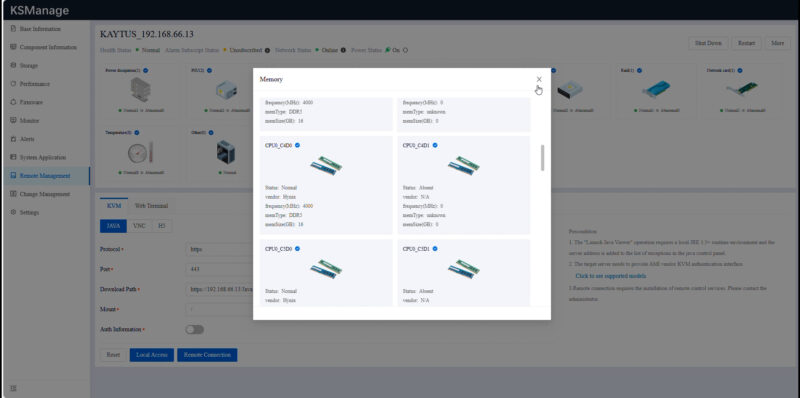
You can go through and see the component inventory. This may seem like a small feature since asset tracking has been around for some time. What is a more interesting use case is that in the context of an AI cluster you can us this information to track different components so if there is one component that needs to be monitored or replaced due to an issue the machines with that component can be located quickly.
An example of this might be if a particular DIMM model is an issue. Often systems deployed in multiple installments will have different memory models. This level of detail helps find which machines have those components.
Next, we will look at some more of the cluster-level items.


